XAGUSD Tests Resistance Near $82.06: A Multi-Scenario Outlook
Silver (XAGUSD) hovers around $82.06 as it approaches key resistance levels. We explore bullish, bearish, and neutral scenarios based on current market data and economic drivers.
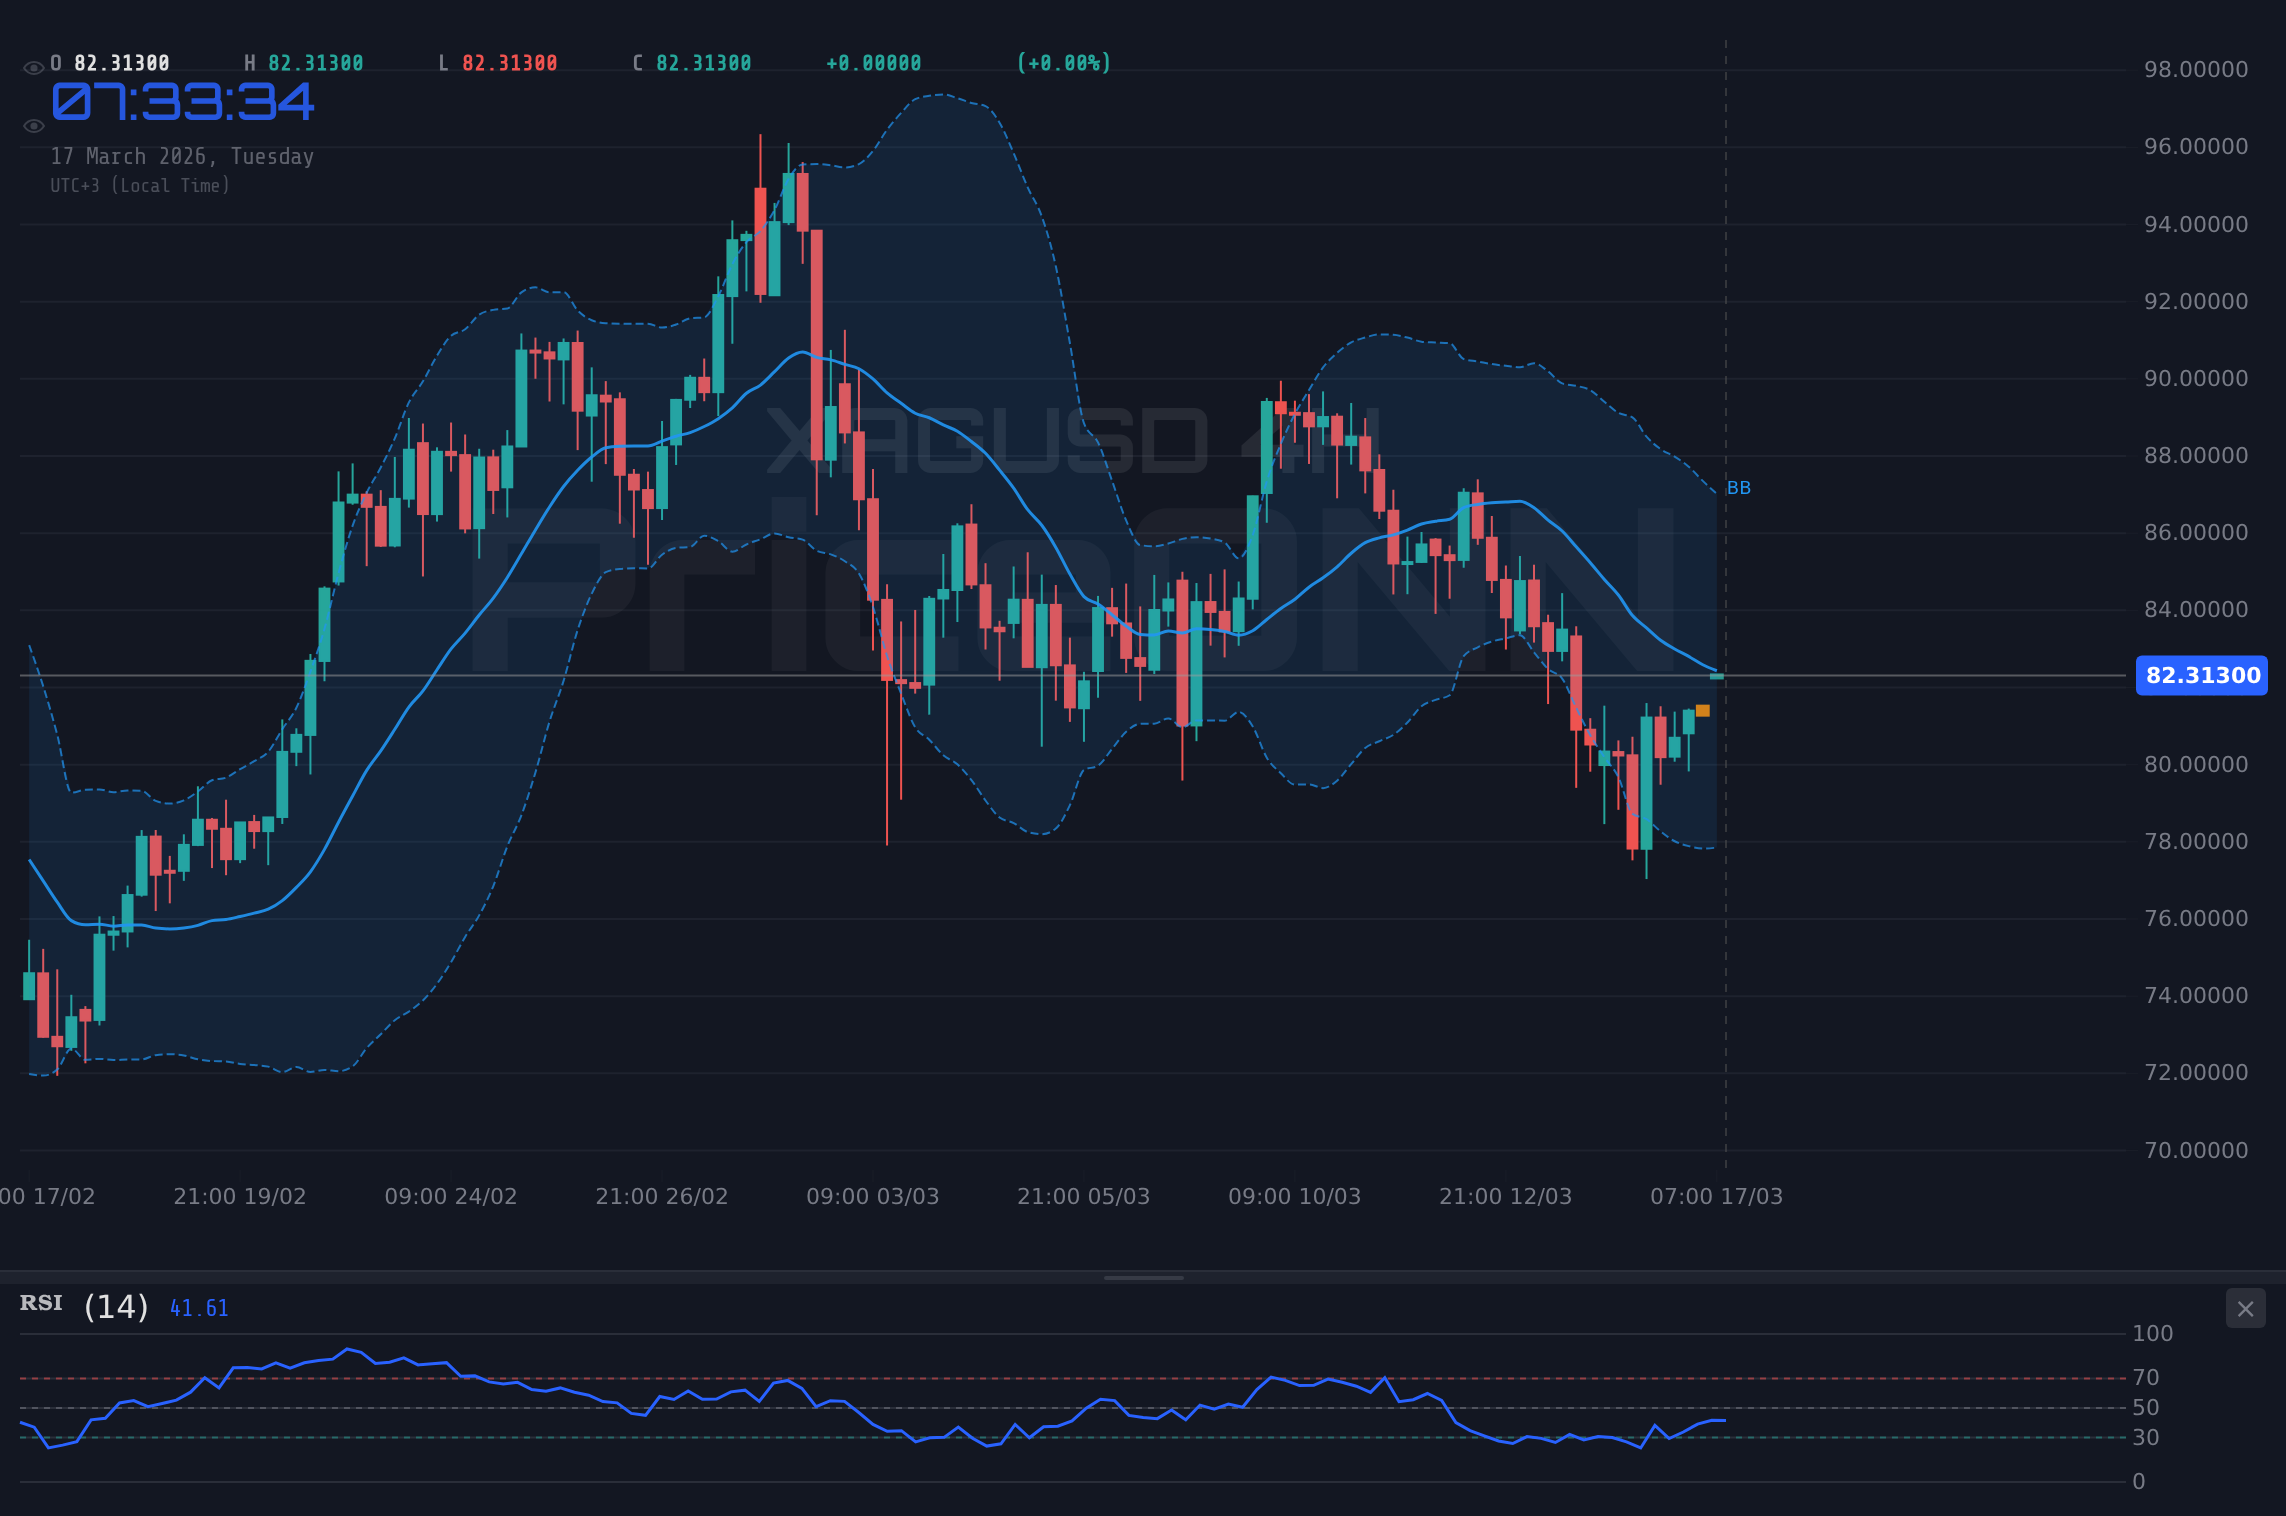
The current silver price, XAGUSD, is testing crucial resistance levels near $82.06 today. This pivotal moment demands a closer look at the underlying market dynamics and potential future price action. With a 1H timeframe showing a neutral trend and a 4H timeframe leaning towards a strong bearish trend, the immediate direction for XAGUSD hangs in the balance. This divergence suggests that while short-term momentum might favor a cautious approach, the longer-term technical picture presents conflicting signals, making this a critical juncture for traders to navigate. Understanding the interplay between technical indicators, economic fundamentals, and geopolitical undercurrents is paramount as we dissect the possibilities.
- XAGUSD is currently trading at $82.06, approaching critical resistance.
- On the 1H chart, RSI is 58.63, indicating a neutral-to-bullish leaning, while the 4H RSI sits at 46.88, suggesting a bearish bias.
- The DXY is at 99.68, showing strength which typically pressures silver prices.
- Geopolitical tensions in the Middle East are a significant factor influencing oil prices and potentially safe-haven assets like silver.
The Bull's Roadmap: Targeting Higher Levels
For silver bulls to seize control, a decisive break above the immediate resistance is necessary. Currently, the 1-hour chart paints a more optimistic picture, with an RSI of 58.63 and a general 'BUY' signal across most indicators. This suggests that intraday momentum could favor buyers. If XAGUSD can clear the initial resistance at $81.40, the next significant hurdle lies at $81.68, followed by $81.86. A sustained push above these levels, particularly if accompanied by increasing trading volume and positive news flow, could signal a shift in sentiment. The bullish scenario hinges on the ability of buyers to absorb selling pressure and establish higher lows. Historically, periods of uncertainty often see precious metals like silver benefit from safe-haven demand, and any hint of de-escalation in geopolitical hotspots or a dovish tilt from central banks could fuel such a move. The ADX at 24.54 on the 1H chart, while indicating a trend, isn't overwhelmingly strong, suggesting that a breakout, if it occurs, might still face some choppy conditions initially.
Furthermore, the Stochastic Oscillator on the 1H chart is showing a strong bullish signal with K at 91.54 and D at 72.8, indicating that the pair is entering overbought territory but %K is still above %D, suggesting upward momentum may continue in the short term. However, it's crucial to monitor the daily chart's signals. While the 1H is leaning bullish, the 1D chart shows a 'SELL' signal with an RSI of 47.32 and a weak ADX of 13.14, suggesting that any upward move might be short-lived without broader market confirmation. The interplay between intraday strength and the longer-term bearish undertones creates a complex environment. For a sustained bullish run, we would need to see a clear break and hold above the 4H resistance of $82.01, ideally fueled by weakening DXY or a significant shift in risk sentiment.
A confirmed close above the 4-hour resistance at $82.01, coupled with increasing volume and a softening US Dollar Index (DXY), would be the primary trigger for a bullish continuation towards $82.52 and potentially higher.
Where Bears Take Control: The Downside Risk
The bearish outlook for XAGUSD is compelling, particularly when examining the longer-term technical indicators. The 4H and 1D charts both present a strong 'SELL' signal, with the ADX at 43.15 and 31.53 respectively, indicating established bearish trends on these higher timeframes. The RSI values of 46.88 (4H) and 47.32 (1D) suggest room for further downside before entering oversold territory. Key support levels to watch on the downside are $80.95, $80.77, and $80.49 on the hourly chart, with more significant floors at $80.06, $79.42, and $78.76 on the 4H timeframe. A break below the $80.00 psychological level would be a strong bearish confirmation.
The current market environment, characterized by a strengthening US Dollar Index (DXY) at 99.68 and mixed signals from equity markets like the S&P 500 (currently at 6682.7, down 0.18%), adds weight to the bearish case. A stronger dollar typically exerts downward pressure on dollar-denominated commodities like silver, as it becomes more expensive for holders of other currencies. Furthermore, the recent volatility in oil prices, with WTI experiencing sharp swings, adds another layer of complexity. While geopolitical tensions can boost oil and by extension silver, a broader economic slowdown or easing energy concerns could lead to a risk-off sentiment that favors the dollar over commodities. The MACD on the 4H and 1D charts also shows negative momentum, reinforcing the idea that sellers are in command on longer timeframes. The Stochastic Oscillator on the 1D chart, with K at 14.84 and D at 27.98, also supports a bearish bias, as %K is below %D.
The recent news flow also hints at factors that could weigh on silver. While some reports mention escalating geopolitical tensions potentially boosting oil and safe havens, others point to easing oil prices below $100 and cooling inflation in Canada. If the broader market sentiment shifts towards risk aversion, driven by concerns about inflation or central bank tightening, demand for safe-haven assets like silver could diminish, especially if the US dollar continues its upward trajectory. The close below the 1D Bollinger middle band also suggests that the bearish trend is gaining traction on the daily timeframe.
A decisive break below the 4-hour support at $80.06, especially if accompanied by a strengthening DXY and continued weakness in risk assets, would confirm the bearish scenario and likely target lower levels.
The Waiting Game: Caught in a Range?
Given the conflicting signals between the short-term bullish momentum on the 1H chart and the established bearish trends on the 4H and 1D charts, XAGUSD could find itself in a period of consolidation. This neutral or range-bound scenario occurs when neither buyers nor sellers can gain a decisive advantage, leading to price action oscillating between support and resistance levels. On the hourly chart, resistance is observed at $81.40, $81.68, and $81.86, while support is found at $80.95, $80.77, and $80.49. A tight range between these levels could persist until a significant catalyst emerges.
Factors that could keep XAGUSD range-bound include mixed economic data releases, where positive news for one economy is offset by negative news from another, leading to indecision in currency markets and affecting dollar-linked commodities. Geopolitical events that remain at a simmering level rather than escalating into full-blown conflict can also create uncertainty without driving strong directional moves. Additionally, upcoming central bank meetings or key economic data releases, such as inflation reports or employment figures, can cause markets to pause and await further direction. During such periods, traders might adopt a strategy of buying at support and selling at resistance, though the risk of a breakout in either direction remains. The ADX values across different timeframes (24.54 on 1H, 43.15 on 4H, 13.14 on 1D) clearly show this conflict: a trending market on the 4H, a ranging market on the 1D, and a moderately trending market on the 1H. This mixed picture often leads to sideways price action.
The current price of $82.06 sits precariously between these conflicting signals. While the 1H chart suggests potential upside towards $82.52, the more dominant bearish signals on higher timeframes cap this potential. The lack of a clear directional bias from major economic indicators or definitive geopolitical shifts means that silver might tread water, reacting to minor fluctuations in the dollar and broader market sentiment without establishing a strong trend. This 'waiting game' can be frustrating for traders seeking clear entry points, but it also presents opportunities for range-trading strategies, provided risk management is strictly adhered to. The key to identifying a breakout from such a range lies in observing volume and the decisive breach of either the immediate support or resistance zones.
If XAGUSD fails to decisively break above $81.86 or below $80.49, expect a period of consolidation. Traders might look to buy near the lower bound and sell near the upper bound, but always with tight stops.
Which Scenario Holds Most Probability?
Assessing the probabilities, the current technical setup presents a challenging outlook. The strong bearish signals on the 4-hour and daily charts, coupled with a strengthening US Dollar Index (DXY) at 99.68, lend significant weight to the downside scenario. While the 1-hour chart shows some intraday bullishness, the longer-term trends often dictate the primary direction of travel for assets like silver. The ADX values on the 4H (43.15) and 1D (31.53) indicate strong trending conditions, albeit in opposite directions when compared to the 1H's weaker trend ADX (24.54). This suggests that the bearish momentum on higher timeframes is more entrenched.
However, we cannot entirely dismiss the bullish potential, especially given the current geopolitical climate. Escalating tensions in the Middle East, as reported, could continue to fuel safe-haven demand for gold and silver, potentially overriding some of the bearish technical indicators. The fact that XAGUSD is currently testing resistance near $82.06, rather than having already fallen, indicates buyer interest at these levels. If the DXY were to show signs of faltering, or if upcoming economic data were to disappoint in a way that suggests a Fed pause or pivot, silver could find significant upward momentum.
Considering all factors, the most probable scenario in the short to medium term appears to be a continuation of the bearish trend, albeit with potential for intraday bounces. The probability of a sustained move higher hinges heavily on external catalysts like a significant shift in Fed policy expectations or a dramatic escalation of geopolitical risks that strongly favors safe havens. Without such catalysts, the technical picture on higher timeframes and the strength of the dollar suggest a higher probability for downside. I would assign a probability of approximately 60% to the bearish scenario, 30% to a neutral range-bound market, and only 10% to a sustained bullish breakout in the immediate outlook. This assessment is dynamic and will shift based on incoming data and news.
Given the conflicting timeframes and macro factors, the bearish scenario holds the highest probability (approx. 60%) in the short-to-medium term. However, a significant geopolitical event or shift in Fed policy could dramatically alter this outlook.
What I'm Watching: Key Triggers for XAGUSD
To navigate the current choppy waters for XAGUSD, traders and investors should keep a close eye on several key triggers. Firstly, the immediate price action around the $81.86 resistance and $80.49 support levels on the 1-hour chart is critical. A decisive breach of either zone, especially with increased volume, will signal the likely direction for the next short-term move. Any sustained close above $82.01 on the 4-hour chart would be a significant bullish signal, potentially opening the door to $82.52 and beyond.
Secondly, the US Dollar Index (DXY) needs constant monitoring. Its current level of 99.68 indicates strength, which is a headwind for silver. A move below 99.50 or a clear break of the 4H support at 99.30 could signal dollar weakness, providing a tailwind for XAGUSD. We are also watching upcoming economic data releases. While specific dates aren't provided in the market context, key indicators like inflation reports (CPI/PCE), employment numbers (NFP), and manufacturing PMI data from major economies (US, Eurozone) will be crucial. A weaker-than-expected inflation or employment print could fuel speculation of a Fed pause, potentially weakening the dollar and supporting silver. Conversely, hotter inflation data would reinforce a hawkish Fed stance, likely pressuring silver.
Finally, geopolitical developments remain a wild card. Any significant escalation or de-escalation in the Middle East could trigger sharp moves in oil and subsequently in silver. The market's reaction to these headlines will be a key determinant of safe-haven flows. Observing how silver prices react to oil price movements and shifts in risk sentiment will provide further clues. The confluence of technical levels, macro data, and geopolitical events will ultimately dictate XAGUSD's path forward.
- Break of $81.86 resistance or $80.49 support on the 1H chart.
- DXY movement: A close below 99.50 could signal dollar weakness.
- Upcoming economic data: Inflation and employment figures will be critical for Fed policy expectations.
- Geopolitical news: Escalation/de-escalation in the Middle East.
Navigating the Uncertainty: A Trader's Perspective
As traders, we understand that periods of conflicting signals and market uncertainty can be challenging. The current XAGUSD environment, hovering around $82.06 with mixed technical indicators and geopolitical undercurrents, exemplifies this. It's precisely in these moments that discipline and a clear strategy become our greatest assets. The temptation to force a trade when the market isn't offering a clear conviction can lead to costly mistakes. Instead, focusing on patience and waiting for confirmed setups is key.
We've seen how the 1-hour chart offers some bullish signals, but the dominant bearish trends on the 4-hour and daily charts cannot be ignored. This discrepancy highlights the importance of multi-timeframe analysis. A short-term trader might look for intraday opportunities based on the 1H chart, but they must be prepared for potential reversals if the higher timeframes assert their influence. Conversely, a longer-term investor might view any pullbacks as potential accumulation opportunities, provided they have a strong conviction in the long-term bullish case for silver, perhaps driven by inflation hedging or industrial demand expectations. However, the current data doesn't strongly support such a long-term bullish conviction without significant shifts in macro conditions.
The strengthening dollar, currently at 99.68, remains a significant headwind. Historically, a strong dollar often correlates with lower prices for dollar-denominated assets like silver. Therefore, any strategy should ideally incorporate the dollar's movement. If the dollar begins to weaken, it could provide the necessary catalyst for silver to break its current resistance. Until then, caution is advised. It’s important to remember that market conditions are always evolving. The geopolitical situation in the Middle East, for instance, remains a volatile factor that could rapidly change the safe-haven narrative for silver. Staying informed and adaptable is crucial.
Risk management remains paramount. For those considering a bullish position, strict stop-losses below key support levels like $80.49 are essential. For those anticipating further downside, confirmation below $80.06 would be a key entry trigger, with stops placed above the immediate resistance. For traders preferring to stay on the sidelines, observing the price action around the current $82.06 level and waiting for clearer signals is a perfectly valid and often more profitable strategy. The market always offers opportunities, and forcing them often leads to regret. Patience, discipline, and a well-defined plan are the cornerstones of successful trading, especially in complex environments like the one XAGUSD currently presents.
In volatile markets like silver, sticking to your trading plan and managing risk are paramount. Don't chase trades; wait for clear setups that align with your strategy and risk tolerance.
FAQ: Decoding XAGUSD's Current Moves
Frequently Asked Questions: XAGUSD Analysis
What happens if XAGUSD breaks above the $81.86 resistance level?
A decisive break and sustained hold above the hourly resistance at $81.86, particularly if confirmed by increasing volume and a weaker US Dollar Index, could signal a bullish continuation. This scenario would likely target the next resistance levels around $82.52 and potentially extend towards $83.00 in the short term.
Should I consider buying XAGUSD at current levels near $82.06 given the mixed signals?
Buying at current levels requires significant caution due to conflicting signals between short-term bullishness and longer-term bearish trends. A high-probability entry would likely require confirmation of a break above $82.01 on the 4H chart, or a clear reversal pattern forming near support levels around $80.49, ideally with a softening DXY.
Is the RSI at 58.63 on the 1H chart a buy signal for XAGUSD?
An RSI of 58.63 on the 1H chart indicates a neutral-to-bullish leaning, suggesting upward momentum is present but not yet in overbought territory. While it supports a potential short-term move higher, it should not be acted upon in isolation. Confirmation from other indicators and price action, especially considering the bearish signals on higher timeframes, is crucial.
How might escalating Middle East tensions impact XAGUSD this week?
Escalating geopolitical tensions typically increase safe-haven demand for assets like silver and gold. If tensions intensify significantly, it could override bearish technicals and dollar strength, potentially pushing XAGUSD towards higher resistance levels. Conversely, any signs of de-escalation could reduce safe-haven bids and weigh on silver prices.
| Indicator | Value | Signal | Interpretation |
|---|---|---|---|
| RSI (1H) | 58.63 | Neutral | Approaching overbought, but still room to climb |
| RSI (4H) | 46.88 | Bearish | Suggests downward pressure building |
| MACD (1H) | Positive | Bullish | Momentum favors buyers |
| MACD (4H) | Negative | Bearish | Momentum favors sellers |
| Stochastic (1H) | K:91.54, D:72.8 | Bullish | Entering overbought, but %K > %D |
| ADX (4H) | 43.15 | Strong Trend | Indicates strong bearish trend |
Track markets in real-time
AI-powered analysis, technical indicators and real-time price data.
Join Our Telegram Channel
Breaking market news, AI analysis and trading signals instantly.
Join Channel