WTI Crude Oil Hovers Near $95.92 Amid Bull-Bear Tug-of-War
WTI crude oil is trading at $95.92, caught between escalating geopolitical tensions and moderating inflation expectations. Bulls eye $100 resistance, while bears watch key support levels.
The energy markets are currently witnessing a fierce battle for control of West Texas Intermediate (WTI) crude oil. Trading precariously close to the $95.92 mark, WTI finds itself at a critical juncture, a battleground where bullish aspirations clash with bearish pressures. This pivotal moment isn't just about the current price; it's a complex interplay of escalating geopolitical risks in the Middle East, shifting inflation expectations, and the ever-present influence of central bank monetary policy. Understanding the forces driving this tension is key to navigating the choppy waters ahead.
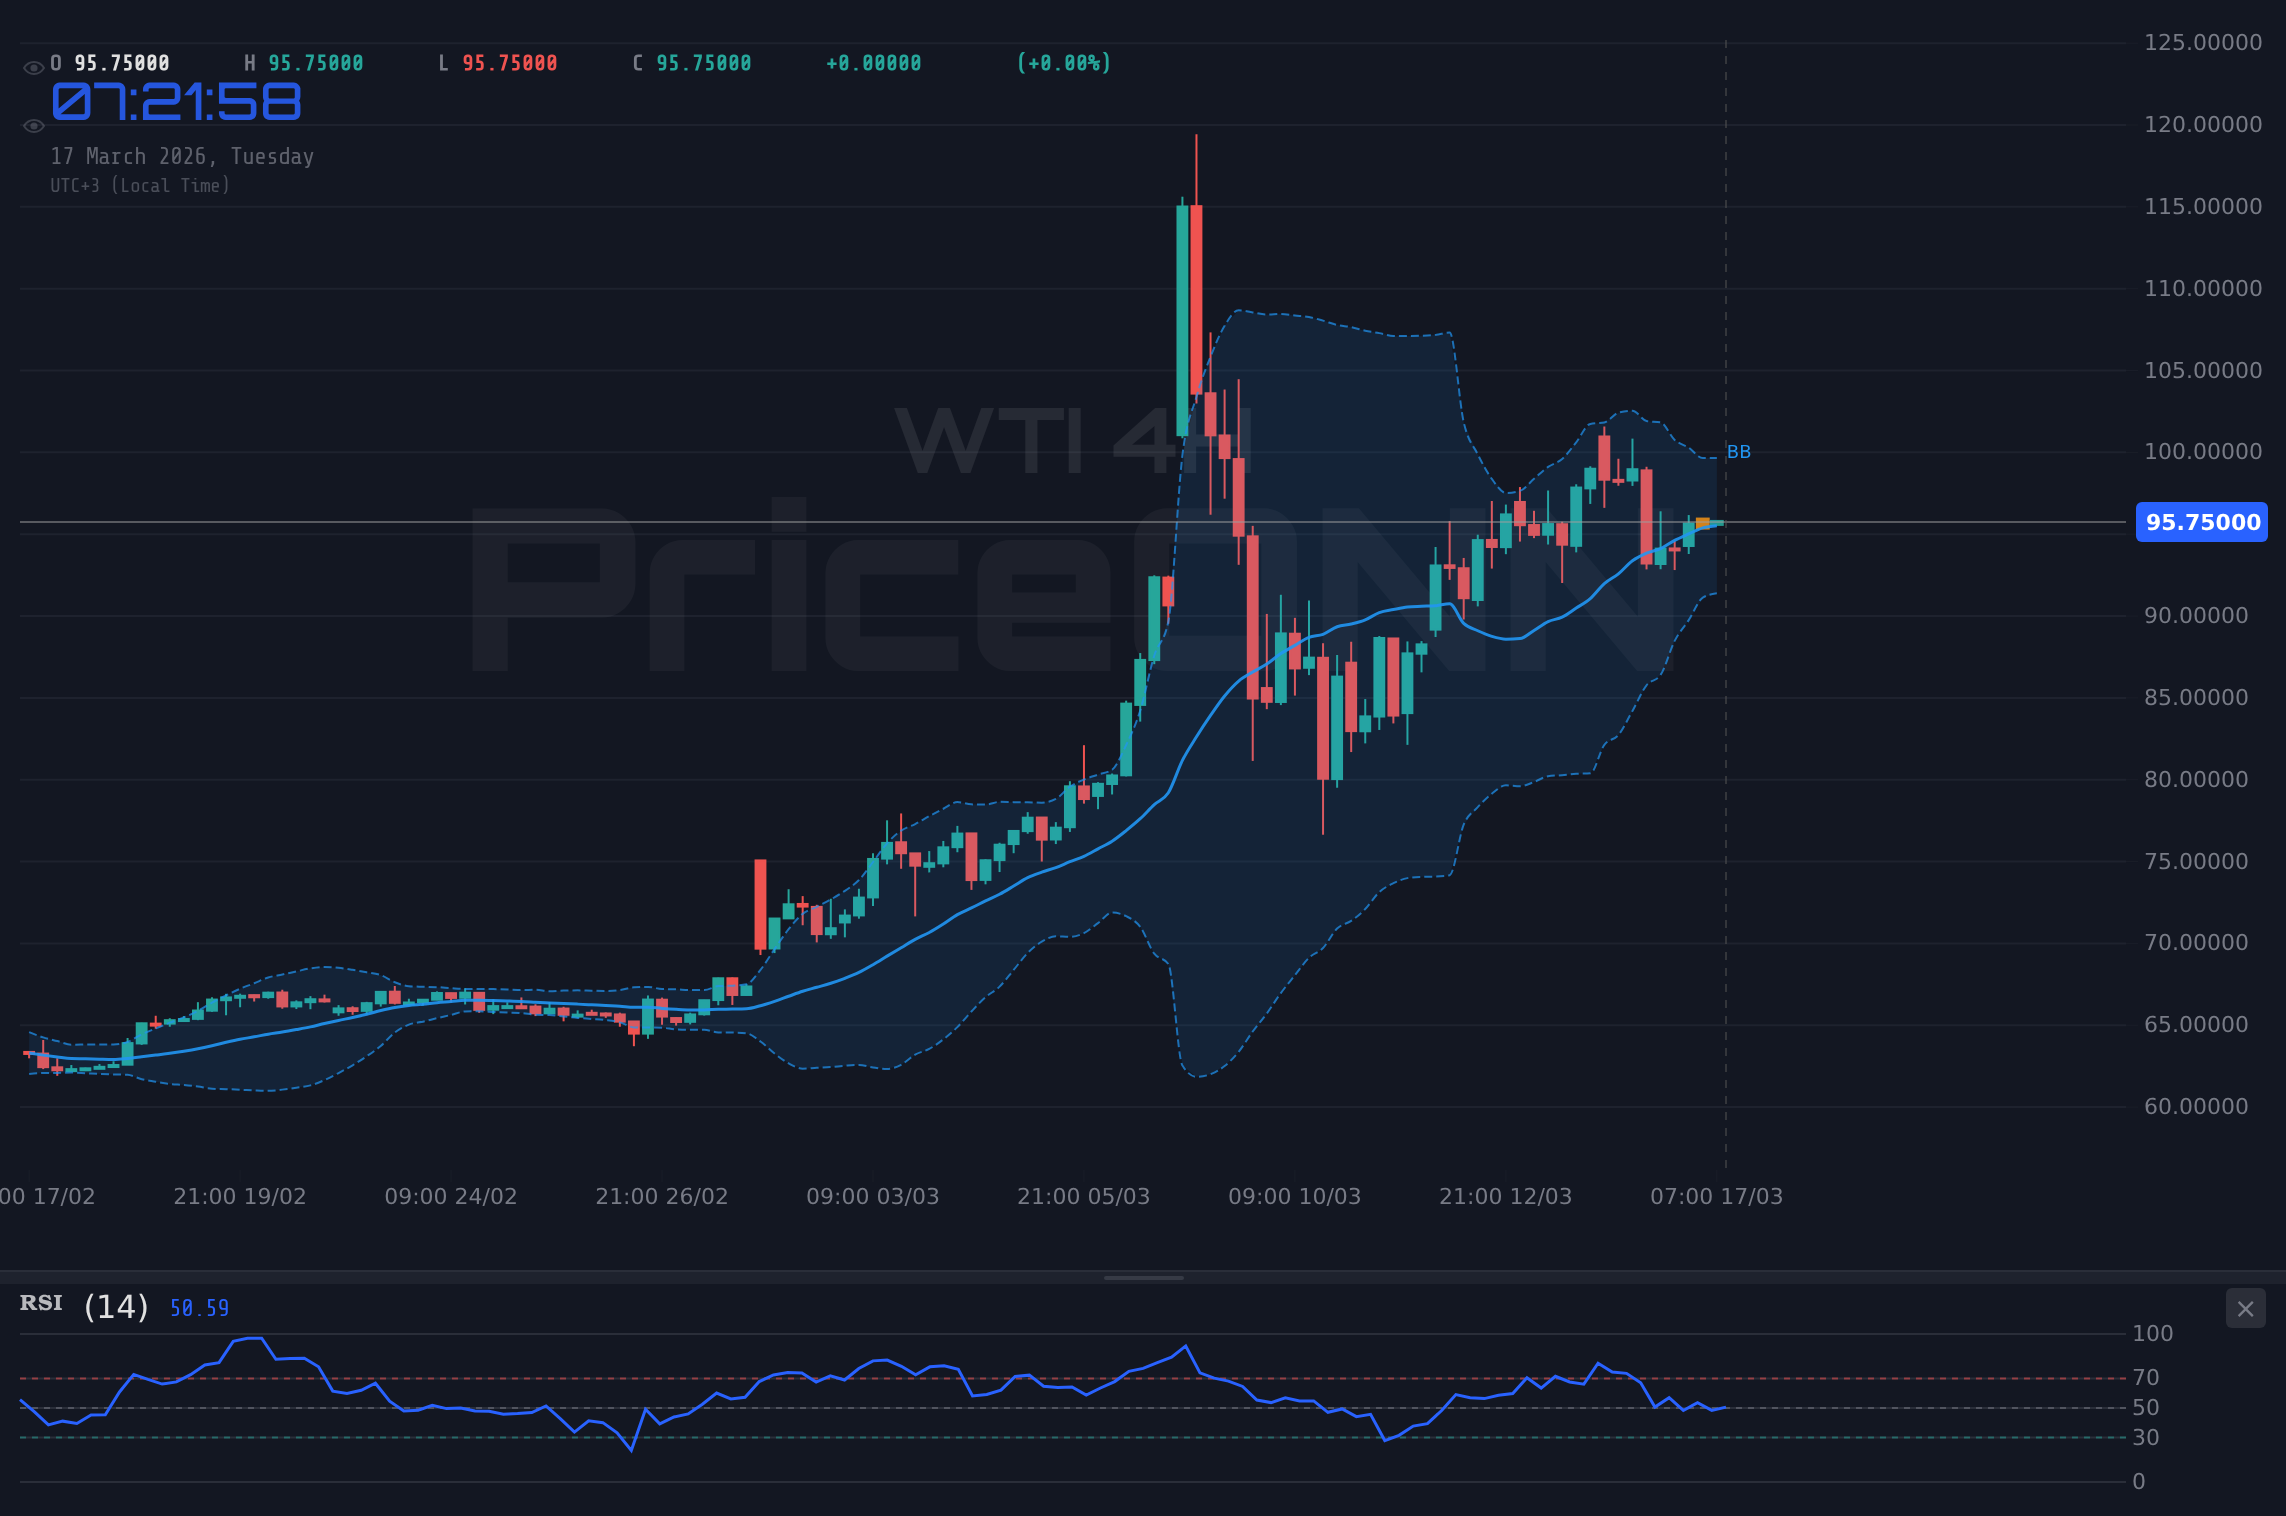
- WTI crude oil is trading at $95.92, with the 1H chart showing a 'BUY' signal (6/2/0) while 4H and 1D charts lean 'SELL' (5/3/0 and 7/1/0 respectively).
- The critical support level to watch is $95.47 on the 1H chart, with further downside targets at $95.15 and $94.89.
- Resistance is building around $96.05 on the 1H chart, followed by $96.31 and $96.63. A decisive break above these levels is needed for sustained bullish momentum.
- Geopolitical tensions in the Middle East are a primary driver, potentially pushing prices higher, while moderating inflation expectations and a strengthening USD could cap gains.
The Bulls' Charge: Eyeing the $100 Mark
A Geopolitical Spark Igniting Demand
The narrative for the bulls is heavily anchored in the escalating geopolitical tensions gripping the Middle East. News reports from March 17th highlight the intensification of conflicts, leading to disruptions in key shipping lanes. This isn't just a minor inconvenience; it directly impacts the global oil supply chain, creating fears of potential shortages. When supply is threatened, prices typically react upwards, and this is precisely the scenario the bulls are betting on. The spike in Brent crude to $103.25 and WTI's own surge to $96.17 within its daily range (93.79 - 96.17) are tangible evidence of this bullish sentiment taking hold. The ADX indicator on the 1D chart for WTI at 53.97 signals a very strong uptrend, suggesting that underlying momentum is robust, even if shorter timeframes show some consolidation.
Furthermore, the 1H chart for WTI presents a compelling picture for short-term traders looking for an entry. With a 'BUY' signal (6/2/0) and indicators like RSI at 51.03 (moving upwards from lower levels) and Stochastic showing %K at 86.89 and %D at 63.4, the immediate momentum appears to favor buyers. The MACD is also showing positive momentum on this timeframe. This short-term strength, fueled by supply disruption fears, could be the catalyst needed to propel WTI towards the psychologically significant $100 resistance level. The daily chart's ADX of 53.97 is a strong indicator that if the bulls can maintain control, the trend could become very powerful, pushing prices higher.
Inflationary Undercurrents and Central Bank Watch
While geopolitical events are a primary catalyst, the persistent concern over inflation also plays into the hands of the bulls. Higher energy prices directly translate to higher inflation, a scenario that central banks are acutely aware of. Although recent Canadian inflation data showed a dip to 1.8%, suggesting some easing in price pressures in certain regions, the global picture remains elevated. The market's reaction to this data, with the Canadian Dollar showing some weakness, highlights the sensitivity to inflation figures. For WTI, sustained high energy prices can create a feedback loop, contributing to broader inflationary pressures. This keeps the possibility of central banks needing to maintain a hawkish stance, or even hike rates further, on the table – a factor that typically supports commodity prices as a hedge against currency debasement.
The 1D ADX for WTI at 53.97 is a strong signal of an established uptrend, and if geopolitical events continue to disrupt supply, this uptrend could accelerate. The RSI at 73.93 on the daily chart is entering overbought territory, which typically signals caution. However, in strong uptrends, RSI can remain elevated for extended periods. This is where the bull argument lies: the strong trend indicated by the ADX might override the overbought RSI signal, especially if supply disruptions worsen. The bulls are hoping that the fear of missing out (FOMO) on a potential surge towards $100 will outweigh the technical overbought warnings, driving further buying pressure.
The Bears' Defense: Key Levels and Moderating Factors
The Dollar's Strength and Rate Hike Fears
On the flip side, the bears are building their case on several fronts, primarily centered around the US Dollar's potential strength and the implications of sustained high interest rates. The DXY (Dollar Index) is currently showing a mixed picture across timeframes: bullish on 1H (8/0/0) and 4H (6/2/0), but with a very strong daily uptrend (8/0/0) at 99.69. A strengthening dollar typically puts downward pressure on dollar-denominated commodities like WTI, as they become more expensive for holders of other currencies. If the Federal Reserve continues to signal a hawkish stance, or if inflation proves stickier than anticipated in the US, further dollar strength could emerge, acting as a significant headwind for oil prices.
The 1D Stochastic for WTI shows %K at 50.13 and %D at 49.6, indicating a potential shift or consolidation, and the Stochastic on the 4H chart (26.15/45.83) is also showing a bearish signal (%K < %D), suggesting that upward momentum might be stalling. While the 1D ADX is very strong at 53.97, the shorter timeframes show some conflicting signals. The 1H Stochastic flashing overbought (86.89/63.4) and the 4H Stochastic turning bearish could indicate that the recent rally is losing steam. Bears are watching these shorter-term signals closely, hoping for a reversal that could send prices back down towards critical support levels.
Easing Supply Chain Fears and Shifting Macro Narratives
While geopolitical tensions are a significant factor, the bears point to recent news suggesting a potential easing of certain supply chain pressures and a shift in the broader macroeconomic narrative. A news report from March 17th mentioned that crude oil prices experienced a significant downturn, with WTI falling 5.45% to $93.33 per barrel, as early signs of easing in the Strait of Hormuz emerged. Although the current price is $95.92, this earlier dip serves as a reminder that supply fears can dissipate quickly, leading to sharp reversals. The market's reaction to Canadian inflation cooling could also be a precursor to similar trends elsewhere, potentially reducing the urgency for aggressive monetary tightening and, by extension, dampening commodity demand expectations.
The technical indicators on the 4H and 1D charts for WTI present a more cautious outlook than the 1H chart. The 4H chart has a 'SELL' signal (2/6/0) with RSI at 54.95 and MACD showing negative momentum. The 1D chart also shows a 'SELL' signal (1/7/0) with RSI at 73.93, which is firmly in overbought territory and signaling a potential pullback is due. The ADX on the 1D chart at 53.97 indicates a strong trend, but such strong trends are often followed by corrections. Bears are looking for a close below the $95.47 support level on the 1H chart as a confirmation of a short-term reversal, potentially targeting the $95.15 and $94.89 levels. The fact that the daily chart shows a very strong uptrend (ADX 53.97) means that any pullback needs to be watched carefully, as it could simply be a healthy correction within a larger bullish move.
The Technical Tiebreaker: Conflicting Signals and Key Levels
Navigating the Indicator Maze
The technical landscape for WTI is currently a mixed bag, reflecting the indecision in the market. On the 1H timeframe, the picture is predominantly bullish: RSI at 51.03 is neutral but trending up, MACD shows positive momentum, and Stochastic is flashing a strong buy signal with %K (86.89) well above %D (63.4). The ADX at 19.45 suggests a weak trend, but the overall signal leans 'AL' (8/0/0). This suggests that in the very short term, there might be room for prices to drift higher, perhaps testing the immediate resistance around $96.05.
However, as we move to longer timeframes, the bullish narrative begins to fray. The 4H chart shows a 'SELL' signal (2/6/0). While RSI is neutral at 54.95 and Stochastic is showing a bearish crossover (%K: 26.15, %D: 45.83), the ADX at 22.34 indicates a moderate trend. The MACD here is showing negative momentum. This conflict suggests that the intraday bullishness might be a counter-trend move within a broader 4-hour bearish correction. The daily timeframe amplifies this caution. The 'SELL' signal (1/7/0) is strong, with RSI at 73.93 firmly in overbought territory, Stochastic showing a bullish crossover (%K: 50.13, %D: 49.6) but on the cusp of reversal, and MACD still showing negative momentum. The ADX at 53.97 is extremely high, confirming a very strong trend, but this strength on the daily chart could also mean it's ripe for a significant pullback if key support levels fail.
The Crucial Levels: $95.47 and $96.05
The immediate battleground appears to be between the 1H resistance at $96.05 and the 1H support at $95.47. A break above $96.05, especially with conviction and increasing volume, could propel WTI towards the next resistance levels at $96.31 and $96.63. This would validate the short-term bullish sentiment and potentially set the stage for a run at the $100 psychological level, albeit with significant hurdles like the daily overbought RSI. The bulls need to see sustained buying pressure that can overcome the bearish signals on the longer timeframes.
Conversely, a failure to hold $95.47 could trigger a cascade of selling. Bears would then target the subsequent support levels at $95.15 and $94.89. A decisive break below these levels, especially on the 4H or 1D chart, would confirm the bearish bias suggested by the longer timeframes and could lead to a much deeper correction. The extremely strong daily ADX of 53.97 suggests that if a downtrend does materialize, it could be swift and powerful. Traders are watching these intraday levels with bated breath, understanding that a decisive move in either direction could confirm the prevailing market sentiment.
Verdict: Cautious Optimism, But Patience is Key
The current market data for WTI presents a complex picture, characterized by conflicting signals across different timeframes. Geopolitical tensions are providing a strong bullish undercurrent, pushing prices higher and creating fears of supply disruptions. This is reflected in the strong uptrend signals on the daily chart (ADX 53.97) and the immediate bullish bias on the 1H chart. However, the moderating inflation data in some regions, the potential for dollar strength driven by hawkish central bank rhetoric, and the overbought conditions on longer timeframes present significant headwinds.
The bears have valid points, particularly regarding the potential for a correction after such a strong daily uptrend and the influence of a strengthening dollar. The bearish signals on the 4H and 1D charts cannot be ignored. While the 1H chart might offer short-term trading opportunities for the bulls, the overall trend's sustainability hinges on breaking through key resistance levels like $96.05 and holding firm above immediate support at $95.47. A failure here could expose WTI to a more significant pullback.
Ultimately, the market appears to be in a state of flux. The bullish narrative is driven by immediate supply-side fears, while the bearish case is built on broader macroeconomic factors and the potential for trend exhaustion. For now, the most prudent approach is one of cautious observation. Patience will be rewarded for those who wait for clearer signals. A decisive break above $96.05, confirmed by longer timeframes, would lend credence to the bullish case, potentially targeting $100. However, a failure to hold $95.47 could signal a deeper correction. Risk management remains paramount as WTI navigates this critical juncture.
Frequently Asked Questions: WTI Analysis
What happens if WTI breaks above the $96.05 resistance level?
A decisive break above $96.05, confirmed by strong volume and longer timeframe indicators, could signal further upside potential for WTI. Bulls would likely target subsequent resistance levels at $96.31 and $96.63, with eyes potentially set on the $100 psychological mark. This scenario would validate the short-term bullish momentum despite longer-term bearish signals.
Should I buy WTI at current levels of $95.92 given the conflicting signals?
Given the mixed signals across timeframes, a cautious approach is advised. While the 1H chart shows bullish momentum, the 4H and 1D charts lean bearish, with RSI on the daily chart at 73.93 indicating overbought conditions. It would be prudent to wait for a clearer signal, such as a confirmed break above $96.05 or a clear rejection and break below $95.47, before committing capital.
Is the RSI at 73.93 on the daily chart a sell signal for WTI?
An RSI of 73.93 on the daily chart is indeed in overbought territory and typically suggests a potential pullback is due. However, in strong uptrends, RSI can remain elevated for extended periods, as indicated by the very strong daily ADX of 53.97. While it signals caution, it's not an automatic sell signal in isolation; confirmation from other indicators and price action is crucial.
How will escalating Middle East tensions affect WTI prices this week?
Escalating geopolitical tensions in the Middle East are a significant bullish catalyst for WTI, as they threaten oil supply disruptions. If these tensions intensify further, we could see prices push towards and potentially break the $100 resistance level. However, the market's reaction will also depend on the actual impact on oil flows and the broader macroeconomic environment, including dollar strength and inflation concerns.
Track markets in real-time
AI-powered analysis, technical indicators and real-time price data.
Join Our Telegram Channel
Breaking market news, AI analysis and trading signals instantly.
Join Channel