WTI Surges to $95.63: Bulls Eye $99.47 Resistance Amid Inflation Fears
WTI crude oil trades at $95.63, nearing $99.47 resistance. Inflationary pressures and geopolitical risks fuel the bullish sentiment. Key levels to watch.
The energy markets are buzzing today as West Texas Intermediate (WTI) crude oil finds itself at a critical juncture, trading precisely at $95.63. This pivotal moment isn't just a number; it represents a significant psychological level and a potential springboard for further bullish action, with eyes firmly set on the $99.47 resistance mark. The recent surge, defying broader market jitters, is underpinned by a complex interplay of macroeconomic factors, geopolitical tensions, and shifting supply-demand dynamics. For traders and analysts alike, understanding the forces driving WTI's ascent is paramount to navigating the volatile landscape ahead. This isn't just about oil prices; it's a barometer for global inflation expectations and a key indicator of geopolitical stability, making its current trajectory a subject of intense scrutiny.
- WTI crude oil is trading at $95.63, with bulls targeting the $99.47 resistance level.
- The ADX at 16.13 on the 1H chart suggests a weak trend, while the 1D chart shows a very strong uptrend (ADX: 53.97).
- RSI(14) on the daily chart stands at 73.73, indicating overbought conditions and potential for a pullback.
- Geopolitical risks and inflationary pressures are key drivers supporting higher oil prices.
Navigating the Bullish Momentum: What the Charts Reveal
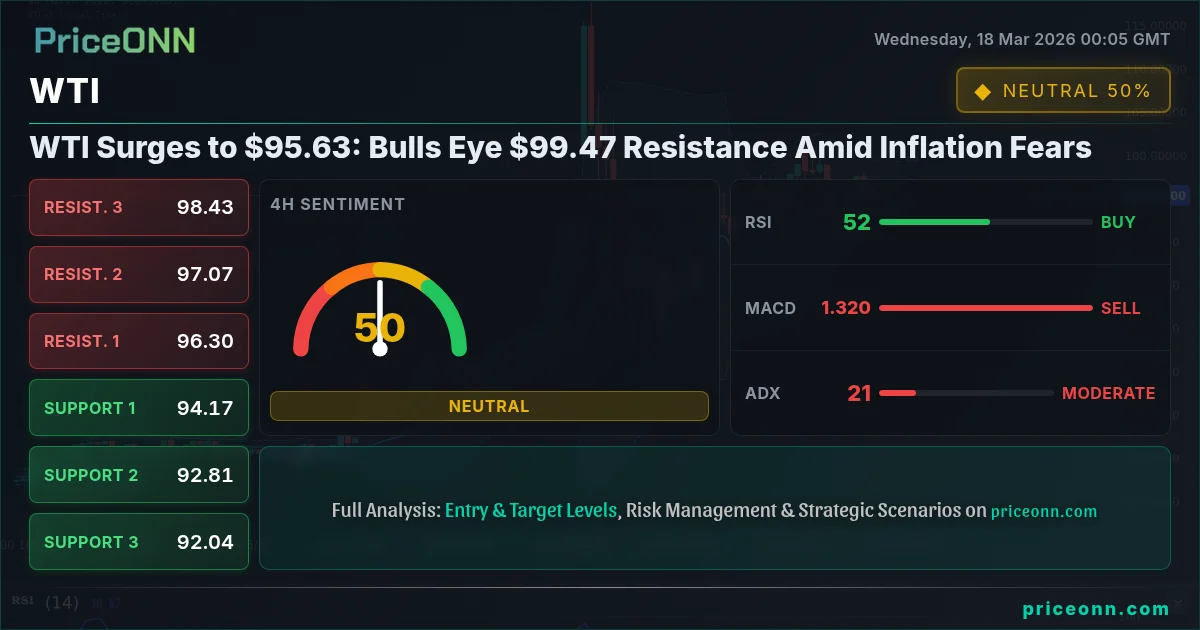
Diving into the technicals, the WTI chart presents a fascinating dichotomy across different timeframes. On the 1-hour chart, the trend strength is currently rated at a neutral 50% with an ADX reading of 16.13. This suggests that while there's upward momentum, the trend hasn't fully committed, potentially indicating consolidation or a period of indecision before the next significant move. The RSI(14) at 49.78 hovers near the midpoint, showing a slight bearish inclination, while the MACD indicates positive momentum with its histogram above the signal line. However, the Bollinger Bands are currently below the middle band, hinting at a bearish bias on this very short-term view. Stochastic oscillators show a bullish signal (%K > %D), but the overall signal leans neutral (4 Buy, 4 Sell, 0 Neutral), reflecting the conflicting signals across indicators.
This short-term indecision, however, contrasts sharply with the longer-term picture. The 4-hour timeframe reveals a trend strength of 50% but with a more defined bullish leaning. The RSI(14) at 53.51 is comfortably in the neutral zone, suggesting room for further upside. The MACD shows negative momentum on this timeframe, which is a point of caution, yet the Stochastic oscillators are flashing a bullish signal (%K > %D) with K at 34.24 and D at 33.94. The ADX at 21.05 indicates a moderate uptrend, signaling that the underlying strength is building. The overall signal here leans cautiously optimistic, favouring buys (6 Buy, 2 Sell, 0 Neutral), acknowledging the positive stochastic cross but keeping an eye on the MACD.
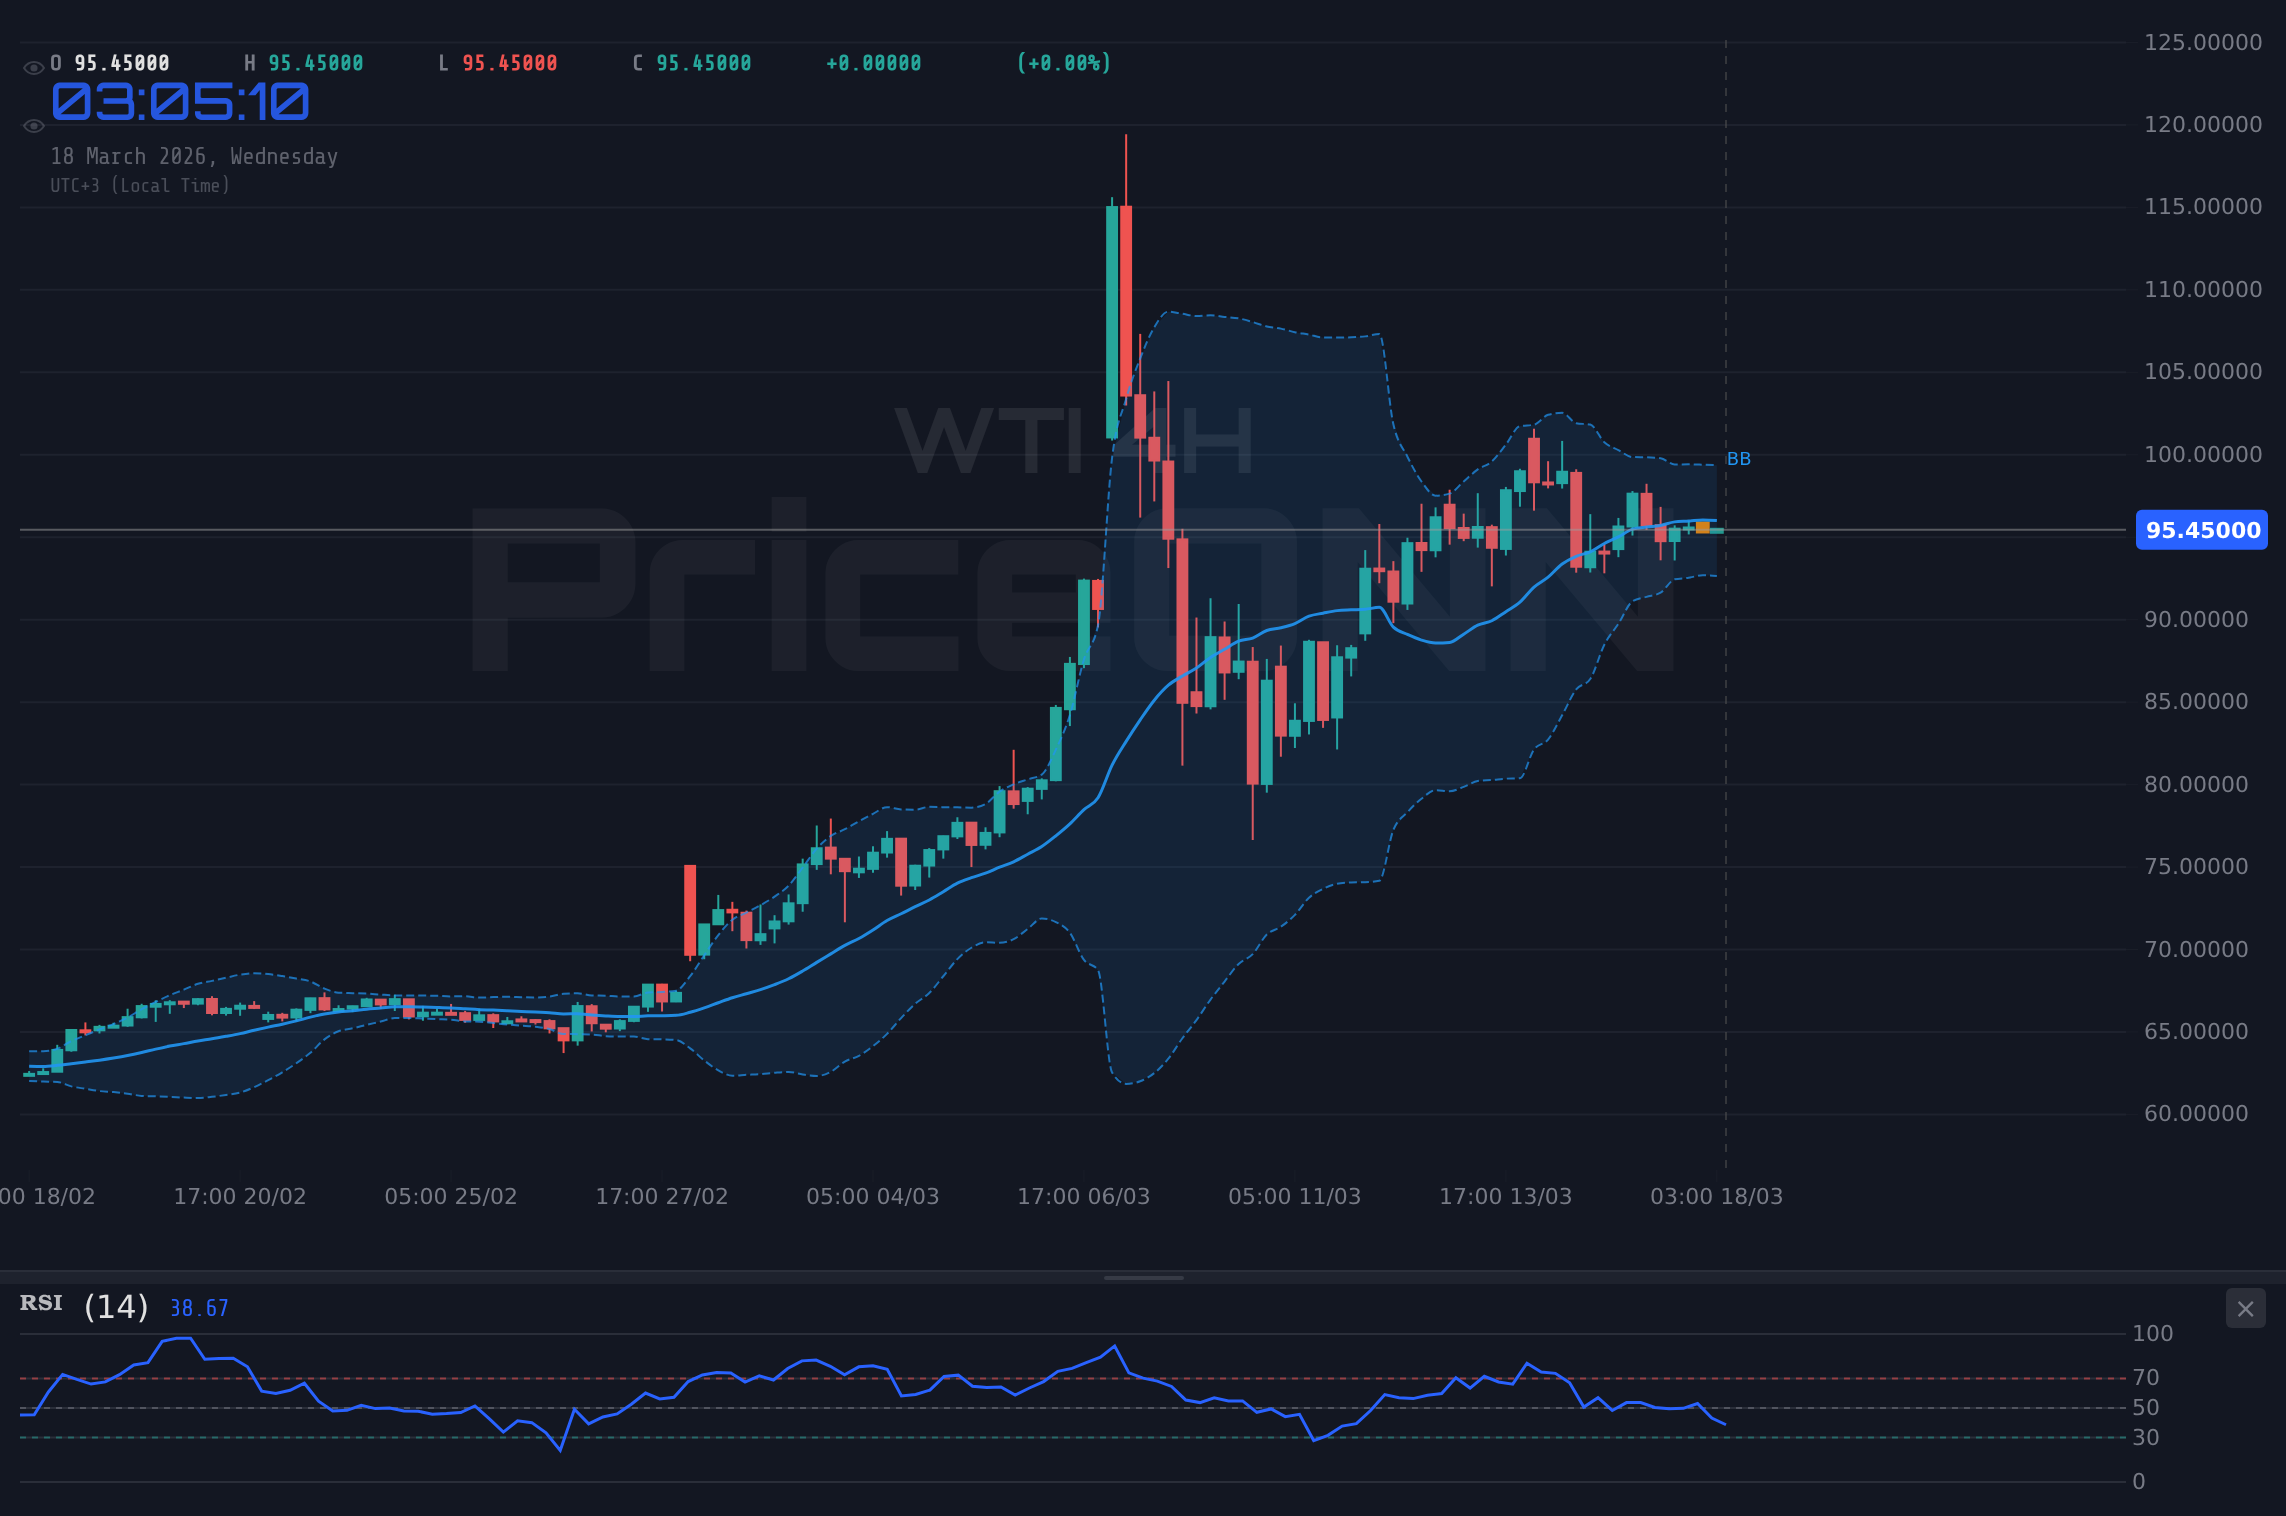
The daily chart, however, paints the most compelling picture for the bulls. Here, WTI shows a strong uptrend (Power: 100%) with an ADX of 53.97, signifying a very robust and established trend. The RSI(14) is at 73.73, firmly in overbought territory. While this often signals a potential for correction, in a strong uptrend, it can also indicate powerful underlying buying pressure that may persist. The MACD is positive, with its histogram above the signal line, reinforcing the bullish momentum. Stochastic oscillators are showing a bullish signal (%K > %D), with K at 49.91 and D at 49.56, suggesting that even after a strong run, there might be room for further upward movement before exhaustion sets in. The overwhelming 'Buy' signal (6 Buy, 1 Sell, 0 Neutral) on this daily timeframe strongly supports the narrative of bulls eyeing higher prices.
The current price of $95.63 is crucial. It sits above the 1-hour support level of $94.74 and aligns with the broader bullish sentiment seen on the daily chart. The key resistance level to watch is $105.05 on the daily chart, and more immediately, the $96.10 to $97.46 range on the 1-hour chart. A sustained break above $97.46 could indeed pave the way for a push towards the psychological $100 mark and beyond, potentially targeting the $103.39 support level on the 1-hour chart acting as a floor for upward continuation, or the $104.16 resistance. The divergence in signals across timeframes highlights the importance of a multi-timeframe approach; short-term caution might be warranted, but the daily trend is undeniably bullish.
The Fundamental Undercurrents: Inflation, Geopolitics, and the Dollar's Dance
The technical strength of WTI is not occurring in a vacuum. Several fundamental factors are converging to support this bullish narrative. Firstly, persistent inflationary pressures globally remain a dominant theme. As economies grapple with supply chain disruptions and robust consumer demand, the price of energy, a key component of inflation, naturally trends higher. The recent surge in oil prices, with Brent crude also showing significant upward movement, suggests that this inflationary impulse is far from over. Germany's move to cap daily fuel price hikes, as reported by energy news outlets, underscores the volatility and the political sensitivity surrounding energy costs, indirectly supporting higher benchmark prices.
Secondly, geopolitical risks continue to cast a long shadow over energy markets. While specific details about ongoing conflicts or tensions weren't provided in the immediate data, the general market context highlights their importance. Any escalation in the Middle East, or disruptions to major oil-producing regions, can trigger immediate supply fears, sending prices sharply higher. This underlying geopolitical premium is a constant factor that traders must price in. The fact that WTI is rising despite a slight pullback in the Dollar Index (DXY) to 99.31 suggests that the bullish energy narrative is strong enough to potentially override dollar strength, which typically acts as a headwind for oil prices.
The correlation with the DXY is particularly noteworthy. Typically, a stronger dollar makes oil more expensive for holders of other currencies, potentially dampening demand. However, WTI's current ascent, even with the DXY consolidating near 99.31, indicates that the demand-side fundamentals, coupled with supply concerns, are currently outweighing the currency effect. If the DXY were to break significantly higher, perhaps on hawkish Fed signals, it could pose a challenge to WTI's upward trajectory. Conversely, if the dollar weakens further, it could add another layer of support to oil prices, potentially accelerating the move towards the $99.47 target and beyond.
Looking at broader market sentiment, while US stock futures saw a notable downturn early Tuesday, as reported, with the Dow Jones Industrial Average down 0.27%, WTI's resilience is telling. This suggests a potential decoupling or a shift in market focus towards commodities as an inflation hedge. The fact that WTI is rallying while other risk assets might be experiencing pressure points towards a specific demand for energy commodities, possibly driven by strategic stockpiling, industrial demand, or simply the expectation of continued price appreciation. The strong uptrend on the daily chart, supported by ADX 53.97, reinforces this view of underlying strength.
Key Levels and The Road Ahead for WTI
The immediate price action for WTI revolves around the $95.63 mark. For the bulls to maintain control and push towards the $99.47 target, several key levels must be respected. On the 1-hour chart, holding above the support at $94.74 is crucial. A break below this level could signal a short-term reversal, potentially testing the next support at $94.00. Conversely, breaking through the immediate resistance cluster between $96.10 and $97.46 would be the next significant hurdle. A decisive close above $97.46 on the 1-hour chart would likely ignite further buying interest, possibly triggering stop-losses for short-sellers and propelling prices towards the higher resistance levels.
The daily chart provides a broader perspective. The current price of $95.63 is well above the daily support at $90.70. The primary resistance lies at $105.05, a level that could become the next major target if the current bullish momentum sustains. However, the RSI(14) at 73.73 on the daily chart cannot be ignored. While not an immediate sell signal in a strong uptrend, it does suggest that the market is becoming overheated. Traders should be alert for potential profit-taking or consolidation phases as prices approach higher resistance levels, especially if accompanied by divergences in other indicators or a shift in macroeconomic sentiment. The ADX of 53.97 on the daily chart confirms a very strong trend, meaning that pullbacks might be shallow and short-lived within the broader upward trajectory.
Considering the economic calendar, upcoming data releases related to inflation (like CPI or PCE) and employment (NFP) will be critical. Stronger-than-expected inflation figures could further bolster oil prices, reinforcing the bullish case for WTI and potentially pushing it towards the $105.05 resistance. Conversely, signs of cooling inflation or a significant economic slowdown could dampen demand expectations and lead to a correction. Central bank policy decisions, particularly from the Federal Reserve, will also play a vital role. If the Fed signals a more dovish stance or pauses rate hikes, it could weaken the dollar and provide additional tailwinds for WTI. The market will be keenly watching Fed Fund Futures and OIS pricing for any shifts in rate expectations.
The current market sentiment, as indicated by the resilience of WTI despite potential weakness in other risk assets, suggests a strong underlying demand for energy. This could be driven by strategic considerations, anticipated supply constraints, or simply the momentum effect of a strong trend. While short-term pullbacks are possible, especially given the daily RSI's overbought condition, the overall technical and fundamental picture on the daily chart supports a bullish outlook. The key for traders will be to manage risk effectively, perhaps by looking for entries on pullbacks towards established support levels, rather than chasing the price higher in overbought conditions. The $95.63 price point is a crucial pivot; holding this level could set the stage for a significant rally towards $99.47 and the ultimate daily resistance target.
Frequently Asked Questions: WTI Analysis
What happens if WTI breaks above the $97.46 resistance level?
A decisive close above $97.46 on the 1-hour chart would likely trigger further buying pressure, potentially leading to a rapid ascent towards the $99.47 target. This breakout could ignite short-sellers' stop-losses, adding fuel to the upward move. Traders should watch for confirmation on increased volume and sustained price action above this critical resistance.
Should I buy WTI at current levels of $95.63 given the daily RSI is at 73.73?
While the daily RSI of 73.73 signals overbought conditions, the very strong uptrend (ADX 53.97) suggests momentum may persist. A more prudent approach might be to wait for a minor pullback towards the $94.74 support level for a better risk-reward entry, rather than chasing the price higher in potentially overheated territory. Patience is key here.
Is the ADX at 53.97 a sell signal for WTI on the daily chart?
No, an ADX of 53.97 on the daily chart is not a sell signal; rather, it confirms an extremely strong trend. This indicates that the current price move has significant directional conviction. While it suggests conditions are ripe for a potential reversal eventually, it primarily signals that the existing trend is powerful and likely to continue in the short to medium term.
How will upcoming inflation data affect WTI prices this week?
Stronger-than-expected inflation figures could significantly boost WTI prices, potentially pushing them towards the $105.05 resistance as markets anticipate continued demand for commodities as an inflation hedge. Conversely, softer inflation could dampen demand expectations, leading to a price correction, especially given the current overbought RSI reading.
The path forward for WTI hinges on the interplay between technical momentum and fundamental drivers. While the daily chart paints a strong bullish picture, the overbought RSI suggests that caution is warranted. Traders should monitor the $95.63 level closely, looking for confirmation of a sustained move above immediate resistances like $97.46. The confluence of potential geopolitical events and upcoming economic data will undoubtedly add volatility. However, the underlying trend strength indicated by the ADX on the daily chart provides a solid foundation for the bullish case, suggesting that any pullbacks might present opportunities for those looking to capitalize on the energy market's upward trajectory. Patience and disciplined risk management will be the cornerstones for navigating this dynamic environment.
| Indicator | Value | Signal | Interpretation |
|---|---|---|---|
| RSI (14) | 73.73 | Neutral | Overbought on Daily, potentially strong momentum |
| MACD Histogram | +0.88 | Bullish | Positive momentum on Daily |
| Stochastic | K:49.91, D:49.56 | Bullish | Bullish crossover on Daily |
| ADX | 53.97 | Bullish | Very Strong Uptrend on Daily |
| Bollinger | Middle Band | Bullish | Price above middle band on Daily |
Track markets in real-time
AI-powered analysis, technical indicators and real-time price data.
Join Our Telegram Channel
Breaking market news, AI analysis and trading signals instantly.
Join Channel