Gold Tests $5,025 Resistance Amid Geopolitical Volatility: Analysis
Gold is currently trading at $5,025.84, facing resistance as geopolitical tensions fuel market volatility. Analyzing key levels and indicators for XAUUSD's next move.
Gold, or XAUUSD, is currently perched at $5,025.84, a critical juncture where geopolitical anxieties meet technical resistance. The precious metal has seen significant price action, driven by a complex interplay of global tensions and shifting market sentiment. Today's analysis dives deep into the current technical landscape, fundamental underpinnings, and the crucial levels traders are watching as volatility remains elevated. With the 1-hour chart showing a neutral trend and the daily indicators leaning towards caution, understanding the precise drivers behind gold's movement is paramount for navigating this dynamic market.
- Gold is testing resistance near $5,025.84, with the 1-hour RSI at 52.2 indicating a neutral but slightly upward-leaning momentum.
- Critical support for XAUUSD sits at $5,002.53 on the 1-hour chart, while resistance is eyed at $5,019.98.
- The daily chart shows a bearish signal with RSI at 48.18 and ADX at 13.07, suggesting a weak trend despite short-term upward pressures.
- Geopolitical tensions and a rising DXY (currently 99.67) are key factors influencing gold's price action, creating a complex trading environment.
Navigating the $5,000 Mark: Gold's Current Stance
Gold's journey to $5,025.84 is a testament to its enduring role as a safe-haven asset. As global geopolitical tensions continue to simmer, the yellow metal often finds itself in the spotlight. However, the path forward is not a straight line upwards. While the price currently reflects a daily gain of 0.4%, or $19.78, the underlying technical signals present a more nuanced picture. The 1-hour timeframe, often favored by active traders, shows a general 'BUY' signal with a strength of 50%, driven by indicators like RSI (52.2) and MACD showing positive momentum. This suggests that intraday traders might be finding opportunities, but the longer-term trends are less convincing.
The conflict in the Middle East, as highlighted by recent news regarding the Strait of Hormuz closure and strategic reserve releases, undoubtedly adds a layer of uncertainty that typically benefits gold. This backdrop is further amplified by the strengthening US Dollar Index (DXY), which currently stands at 99.67. Historically, a rising DXY tends to put downward pressure on dollar-denominated commodities like gold. This creates a tug-of-war: geopolitical fears pushing gold up, while a stronger dollar pulls it down. Understanding this dynamic is crucial for any trader looking to position themselves effectively in the gold market.
Technical Cross-Currents: What the Indicators Are Saying
Diving deeper into the technicals, the divergence across different timeframes for XAUUSD is striking. On the 1-hour chart, the picture is mixed but leans slightly bullish with an overall signal of 'BUY' (5 Al, 3 Sat). The RSI (52.2) hovers in neutral territory, suggesting room for upward movement, and the MACD is above its signal line, indicating positive momentum. However, the Stochastic oscillator (%K=48.31, %D=73.8) is flashing a bearish signal, showing that %K is below %D, hinting at a potential pullback. The ADX at 23.41 suggests a moderately trending market, but not a strong one.
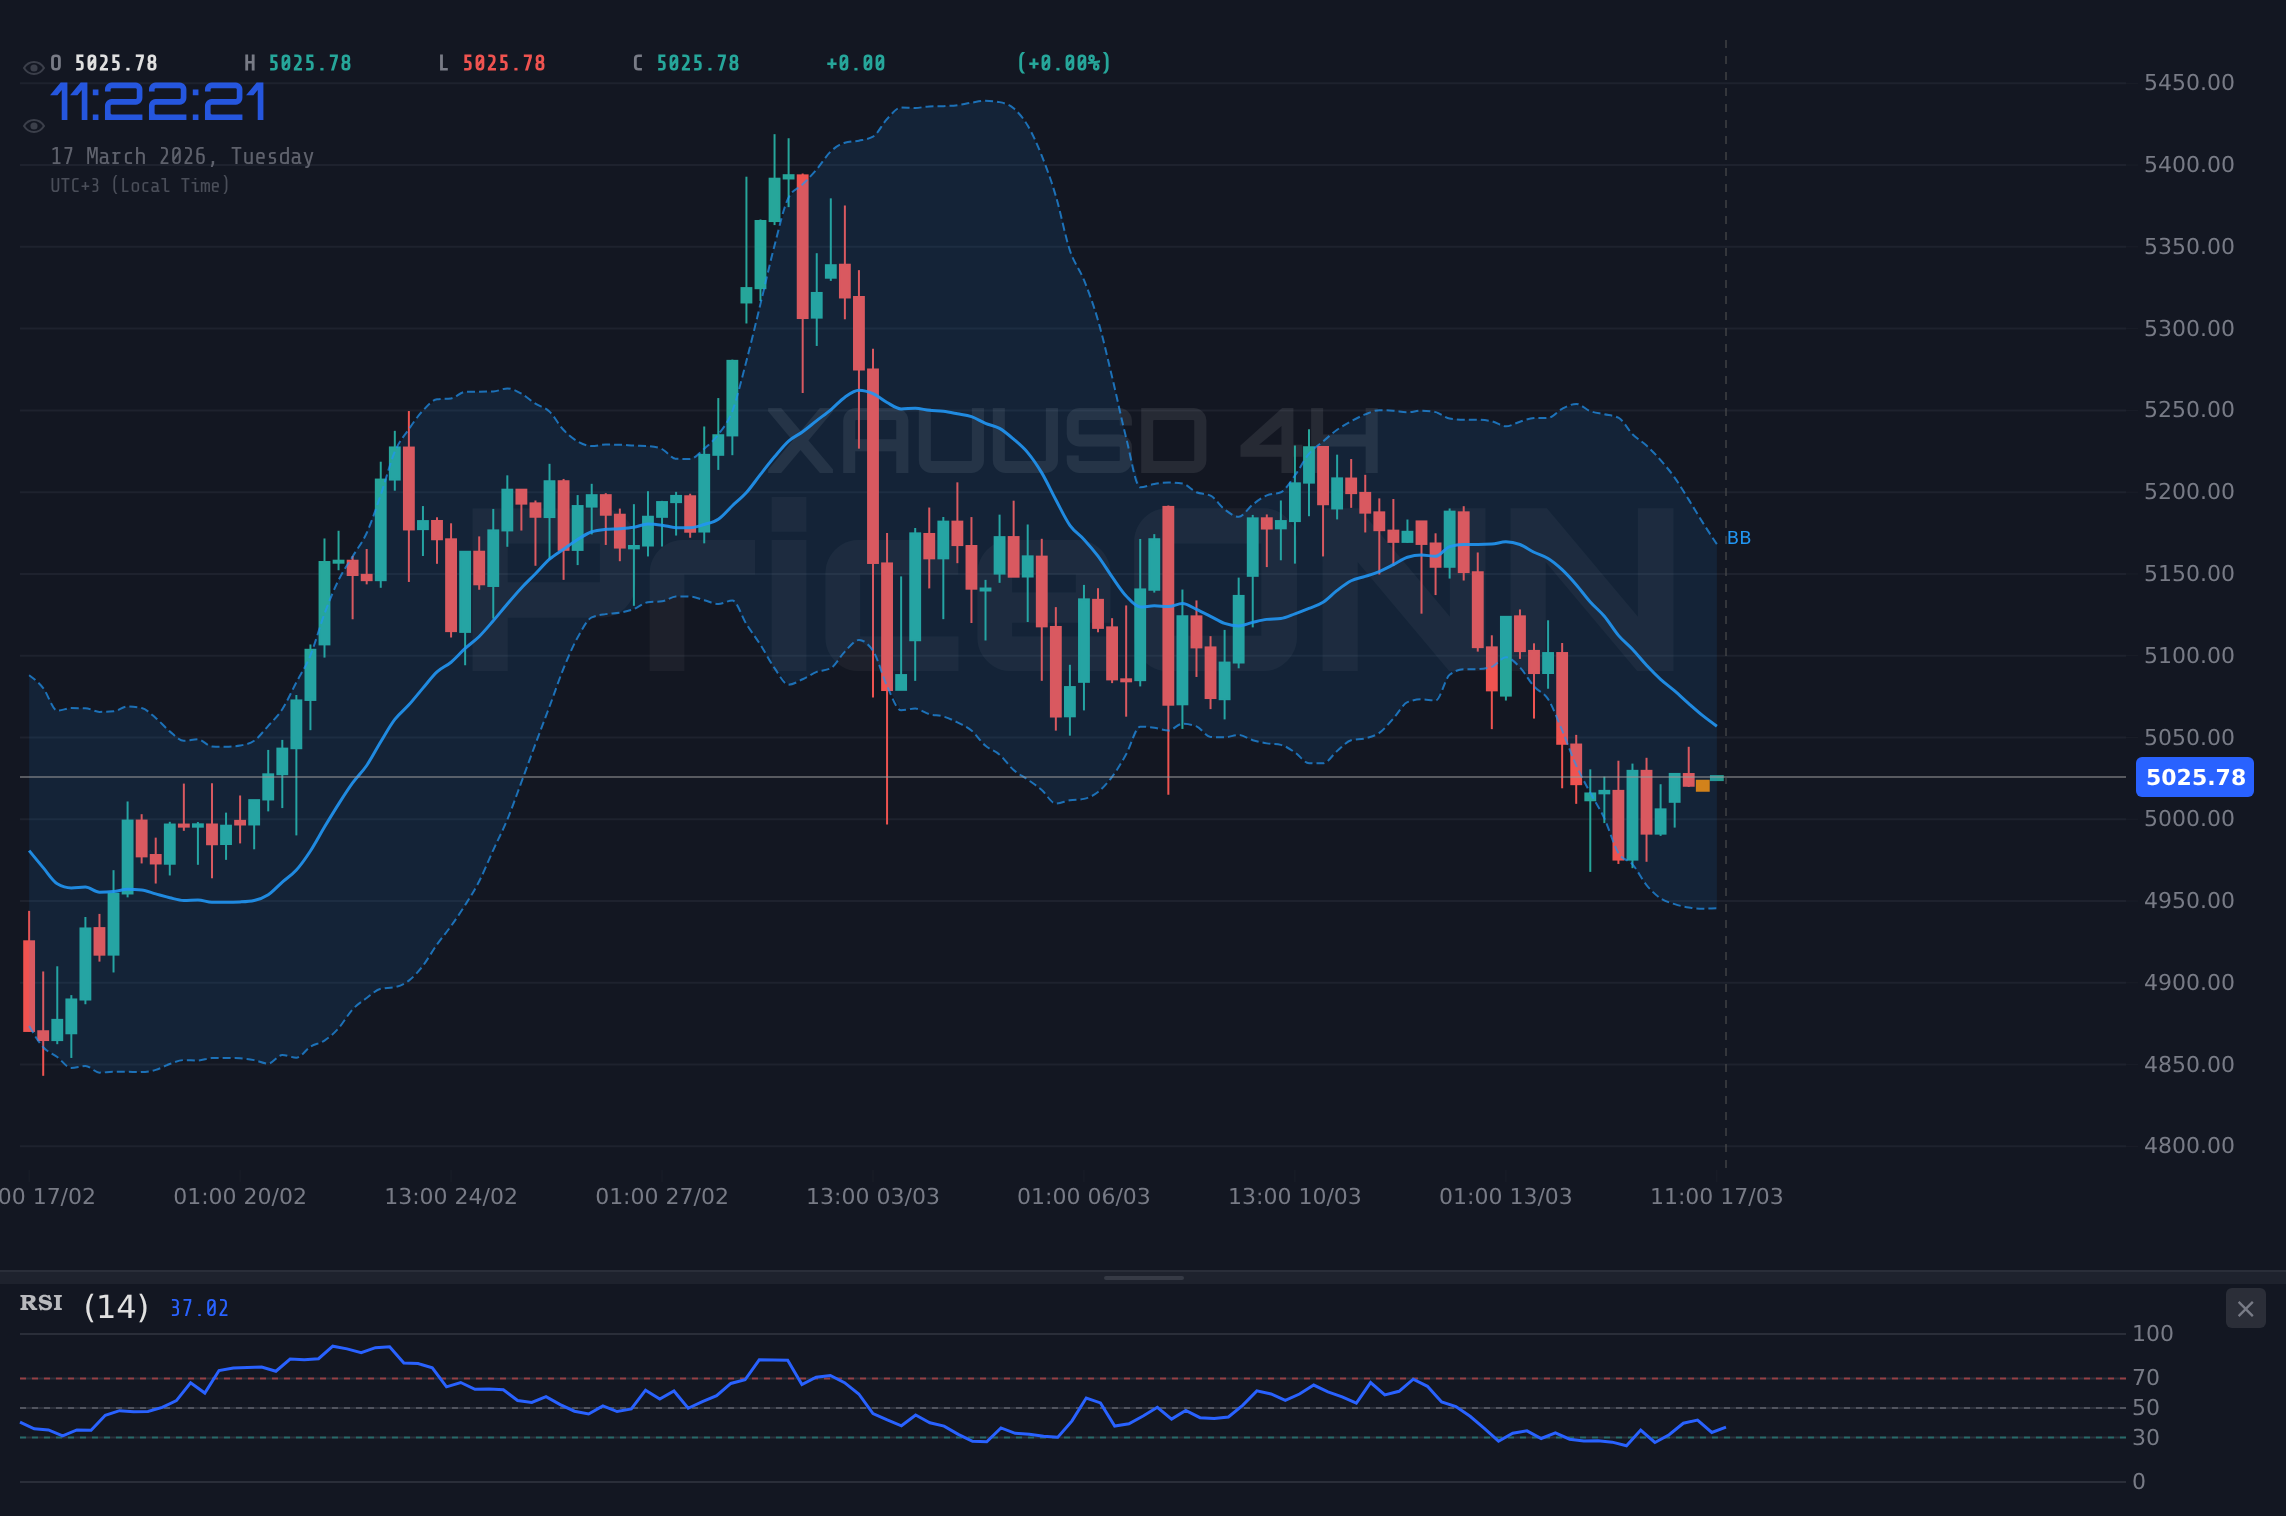
Shift your gaze to the 4-hour timeframe, and the narrative changes significantly. Here, the overall signal flips to 'SELL' (1 Al, 7 Sat). The RSI drops to 42.15, firmly in neutral territory but trending downwards, suggesting sellers are gaining a slight edge. The MACD is below its signal line, confirming negative momentum. Bollinger Bands are also below the middle band, indicating a bearish inclination. The Stochastic here (%K=45.64, %D=27.27) is showing a bullish signal (%K > %D), creating another layer of conflict. The ADX at 43.48 is particularly noteworthy, indicating a strong downtrend – a stark contrast to the weaker trend signals on the 1-hour chart. This divergence between short-term and mid-term indicators highlights the choppiness and potential for whipsaws.
The daily chart paints yet another picture, reinforcing the caution suggested by the 4-hour timeframe. The overall signal is 'SELL' (2 Al, 6 Sat). The RSI is at 48.18, inching closer to oversold territory but still neutral, with a downward trend. MACD remains negative, and Bollinger Bands are below the middle band. The Stochastic (%K=14, %D=27.84) strongly signals a sell. Perhaps most telling is the ADX value of 13.07, indicating a very weak trend. This suggests that while there might be short-term fluctuations, the larger market structure is consolidating or lacks strong directional conviction. This confluence of mixed signals across timeframes underscores the difficulty in establishing a clear directional bias for gold right now.
The Critical Levels: Where Gold Could Go Next
Understanding the key support and resistance levels is vital for navigating gold's current environment. On the 1-hour chart, immediate support is found at $5,002.53, followed by $4,995.07 and $4,985.08. These levels represent areas where buying interest might emerge if the price experiences a short-term dip. Resistance, on the other hand, is clustered around $5,019.98, then $5,029.97, and $5,037.43. A decisive break above $5,019.98 could signal further intraday upside, potentially targeting the higher resistance levels. However, failure to hold above $5,002.53 could open the door for a move lower.
Looking at the 4-hour timeframe, the support structure shifts to $5,005.82, $4,983.92, and $4,972.94. These are more significant levels, and a break below them would confirm the bearish leanings seen on this timeframe. Resistance on the 4-hour chart is noted at $5,038.70, $5,049.68, and $5,071.58. The $5,071.58 level, in particular, is a crucial resistance point. A sustained move above this level would challenge the prevailing bearish sentiment on the 4-hour and daily charts, suggesting a potential shift in trend.
On the daily chart, the support levels are more substantial: $4,970.06, $4,934.05, and $4,900.29. A fall below $4,970.06 would likely trigger further selling pressure, potentially retesting the $4,900 psychological level. The daily resistance is set at $5,039.83, $5,073.59, and $5,109.60. The $5,039.83 level aligns closely with the intraday resistance, making it a key battleground. If gold can decisively break and hold above $5,039.83, it would invalidate the bearish outlook on the daily chart and open up the possibility of a more significant rally towards $5,073.59 and beyond.
Fundamental Drivers: Geopolitics and Central Bank Watch
The current price action in gold is heavily influenced by a confluence of geopolitical events and central bank policies. The ongoing conflicts, particularly in the Middle East, continue to be a primary driver for safe-haven demand. News regarding the Strait of Hormuz closure, as reported, can send oil prices soaring and, by extension, increase inflation expectations – a scenario that typically benefits gold. This is further compounded by the broader risk sentiment, often reflected in major equity indices like the S&P 500 (currently at 6678.2, showing a slight daily decline) and Nasdaq 100 (at 24560.26, also down). When these indices dip, gold often sees increased interest as investors seek refuge.
The US Dollar Index (DXY) at 99.67 is another critical factor. Its upward movement suggests a strengthening dollar, which, as noted, usually acts as a headwind for gold. This relationship is dynamic and can be influenced by Federal Reserve policy expectations. While the market isn't pricing in an immediate rate cut, any hints from Fed officials about future policy direction can significantly impact the dollar and, consequently, gold. Investors are constantly scanning for economic data, such as upcoming inflation figures or employment reports, that might sway the Fed's stance. The current data shows a weak trend on the daily ADX (13.07), implying that the market is not yet convinced of a strong directional move, making it susceptible to geopolitical headlines.
The role of central banks as buyers of gold is also a significant fundamental driver. Reports from outlets like Bloomberg have indicated continued central bank accumulation of gold reserves. This consistent demand provides a solid floor for gold prices, even amidst periods of dollar strength or risk-on market sentiment. However, any slowdown in this buying momentum, even if temporary, could be interpreted negatively by the market. The interplay between geopolitical risk premiums, dollar strength influenced by Fed policy, and sustained central bank demand creates a complex fundamental backdrop that requires constant monitoring.
Correlation Analysis: DXY, Equities, and Oil's Influence
The correlation between gold, the US Dollar Index (DXY), equity markets, and oil prices provides crucial context for understanding XAUUSD's behavior. Currently, the DXY is showing strength, trading at 99.67 and exhibiting a strong upward trend on the daily chart (ADX 33.54). This typically exerts downward pressure on gold. However, the geopolitical situation is creating a counter-narrative. If major geopolitical escalations occur, gold's safe-haven appeal might override the dollar's strength, leading to a scenario where both DXY and XAUUSD rise simultaneously – a departure from their usual inverse correlation.
Equity markets, represented by the S&P 500 (6678.2) and Nasdaq 100 (24560.26), are showing slight daily declines. This risk-off sentiment, even if mild, generally supports gold. A significant drop in equities, coupled with rising geopolitical tensions, would likely amplify gold's gains. Conversely, a strong rally in stocks, perhaps driven by positive economic data or easing geopolitical fears, could lead to profit-taking in gold as investors shift back to riskier assets.
Oil prices, with Brent at $104.37 and WTI at $97.53, are surging, indicative of supply concerns and heightened geopolitical risk, potentially linked to events like the Strait of Hormuz closure. Higher oil prices can fuel inflation expectations, which historically supports gold as an inflation hedge. However, if this surge in oil prices leads to fears of aggressive central bank tightening to combat inflation, it could eventually weigh on gold by strengthening the dollar and increasing borrowing costs. The current ADX for Brent (59.72) and WTI (53.97) signifies very strong upward trends, underscoring the market's focus on energy supply risks.
Navigating the Uncertainty: What XAUUSD Traders Should Watch
The current market environment for XAUUSD is characterized by elevated volatility and conflicting signals. The short-term technicals suggest potential upside towards $5,019.98 and possibly $5,029.97, but the longer-term daily and 4-hour charts present a more bearish outlook, with key resistance at $5,038.70 and $5,071.58. The weak daily ADX (13.07) indicates a lack of sustained directional conviction, meaning price action could be choppy and prone to false breakouts or breakdowns.
Traders should pay close attention to geopolitical developments. Any significant escalation or de-escalation in global hotspots could trigger sharp moves in gold. Simultaneously, monitoring the DXY and its correlation with XAUUSD is crucial. If the dollar continues its upward trajectory, it may cap gold's gains unless geopolitical fears become overwhelmingly dominant. Economic data releases, particularly from the US regarding inflation and employment, will also be critical in shaping expectations for Federal Reserve policy, which in turn influences the dollar and gold.
The conflict between intraday bullish signals and longer-term bearish indicators means that risk management is paramount. A break and hold above the daily resistance at $5,039.83 would be a significant bullish development, suggesting a potential trend change. Conversely, a decisive close below the 1-hour support at $5,002.53 could signal a move towards the 4-hour support at $5,005.82, and potentially lower if that level fails. Patience and a disciplined approach, waiting for clear confirmation of a trend, will be key.
The Path Forward: Balancing Risk and Opportunity
The gold market is currently at a crossroads, balancing the persistent threat of geopolitical instability against the upward pressure from a strengthening dollar and mixed technical signals. While the immediate price action might offer short-term trading opportunities, the broader trend remains uncertain. The confluence of factors – from the Strait of Hormuz news impacting oil, to the DXY's climb driven by Fed policy anticipation, and the steady demand from central banks – creates a complex web of influences.
For those looking to trade XAUUSD, a cautious approach is warranted. The $5,025.84 level represents a significant resistance zone, and a failure to break through it could lead to a pullback towards the $5,002.53 support. However, a sustained move above $5,039.83 on the daily chart would signal a more robust bullish continuation. The weak daily ADX suggests that any breakout might lack conviction initially, making confirmation on higher timeframes essential. Traders must remain vigilant, manage their risk diligently, and wait for clear signals before committing to significant positions.
Ultimately, gold's performance in the coming days will likely hinge on the narrative surrounding geopolitical events and central bank communications. The market is pricing in a complex outlook, and any deviation from current expectations could trigger significant price swings. By staying informed about these key drivers and respecting the critical technical levels, traders can better position themselves to navigate the volatility and potentially capitalize on the opportunities that arise.
Frequently Asked Questions: XAUUSD Analysis
What happens if XAUUSD breaks above the $5,037.43 resistance level on the 1-hour chart?
A break above the $5,037.43 resistance on the 1-hour chart could signal further intraday upside, potentially targeting the next resistance at $5,049.68. However, confirmation on higher timeframes like the 4-hour chart would be needed to confirm a sustained bullish move, especially given the daily chart's weaker trend signals.
Should I consider buying XAUUSD at current levels around $5,025.84, given the mixed RSI and Stochastic signals?
Buying at current levels around $5,025.84 is risky due to conflicting signals: the 1-hour RSI is neutral (52.2) but the Stochastic shows a bearish divergence, while the daily chart leans bearish. A more prudent approach might be to wait for a clear breakout above $5,039.83 or a confirmed test of support near $5,002.53 before considering entry.
Is the daily RSI at 48.18 a sell signal for XAUUSD right now?
An RSI of 48.18 is in the neutral zone, not strictly an oversold or overbought signal. While it indicates a slight downward trend on the daily chart, it doesn't provide a definitive sell signal on its own. It suggests that sellers have a slight edge, but confirmation from other indicators like MACD and price action below key support levels would be needed.
How will the rising DXY at 99.67 affect XAUUSD's price this week?
A rising DXY at 99.67 typically puts downward pressure on gold prices, as they often have an inverse correlation. However, strong geopolitical tensions can override this, leading to a scenario where both rise. Traders should watch if gold continues to rise despite dollar strength, signaling geopolitical risk is the dominant factor, or if it falters as the dollar strengthens.
| Indicator | Value | Signal | Interpretation |
|---|---|---|---|
| RSI (14) | 52.2 | Neutral | Neutral, slight upward trend on 1H; downtrend on 4H/1D. |
| MACD | Positive Momentum | Bullish | Positive on 1H, negative on 4H/1D. Conflicting signals. |
| Stochastic | K=48.31, D=73.8 | Bearish | Bearish crossover on 1H, bullish on 4H. Divergent. |
| ADX | 13.07 | Weak Trend | Suggests a lack of strong directional conviction on daily timeframe. |
| Bollinger Bands | Mid Band Break | Watch | Price is above mid-band on 1H, below on 4H/1D. |
Track markets in real-time
AI-powered analysis, technical indicators and real-time price data.
Join Our Telegram Channel
Breaking market news, AI analysis and trading signals instantly.
Join Channel