NZDUSD Trades Near $0.58591 Resistance: Bears Eyeing a Downturn
NZDUSD hovers near key resistance at $0.58591. Technical indicators and a strong dollar suggest bears may be gaining control. Here's what to watch.
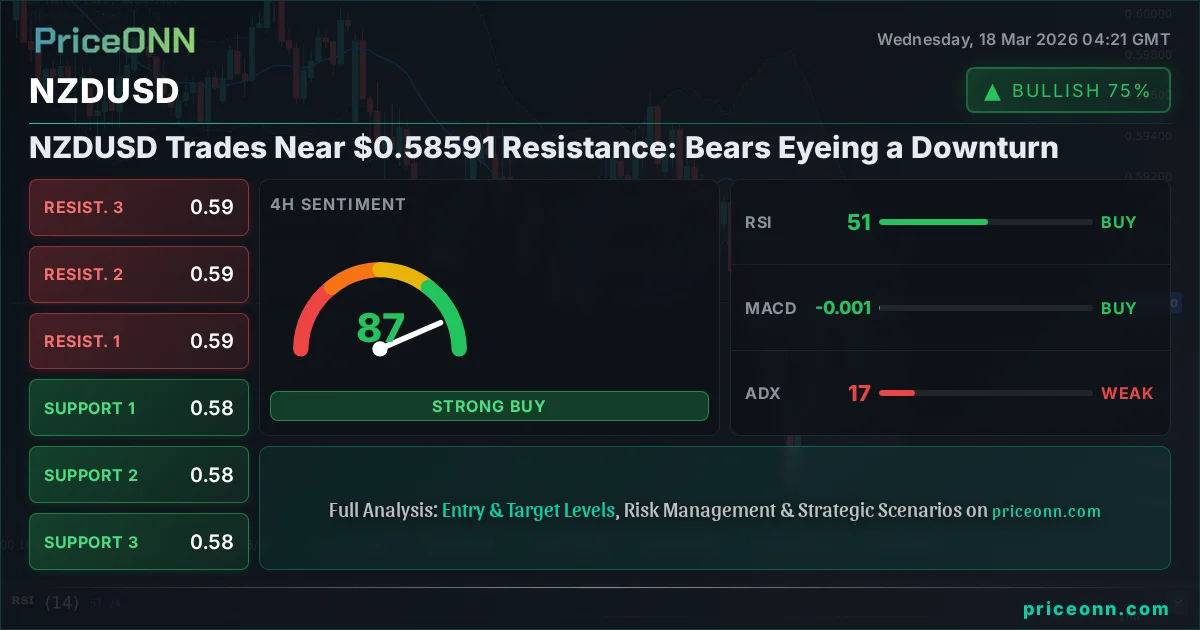
NZDUSD is currently finding itself at a critical juncture, trading precariously close to the $0.58591 mark. This level isn't just another number; it represents a significant area of resistance that has held firm, suggesting that the bears might be regaining their grip on the pair. The recent uptick in the US Dollar Index (DXY) and a general cautiousness in global risk sentiment are adding layers of complexity, painting a picture where the path of least resistance could be downwards. This analysis delves into the multi-faceted scenario surrounding NZDUSD, dissecting the technical indicators, fundamental drivers, and potential market triggers that will shape its trajectory in the coming days and weeks.
- RSI at 43.42 on the daily chart signals a bearish trend, indicating room for further downside before oversold conditions appear.
- The critical resistance level is firmly at $0.58663, a break above which is needed to challenge the bearish narrative.
- MACD histogram on the daily chart shows negative momentum, suggesting selling pressure is building.
- The strong upward trend in the DXY, currently at 99.31, correlates with downward pressure on NZDUSD, as a stronger dollar makes the pair less attractive.
The Bullish Scenario: A Difficult Ascent
Navigating the Resistance at $0.58591
For the bulls to regain control of NZDUSD, they face an immediate and formidable challenge: breaking decisively above the current price resistance point of $0.58591. Looking at the 4-hour chart, the immediate resistance is pegged at $0.58663, followed by $0.58808. A sustained move above these levels would be the first sign that the bearish sentiment is waning. The daily chart shows a slightly higher resistance at $0.58744, with further significant hurdles at $0.59261. For a bullish outlook to materialize, we need to see not just a price break, but also a change in momentum indicators. The RSI, currently at 43.42 on the daily timeframe, is still comfortably in neutral territory with a downward inclination, suggesting there's substantial room for it to climb before reaching overbought conditions. However, the current trend strength on the daily is categorized as 'Düşüş (Güç: 88%)', which is a strong indicator of bearish dominance. Therefore, any bullish move would require a significant shift in underlying market dynamics.
What Confirms the Bullish Case?
A confirmation of a bullish reversal would likely involve a confluence of factors. Firstly, a clear break and hold above the $0.58663 resistance on the 4-hour chart, ideally accompanied by increased trading volume, would be the initial signal. Following this, a daily close above $0.58744 would strengthen the bullish argument. On the technical front, we'd look for the MACD histogram to flip from its current negative momentum to positive territory, indicating that buying pressure is building. Similarly, the Stochastic oscillator, which is showing a 'Yükseliş sinyali' (%K > %D) on the daily chart with K at 43.67 and D at 32.19, would need to sustain its upward trajectory, ideally moving out of the oversold region. Furthermore, a weakening of the US Dollar Index (DXY) would be a crucial external factor. If the DXY, currently at 99.31, were to retreat from its daily upward trend (Güç: 92%), it would remove a significant headwind for NZDUSD. The ADX on the daily chart at 26.71 indicates a reasonably strong downtrend is in place, meaning that breaking this trend would require considerable force. A sustained move towards the next daily resistance at $0.59261 would signal a potential short-term bullish reversal, but this remains a challenging path given the current data.
The Bearish Scenario: Gravity Takes Hold
The $0.58591 Level as a Firm Ceiling
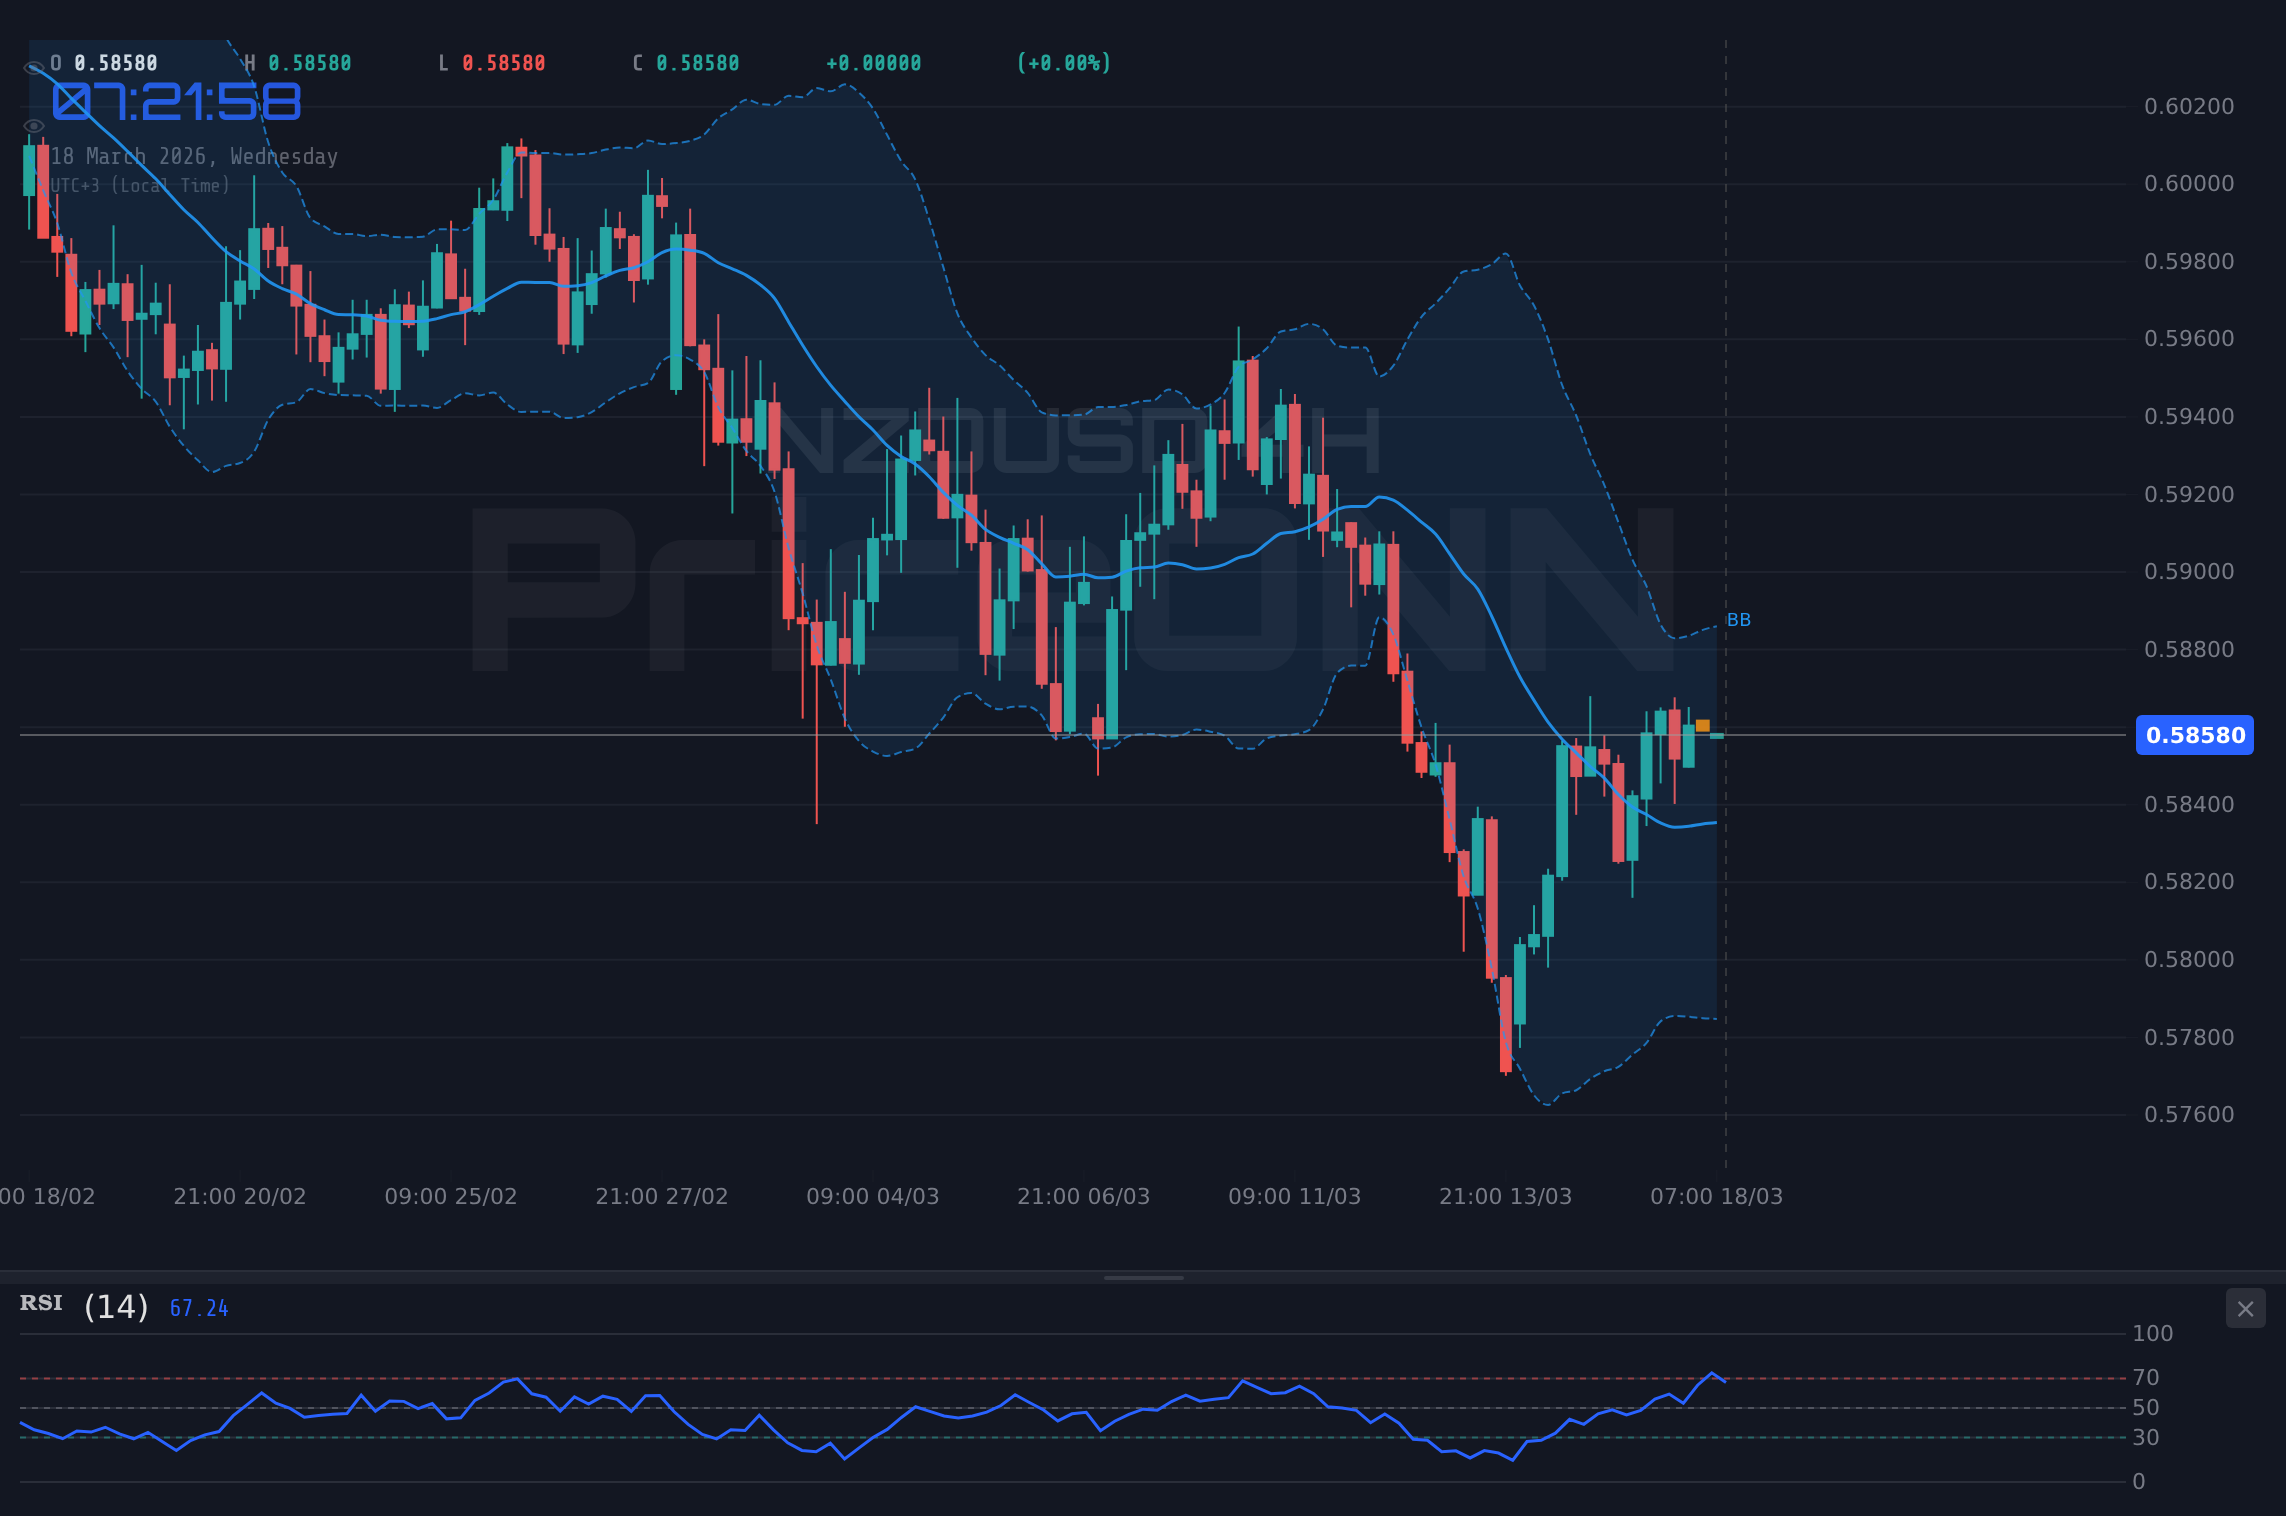
The prevailing sentiment across multiple timeframes leans towards a bearish outlook for NZDUSD, making the $0.58591 price point a critical area of resistance. The 1-hour chart already shows a 'SAT' (Sell) signal with 7 out of 8 indicators pointing downwards, including an RSI of 40.6, negative MACD momentum, and Stochastic K (25.29) below D (31.57). This suggests immediate selling pressure. The 4-hour timeframe, while showing a slightly more mixed picture with some 'AL' (Buy) signals, still maintains a strong downward trend with an ADX of 41.7. The daily chart reinforces this bearish bias, with a dominant 'Düşüş' trend (Güç: 88%) and a 'SAT' signal. The RSI at 43.42 and Stochastic values (K=43.67, D=32.19) indicate room for further decline. The key support levels to watch on the downside are clearly defined: on the 4-hour chart, we have $0.58388, $0.58258, and $0.58113. A break below these levels would confirm the bearish thesis. The daily support levels are even more significant, starting at $0.58227, then $0.57935, and further down at $0.5771. A decisive move below $0.58113 on the 4-hour chart could signal the start of a more significant downtrend.
Why Bears Are Favored Right Now
Several factors currently favor a bearish move for NZDUSD. Firstly, the US Dollar Index (DXY) is showing strength, particularly on the daily chart where it exhibits a strong upward trend (Güç: 92%) and a 'AL' (Buy) signal. With the DXY at 99.31, a stronger dollar typically exerts downward pressure on pairs like NZDUSD. The correlation is clear: as the dollar strengthens, investors tend to move away from perceived riskier assets or currencies like the NZD. The Brent crude oil price, currently at $101.32 and showing a daily 'AL' signal, might seem counterintuitive, but its recent drop (2.18% daily change) despite a strong trend could indicate underlying weakness in energy demand expectations, potentially impacting commodity-linked currencies like the NZD. Furthermore, the broader market sentiment, while not explicitly detailed for NZDUSD's direct correlates, often follows the lead of major indices like the S&P 500 and Nasdaq. The S&P 500's daily chart showing a strong 'SAT' signal and a bearish ADX of 41.09 suggests a risk-off environment could be brewing, which would further support a move into safe-haven assets and away from the New Zealand dollar. The ADX on the NZDUSD daily chart at 26.71 indicates a strong downtrend is in place, meaning that any upward price action might be met with significant selling pressure, making $0.58591 a very sticky resistance level.
The Waiting Game: Range-Bound Consolidation
Caught Between Support and Resistance
While both bullish and bearish scenarios present compelling arguments, there's also a distinct possibility that NZDUSD could enter a period of range-bound consolidation. This often occurs when conflicting signals emerge, or when the market awaits a significant catalyst. Currently, on the 1-hour timeframe, the signals are mixed, with 4 'AL' and 4 'SAT' signals, indicating indecision. The RSI is hovering around 56.35, suggesting neither extreme overbought nor oversold conditions are present. The ADX at 13.88 on the 1-hour chart is notably weak, pointing to a lack of a strong trend. This could lead to price action oscillating between the immediate support at $0.58500 and resistance at $0.58594. On the 4-hour chart, the Stochastic oscillator is in the overbought region (K=89.24, D=90), which might suggest a short-term pullback, but the RSI at 57.4 and positive MACD momentum indicate underlying strength that could prevent a significant drop. This duality - overbought stochastic versus rising RSI and MACD - creates a classic setup for sideways movement. The key levels to watch for range-bound trading would be the 4-hour support at $0.58406 and resistance at $0.58656. Price action confined within this range, without a clear breakout in either direction, would signify a market in consolidation.
What Keeps NZDUSD Stuck?
Several factors could contribute to NZDUSD remaining range-bound. Firstly, upcoming economic data from both New Zealand and the United States could provide conflicting signals, leading traders to pause before committing to a direction. For instance, if New Zealand employment figures are stronger than expected, it might support the Kiwi, but if US inflation data comes in hotter, it could bolster the DXY and cap any NZD gains. The Reserve Bank of Australia (RBA) recently signaled a hawkish stance, as noted in the news, which could provide some indirect support to the broader commodity complex, including the NZD. However, this might be counteracted by persistent strength in the US dollar, driven by expectations of continued hawkishness from the Federal Reserve, especially if inflation remains sticky. Without a clear directional bias from these macro forces, price action often becomes choppy and range-bound. The absence of a strong trend on the shorter timeframes (1H ADX 13.88) further supports the idea of consolidation. Traders might be waiting for a clearer signal, such as a definitive shift in the DXY's trend or a major economic surprise, before initiating larger positions.
The Most Likely Path: A Cautious Bearish Lean
Weighing the Evidence
Considering the confluence of technical and fundamental factors, the most likely scenario for NZDUSD in the short to medium term appears to be a continuation of the bearish trend, albeit with potential for consolidation periods. The daily chart presents a strong bearish picture: a dominant downtrend (ADX 26.71), negative MACD momentum, and an RSI that, while not oversold, has room to fall. The key resistance at $0.58591 has held, and the immediate 4-hour resistance at $0.58663 is a significant hurdle. The strength of the DXY, currently exhibiting a robust daily uptrend (Güç: 92%), acts as a powerful headwind for NZDUSD. The correlation between a strong dollar and a weaker NZD is well-established, and with the DXY showing bullish signs, it’s logical to expect pressure on NZDUSD. The news regarding the RBA's hawkish stance is a potential counter-argument, but it might be overshadowed by the broader US dollar strength and the technical setup. While the 1-hour chart shows mixed signals, the longer-term daily and 4-hour charts lean bearish. Therefore, the probability of a downside move seems higher.
Probability Estimate and Key Triggers
I assign a 65% probability to the bearish scenario playing out in the next 1-2 weeks, with a 25% chance of range-bound trading and only a 10% chance of a sustained bullish breakout above $0.58744. The key triggers to watch will be: 1) The DXY's ability to maintain its upward momentum or show signs of faltering. A break below its immediate support levels could offer NZDUSD some relief. 2) The closing price of NZDUSD relative to the $0.58663 resistance on the 4-hour chart. A decisive close below $0.58500 would strengthen the bearish case significantly. 3) Upcoming economic data releases from both New Zealand (e.g., GDP, inflation figures) and the US (e.g., employment reports, inflation data). Any significant deviation from expectations could shift the balance. Specifically, if US inflation data comes in hotter than anticipated, it could fuel further DXY strength and push NZDUSD lower. Conversely, weaker US data might offer a reprieve, but the overall trend bias remains bearish until proven otherwise. The current ADX reading of 26.71 on the daily chart suggests a trend is active, and without strong opposing signals, it's likely to continue.
What I'm Watching This Week
My focus this week will be on how NZDUSD behaves around the $0.58591 price point and the key resistance level at $0.58663. A failure to break higher here, coupled with a continued rise in the DXY (currently at 99.31), would solidify the bearish outlook. I'll be closely monitoring the 4-hour chart for any decisive closes below $0.58500, which would signal an acceleration to the downside towards $0.58258 and potentially $0.58113. The daily RSI at 43.42 provides ample room for a downward move. On the flip side, a strong surge in risk appetite globally, accompanied by a weakening dollar and a confirmed breakout above $0.58744 on the daily chart, would be needed to invalidate the bearish thesis. Until then, the path of least resistance appears to be lower, with traders likely looking for opportunities to sell into strength near the current resistance levels.
Bearish Scenario: Key Levels to Watch
65% ProbabilityConsolidation Scenario: The Waiting Game
25% ProbabilityBullish Scenario: An Uphill Battle
10% Probability| Indicator | Value | Signal | Interpretation |
|---|---|---|---|
| RSI (14) | 43.42 | Bearish | Room to fall, trend is down |
| MACD Histogram | -0.003 | Bearish | Negative momentum building |
| Stochastic | K=43.67, D=32.19 | Bullish | Pulling up, but from low levels |
| ADX (14) | 26.71 | Strong Trend | Active downtrend |
| Bollinger Bands | Price Below Mid | Bearish | Downward pressure |
Frequently Asked Questions: NZDUSD Analysis
What happens if NZDUSD breaks below the $0.58113 support level?
A break below $0.58113 on the 4-hour chart would strongly confirm the bearish thesis. This would likely trigger further selling pressure, targeting the next daily support level at $0.57935. Expect increased volatility as the downtrend accelerates.
Should I consider buying NZDUSD at current levels near $0.58591 given the mixed signals?
Buying at current levels near $0.58591 is not advisable given the strong resistance and bearish signals on longer timeframes. While the 1-hour chart shows some mixed signals, the overall trend bias is downwards. A more prudent approach would be to wait for a clear break above resistance or a confirmed move towards support levels.
Is the RSI at 43.42 a sell signal for NZDUSD right now?
An RSI of 43.42 on the daily chart is not an oversold condition, but rather indicates room for further decline. While not a direct sell signal on its own, combined with negative MACD momentum and strong DXY, it supports the bearish outlook. It suggests that current price levels are not yet attractive for buyers.
How will the upcoming US inflation data impact NZDUSD this week?
Higher-than-expected US inflation data would likely strengthen the DXY (currently at 99.31), increasing downward pressure on NZDUSD. Conversely, softer inflation could lead to DXY pullback, offering some relief to NZDUSD. Traders will be watching closely for any signs of persistent inflation, which could influence Fed policy expectations.
Track markets in real-time
AI-powered analysis, technical indicators and real-time price data.
Join Our Telegram Channel
Breaking market news, AI analysis and trading signals instantly.
Join Channel