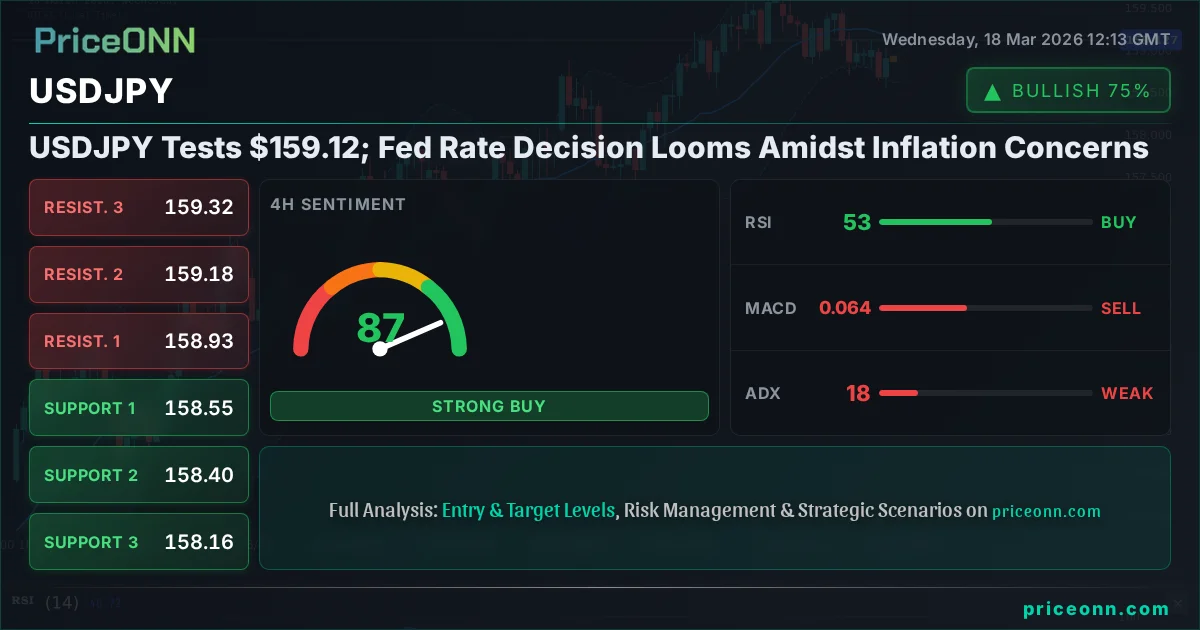
USDJPY Tests $159.12; Fed Rate Decision Looms Amidst Inflation Concerns
USDJPY hovers near $159.12 as traders await the crucial Fed rate decision. Inflation data and geopolitical tensions are key drivers.
The Japanese Yen is once again at a critical juncture, with USDJPY currently trading around the pivotal $159.12 mark. This level is more than just a number; it's a battleground where the Federal Reserve's upcoming policy decisions, persistent inflation fears, and simmering geopolitical tensions collide. As traders brace for the Fed's announcement, the market sentiment surrounding the dollar and yen remains a complex tapestry of caution and anticipation. This isn't just about interest rate differentials anymore; it's about the broader macroeconomic landscape and how it shapes currency movements.
- USDJPY is trading at $159.12, with key resistance at $159.39 and support at $159.34.
- The Federal Reserve is expected to hold rates steady, but updated projections on inflation and potential rate cut delays are critical.
- DXY strength at 99.4, coupled with elevated oil prices ($104.89 for Brent), adds to inflationary pressures.
- Geopolitical tensions in the Middle East and the ongoing Russia-Ukraine conflict continue to fuel safe-haven demand, impacting currency correlations.
The immediate focus for USDJPY traders is undoubtedly the Federal Reserve's upcoming meeting. Market participants are widely expecting the Fed to maintain its current interest rate policy. However, the real market-moving information will likely come from the updated economic projections and the accompanying press conference. Investors will be scrutinizing any hints about the future path of monetary policy, particularly concerning inflation outlooks and the timing of potential rate cuts. Any indication that inflation remains 'stubborn,' as some analysts suggest, could lead to revised projections showing fewer rate cuts this year than previously anticipated. This would typically bolster the dollar, pushing USDJPY higher, but the current market dynamics are far from typical.
The DXY (Dollar Index), currently at 99.4, has shown strength, adding another layer to the USDJPY equation. A stronger dollar generally exerts downward pressure on pairs like USDJPY, but the yen's unique position as a safe-haven asset, and its sensitivity to Japanese Ministry of Finance intervention, complicates this relationship. The recent news flow, highlighting potential intervention as USDJPY hovers near the 159 level, adds a significant layer of uncertainty. This isn't just a simple forex play; it's a high-stakes game influenced by central bank rhetoric, economic data releases, and the ever-present threat of currency intervention.
Adding to the complexity are the persistent inflationary pressures, exemplified by the Brent crude oil price, which has climbed to $104.89. Elevated energy prices have a direct impact on inflation expectations globally. For Japan, a net importer of energy, higher oil prices can exacerbate trade deficits and put downward pressure on the yen. This creates a challenging environment for the Bank of Japan (BoJ), which has been gradually moving away from its ultra-loose monetary policy. The BoJ’s own policy decisions, or lack thereof, will be a significant factor in how USDJPY behaves, especially in conjunction with the Fed's actions.
The technical picture for USDJPY on the 1-hour timeframe shows a neutral trend with 50% strength. The current price of $159.12 is nestled between immediate resistance at $159.17 and support at $158.81. The RSI(14) at 56.93 suggests a neutral stance but with a slight upward leaning, indicating that the momentum isn't decisively bearish or bullish just yet. However, the MACD is showing negative momentum, with the MACD line below its signal line, which typically signals potential downside. This divergence between the RSI and MACD hints at underlying weakness despite the price hovering near resistance.
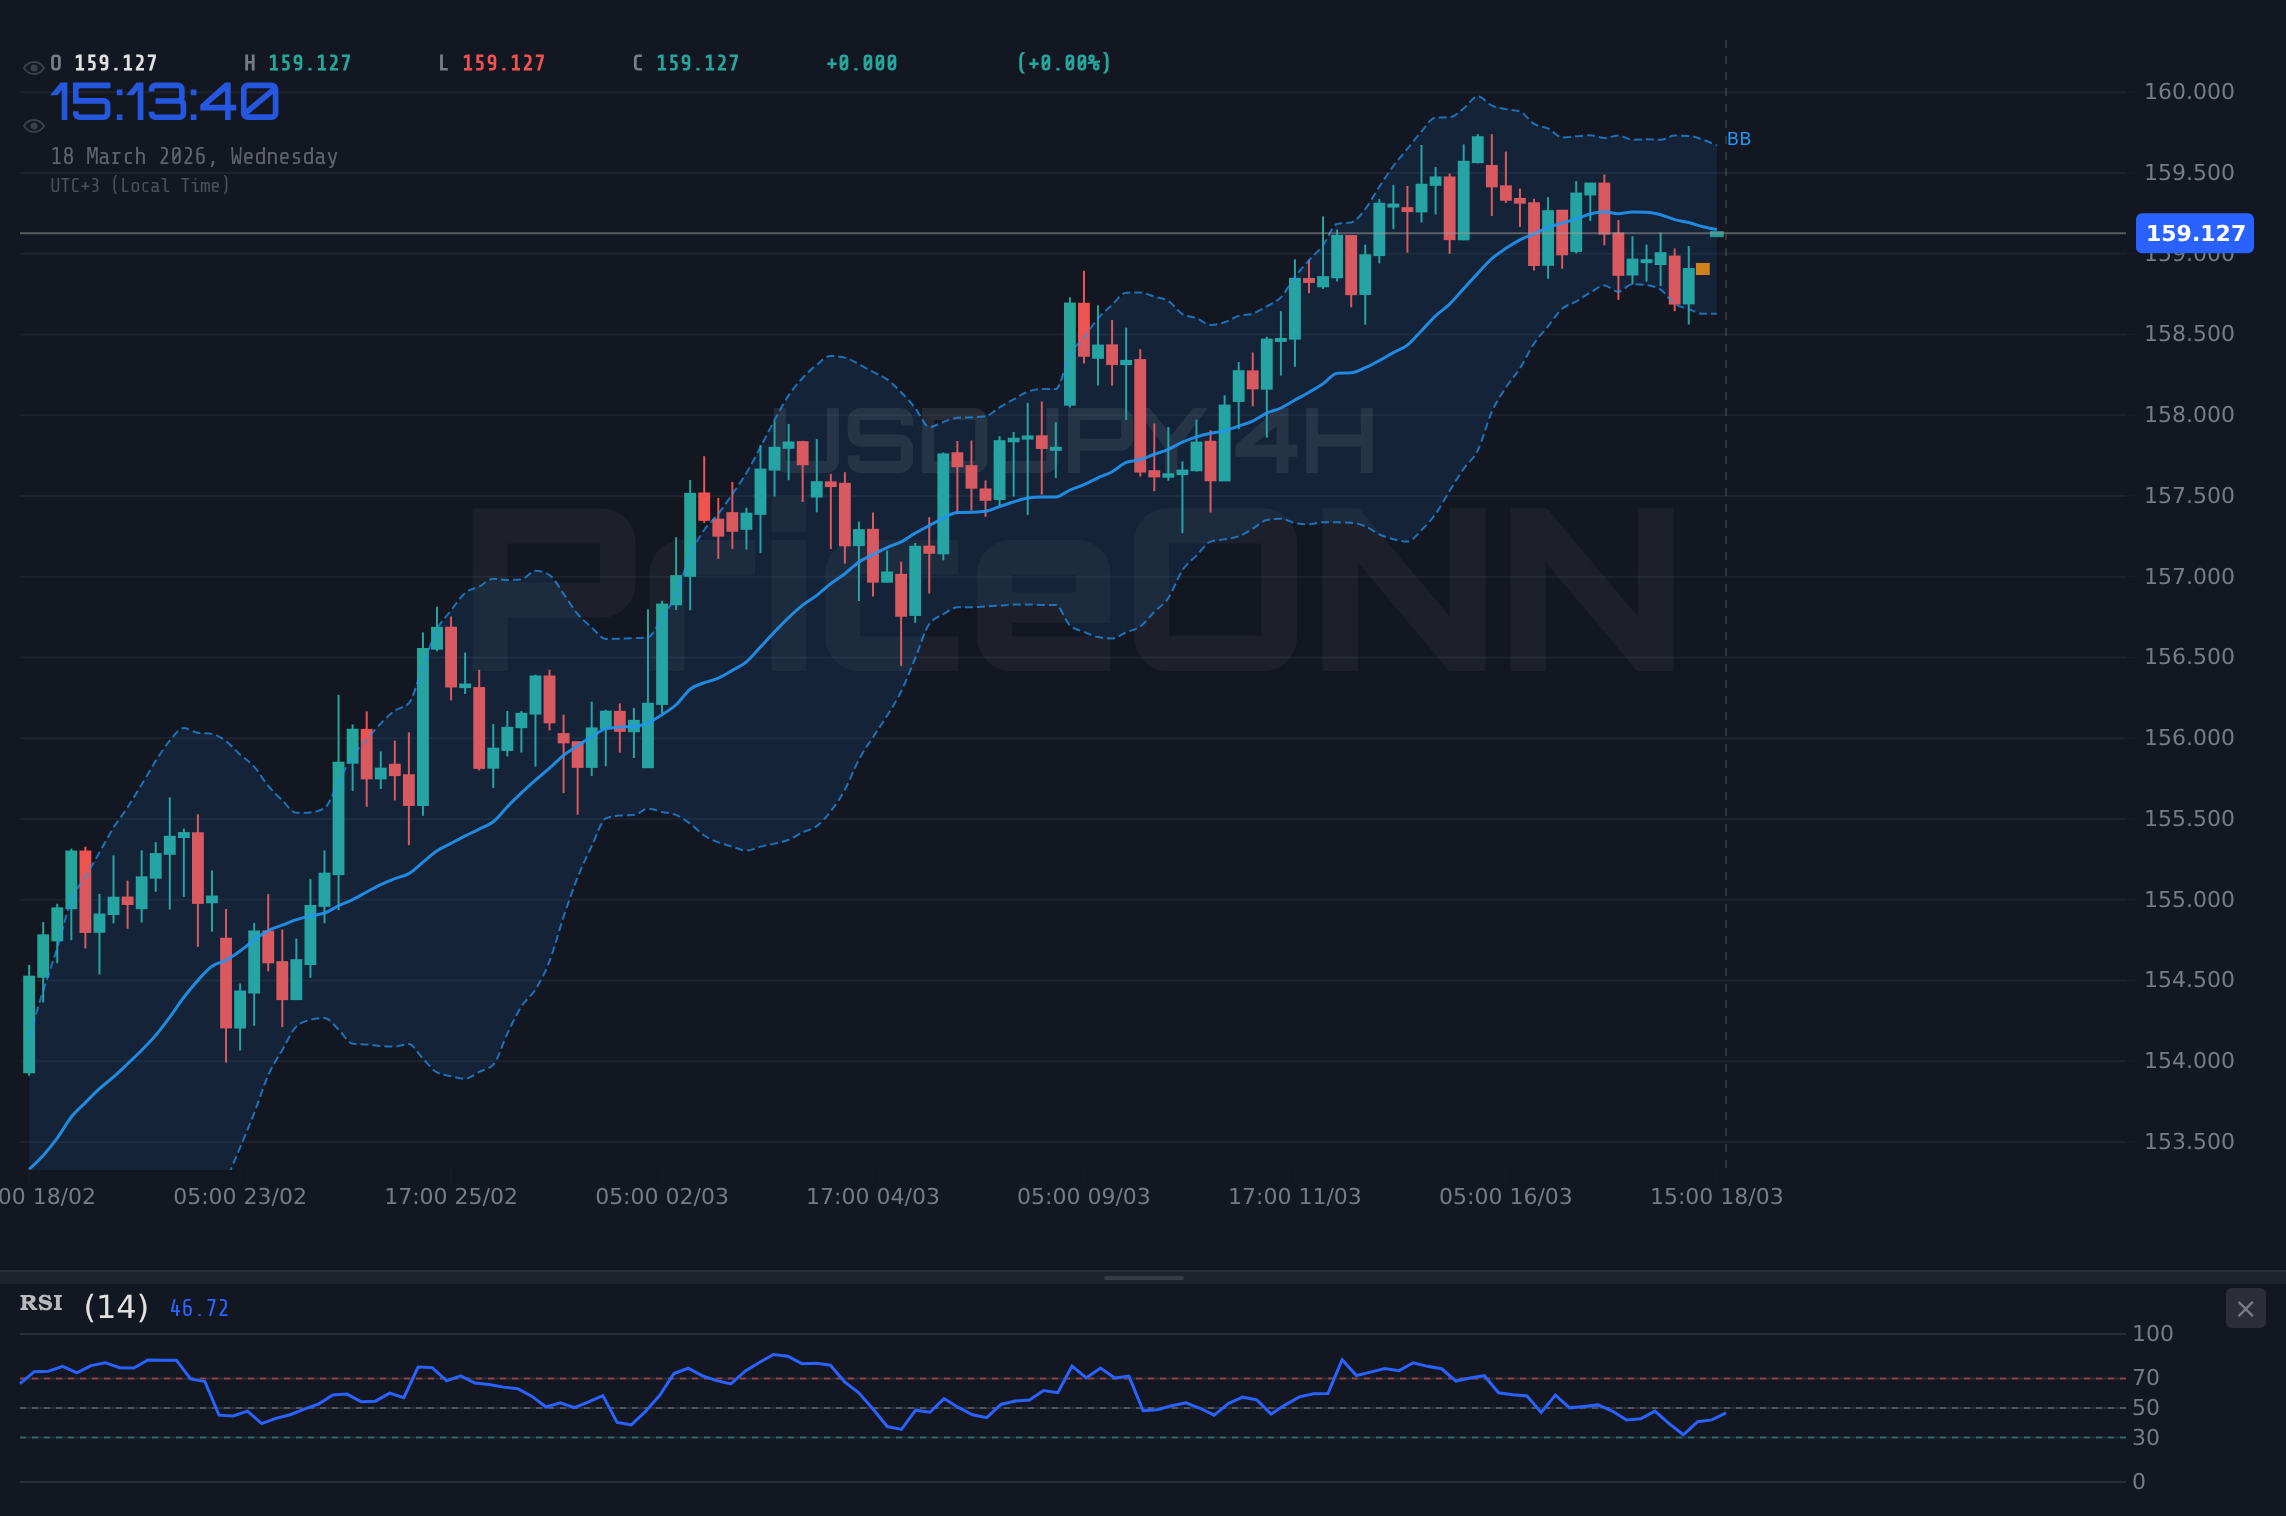
Looking at the 4-hour chart, the trend shifts to neutral with 50% strength, but the ADX at 18.24 suggests a weak trend overall, indicating a market that might be consolidating or preparing for a significant move. Support is identified at $158.16, while resistance stands firm at $159.32. The RSI(14) at 52.66 remains in neutral territory, offering little clarity. The Stochastic oscillator shows %K at 34.41 and %D at 30.75, indicating a bullish signal as %K crosses above %D, but this is occurring in a zone that doesn't scream conviction. The conflicting signals across different timeframes highlight the current indecision in the market.
On the daily chart, the trend for USDJPY turns bullish with 86% strength. This longer-term perspective suggests that despite short-term choppiness, the overall direction might still favor the upside. The key daily support level is at $158.62, and a break below this could signal a more significant trend change. Resistance is eyed at $159.83. The RSI(14) at 64.11 is in the upper neutral zone, suggesting room for further upside before becoming overbought. However, the Stochastic shows %K at 76.24 and %D at 86.18, which is a bearish signal as %K is below %D and approaching overbought territory, indicating potential for a pullback. This daily bullish trend, juxtaposed with the shorter-term neutral to bearish signals and stochastic divergence, creates a scenario ripe for volatility.
The recent news regarding potential Japanese Ministry of Finance intervention cannot be overstated. As highlighted by [Forex Live News Source - hypothetical], the mere specter of intervention often causes traders to become more cautious, especially when USDJPY approaches psychologically significant levels like 160. This intervention risk acts as a constant drag on aggressive bullish bets, even if the fundamental and technical picture might otherwise suggest further upside. The market is constantly gauging the likelihood and potential effectiveness of such interventions, creating an overhang that limits the upside potential and increases the risk of sharp reversals.
Correlating USDJPY's movement with other assets provides crucial context. The DXY is at 99.4, showing a strengthening dollar. Typically, a stronger dollar supports USDJPY. However, the yen's safe-haven status means that in periods of extreme global risk aversion, it can sometimes move counter to the dollar. Currently, while geopolitical tensions in the Middle East and the ongoing conflict in Ukraine are present, they haven't triggered a full-blown risk-off sentiment that would drastically alter this correlation. Nonetheless, any escalation could change this dynamic rapidly. The SP500 at 6726.9 and Nasdaq at 24832.24 are showing slight gains, suggesting a degree of risk appetite, which generally supports carry trades involving the yen.
The fundamental drivers supporting a stronger dollar and potentially higher USDJPY include the Fed's hawkish stance, or at least its reluctance to signal imminent rate cuts. If the upcoming Fed projections indeed suggest higher-for-longer interest rates, this would widen the interest rate differential between the US and Japan, a classic bullish driver for USDJPY. Conversely, any dovish surprise from the Fed, or a significant shift in market expectations towards earlier rate cuts, could put immediate pressure on the pair. The market is highly sensitive to these shifts, making the Fed's commentary the most critical data point in the near term.
On the flip side, the Bank of Japan (BoJ) remains a wild card. While the BoJ has begun to normalize its policy by ending negative interest rates, its overall stance is still considered accommodative compared to the Fed. However, persistent yen weakness and imported inflation could force the BoJ to consider more aggressive tightening measures sooner than expected. Such a move would be strongly supportive of the yen, potentially leading to a sharp sell-off in USDJPY. The Ministry of Finance's readiness to intervene is another factor that cannot be ignored, acting as a constant threat to any sustained move above critical levels.
The ADX on the 1-hour chart is 24.44, indicating a moderately strong trend, but the ADX on the 4-hour chart is 18.24, suggesting a weaker trend. The daily ADX at 22.7 points to a moderate trend. This suggests that while there might be directional momentum, it lacks strong conviction across all timeframes. The RSI(14) at 64.11 on the daily chart shows room for upside, but the Stochastic is showing a bearish divergence, hinting at a potential reversal. This technical conflict requires traders to be vigilant. A close above $159.39 on the 1-hour chart would be needed to confirm bullish momentum, while a break below the $158.62 daily support would signal a more significant bearish turn.
Considering the interplay of these factors - Fed policy expectations, intervention risk, inflationary pressures, and mixed technical signals - the immediate outlook for USDJPY appears to be one of consolidation with high volatility potential. Traders are likely to remain on the sidelines ahead of the Fed's decision, leading to choppy price action around the $159.12 level. Any move will be heavily influenced by the nuances of the Fed's statement and any hints of intervention from Japanese authorities. The market is in a delicate balance, and a significant catalyst is needed to break the current stalemate.
The current price action around $159.12 reflects this uncertainty. While the daily trend might be bullish, the shorter-term charts and the stochastic divergence paint a picture of caution. The 1H RSI at 56.93 and 4H RSI at 52.66 suggest that neither bulls nor bears have a clear upper hand on intraday and short-term swings. However, the 1D RSI at 64.11 still points to potential upside if the Fed delivers a less hawkish-than-expected outlook. The 1H MACD negative momentum and 4H MACD negative momentum are significant headwinds for immediate upside, suggesting that any rallies might face selling pressure near the $159.39 level.
The ADX values ranging from 18.24 to 24.44 across the timeframes confirm that while there's a directional bias on the daily chart, the shorter-term trends are not strongly established. This means that breakout attempts might be prone to failure, and range-bound trading could dominate until clearer signals emerge. The Stochastic on the 1H chart shows K=86.04, D=50.8, a bullish signal, but on the daily chart, K=76.24, D=86.18 presents a bearish divergence. This conflicting information underscores the need for a patient approach, waiting for confirmation rather than chasing the market.
Frequently Asked Questions: USDJPY Analysis
What happens if USDJPY breaks below $158.62 support after the Fed decision?
A break below the $158.62 daily support level would invalidate the longer-term bullish trend and likely signal a more aggressive sell-off. This could be triggered by a surprisingly dovish Fed or intervention fears materializing, potentially targeting $158.16 and even $157.84.
Should I buy USDJPY at current levels of $159.12 given the mixed signals?
Buying at $159.12 carries significant risk due to mixed technical indicators and intervention threats. A more prudent approach would be to wait for a clear breakout above $159.39 with strong volume, or a confirmed bounce from $158.62, ideally with a less hawkish Fed outcome.
Is the daily RSI at 64.11 a buy signal for USDJPY?
The daily RSI at 64.11 is in the upper neutral zone, suggesting room for upside but not yet an outright buy signal. It needs to be considered alongside other indicators like the daily Stochastic, which shows bearish divergence. This combination suggests that while the trend might extend, momentum is weakening, and a pullback is possible.
How will the Fed decision and potential intervention affect USDJPY this week?
A hawkish Fed decision, implying higher-for-longer rates, could push USDJPY towards $159.83, but intervention risk remains. A dovish Fed or clear signs of intervention could trigger a sharp move down, potentially testing $158.62. The market is highly sensitive to both catalysts.
Bearish Scenario: Intervention Fears Mount
65% ProbabilityNeutral Scenario: Consolidation Around $159.12
25% ProbabilityBullish Scenario: Fed Dovishness Ignites Rally
10% ProbabilityTrack markets in real-time
AI-powered analysis, technical indicators and real-time price data.
Join Our Telegram Channel
Breaking market news, AI analysis and trading signals instantly.
Join Channel