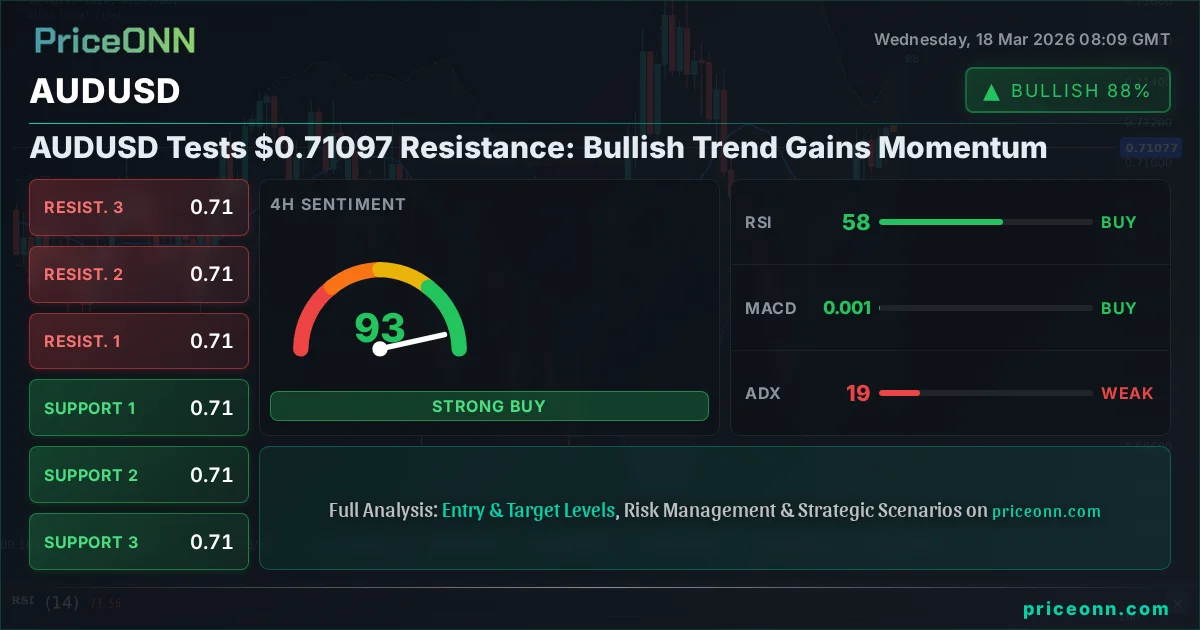
AUDUSD Tests $0.71097 Resistance: Bullish Trend Gains Momentum
AUDUSD hovers near $0.71097 amid RBA rate hike bets. Analysis shows potential for further upside if key resistance at $0.71201 holds.
As AUDUSD hovers around the critical $0.71097 mark, the question on many traders' minds is whether the current bullish momentum can overcome the immediate resistance. The latest data from the Reserve Bank of Australia (RBA) has injected a renewed sense of optimism into the Aussie dollar, pushing it higher against its US counterpart. This analysis dives deep into the technical indicators and fundamental drivers shaping the AUDUSD's trajectory, exploring the key levels that traders must watch in the coming sessions.
- AUDUSD is trading at $0.71097, showing a bullish bias on the 4-hour and 1-day charts.
- Key resistance is forming around $0.71201, a break above which could target $0.71285 and $0.71396.
- The DXY is at 99.4, showing strength that typically pressures AUDUSD, but the Aussie is currently showing resilience.
- RSI(14) on the 1-hour chart is at 48.99, indicating room for upward movement before hitting overbought territory.
- The RBA's recent rate hike, as reported by forex news, has been a significant catalyst for the AUD's strength.
Navigating the AUDUSD Landscape: A Tale of Two Timelines
The AUDUSD pair is currently demonstrating a fascinating tug-of-war between the inherent strength of the Australian dollar, bolstered by recent central bank action, and the persistent influence of a strong US dollar. On the 1-hour chart, the trend is neutral, showing a balance of power, but the 4-hour and 1-day timeframes both lean bullish, suggesting that the path of least resistance might be upwards. This divergence across timeframes is precisely where savvy traders find opportunities. The 1-hour chart, with its RSI at 48.99, suggests there's still room for the bulls to push higher without immediately hitting overbought conditions. However, the ADX reading of 27.08 on this same timeframe indicates a trend that is gaining some traction, even if it's not yet overwhelmingly strong. This suggests that while upward movement is possible, it might face immediate headwinds.
The recent news highlighting the RBA's rate hike and the subsequent climb of AUD/USD to 0.7104 underscores the market's reaction to Australian monetary policy. This fundamental catalyst is crucial. When a central bank tightens policy, it generally makes that currency more attractive due to higher potential yields. For AUDUSD, this means that even if the US dollar shows signs of strength, as indicated by the DXY at 99.4, the Aussie has a fundamental tailwind. The DXY's upward move, typically a headwind for AUDUSD, is currently being counteracted by the RBA's hawkish stance. This is a classic example of how fundamental news can temporarily override typical correlation patterns.
Looking at the 4-hour chart, the picture becomes clearer. The trend is firmly bearish in terms of trend strength (100%), yet the overall signal is BUY. This might seem contradictory, but it often signifies a period of consolidation or a potential reversal building within a larger bearish structure. The RSI is at 39.82, still in neutral territory and showing a downward inclination, which aligns with the bearish trend strength. However, the Stochastic indicator is flashing a bullish signal (%K > %D), and the MACD shows positive momentum. This mixed signal on the 4-hour chart suggests that while the longer-term trend might have been bearish, there's a short-term buying pressure emerging. The ADX at 42.63 indicates a strong trend, but the conflicting signals from other indicators suggest this trend might be losing conviction or preparing for a shift. It's a complex tapestry of signals that requires careful interpretation.
The Battle for Key Levels: Where the Bulls and Bears Clash
The immediate focus for AUDUSD traders will be the resistance levels. On the 1-hour chart, the first significant hurdle is at $0.71285, followed by $0.7142 and then $0.7185. A decisive break above $0.71285 would be a strong signal that the bulls are gaining control. This level is crucial because it represents a point where selling pressure has previously intensified. If buyers can push through this barrier with conviction, it could trigger a cascade of stop-loss orders from short sellers, accelerating the upward move. The ADX on the 1-hour chart, though indicating a moderate trend strength of 27.08, suggests that any breakout needs to be accompanied by increasing volume and momentum to be sustainable.
On the 4-hour chart, the resistance levels are slightly higher, with the first major point of contention at $0.71201, then $0.71285, and $0.7142. The fact that these levels align across different timeframes adds to their significance. If AUDUSD can clear $0.71201, it would represent a significant technical achievement. The daily chart resistance levels are even more critical: $0.71278, $0.71569, and $0.71968. Breaking through $0.71278 would signal a potential shift in the daily trend, which is currently showing a bearish inclination with an RSI of 46.31. However, the ADX on the daily chart is a mere 13.43, indicating a very weak trend, which often precedes significant price movements once a direction is established. This low ADX reading on the daily chart suggests that the market is currently indecisive, but the higher timeframes (4H) are showing more conviction.
Conversely, the support levels provide the safety net for the bulls. On the 1-hour chart, immediate support is found at $0.7098, followed by $0.70895, and then $0.70811. A break below $0.7098 would signal a potential short-term reversal and could lead to a test of the lower support levels. On the 4-hour chart, support is seen at $0.7098, $0.70895, and $0.70811. These levels are quite close, suggesting that if the pair starts to pull back, the downside might be limited in the short term. However, the daily support levels at $0.70588, $0.70189, and $0.69898 are much further down. A decisive break below the $0.70588 support level on the daily chart would invalidate the current bullish sentiment and suggest a more significant downtrend is resuming.
The Role of the US Dollar Index (DXY) and Equities
The DXY is currently trading at 99.4, showing a daily increase of 0.22%. This strength in the dollar typically acts as a headwind for currency pairs like AUDUSD. Historically, a rising DXY often correlates with a falling AUDUSD. However, as noted earlier, the RBA's recent policy decision appears to be providing a strong counter-balance. The RSI for the DXY is at 55.62 on the 1-hour chart and 52.04 on the 4-hour chart, indicating a neutral to slightly bullish bias for the dollar itself. The ADX for the DXY is also showing strengthening trends across timeframes, particularly the strong 34.21 on the daily chart. This suggests that while the Aussie has fundamental support, the broader dollar strength cannot be ignored and could cap further upside for AUDUSD if it continues to accelerate.
Equities, particularly the S&P 500 (SP500) and Nasdaq 100 (Nasdaq), provide another layer of context. The SP500 is currently at 6753.55, up 0.52% on the day, while the Nasdaq is at 24949.75, up 0.61%. Both indices are showing strong upward momentum on their 1-hour and 4-hour charts, indicating a healthy risk appetite in the market. Typically, strong equity markets correlate positively with risk-sensitive currencies like the Australian dollar. This provides a supportive backdrop for AUDUSD. If risk sentiment were to sour, and these indices were to turn downwards, it would likely add further pressure on AUDUSD, potentially exacerbating any move towards the lower support levels. For now, the positive performance in equities suggests that risk-on conditions are prevailing, which is generally favourable for the Aussie.
Fundamental Drivers: RBA's Influence and Inflation Watch
The recent surge in AUD/USD following the RBA rate hike is a clear demonstration of how monetary policy can dictate currency movements. While the exact details of the RBA's forward guidance are crucial for sustained moves, the initial reaction signals a hawkish tilt. This contrasts with the Federal Reserve's (Fed) current stance, where market participants are bracing for the Fed to maintain current interest rates. The divergence in central bank policies is a key driver for currency pairs. If the RBA continues to signal further tightening while other major central banks remain on hold or even consider easing, the Australian dollar could see sustained strength. This is a narrative that traders will be closely watching in the coming weeks.
Inflation remains a central theme globally, and its implications for AUDUSD are multifaceted. Higher inflation typically leads central banks to raise interest rates to cool the economy, which can strengthen the currency. However, if inflation becomes too persistent or leads to slower economic growth, it can have the opposite effect. The current data for AUDUSD doesn't provide explicit inflation figures, but the underlying global inflation concerns are a backdrop to central bank decisions. The price of oil, for instance, is a key indicator of inflationary pressures. Brent crude is trading at $102.61, showing a daily decrease, while WTI is at $93.93, also down. A sustained drop in oil prices could ease some inflationary concerns, potentially influencing future central bank decisions and, by extension, AUDUSD.
The recent news about US oil inventories unexpectedly surging amidst Strait of Hormuz tensions, while seemingly contradictory to rising oil prices, highlights the complexity of the energy market. Such inventory builds can put downward pressure on oil prices, which in turn could reduce inflationary expectations. This could indirectly affect the RBA's and the Fed's policy outlook. If inflation fears subside, the urgency for aggressive rate hikes might diminish, potentially impacting the attractiveness of the Australian dollar relative to other currencies.
Technical Signals and Their Interpretations
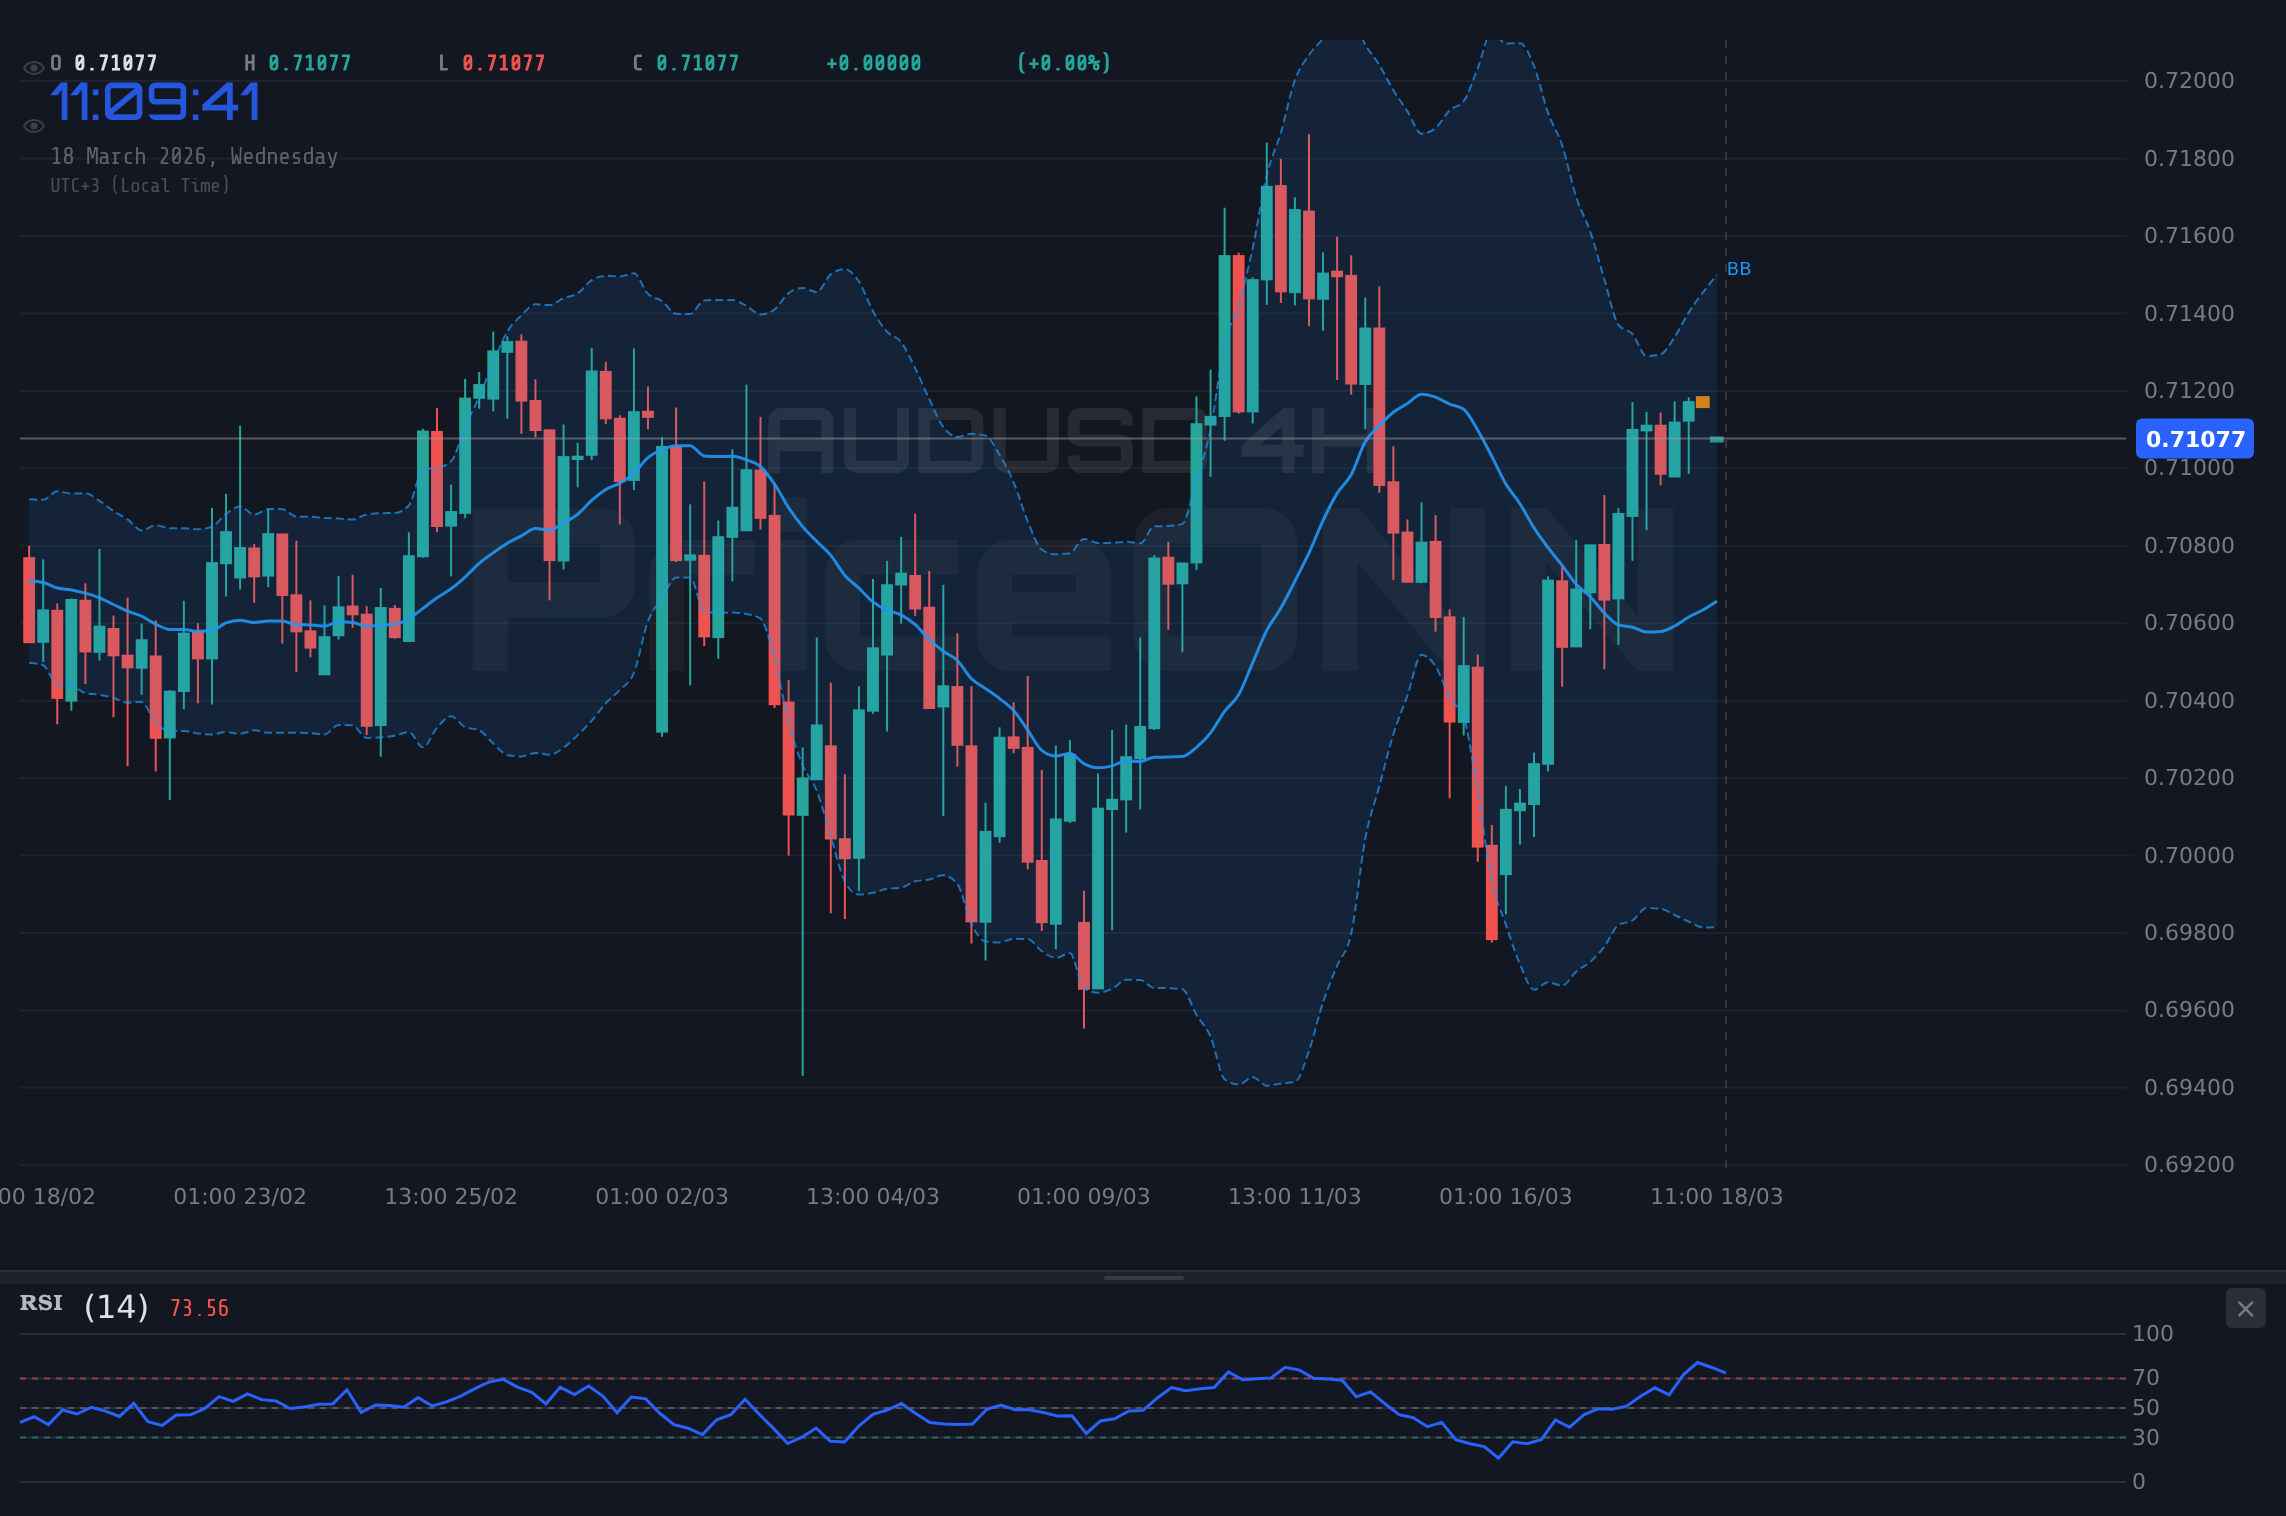
Delving into the technical indicators for AUDUSD reveals a nuanced picture. On the 1-hour timeframe, the RSI at 48.99 suggests room for upward movement, while the Stochastic is giving a bullish crossover (%K > %D). However, the MACD is showing negative momentum, and the ADX at 27.08 points to a trend that is present but not yet dominant. This combination implies that while a short-term bounce is possible, it might lack strong conviction. The Bollinger Bands on this timeframe are also showing the price trading above the middle band, indicating a slight upward bias, but the overall signal is neutral.
The 4-hour chart presents a stronger bullish leaning in its overall signal, despite the bearish trend strength indicator. The RSI at 39.82 is still in neutral territory, but the Stochastic is showing a clear bullish signal (%K > %D), and the MACD is positive. This is where the divergence becomes more pronounced. The ADX at 42.63 indicates a strong trend, which, when combined with the bullish Stochastic and MACD, suggests that the market might be looking to reverse or at least consolidate with an upward bias. The price is trading below the middle Bollinger Band, which is often a sign of bearish momentum, but the other indicators are leaning towards a potential upward move. This conflict means caution is advised; confirmation is needed.
On the daily chart, the picture is more mixed. The RSI at 46.31 is in neutral territory and trending downwards, suggesting a bearish inclination. The MACD is negative, and the price is below the middle Bollinger Band, reinforcing a bearish outlook. However, the Stochastic is giving a bullish crossover, and the ADX at 13.43 indicates a very weak trend. This low ADX on the daily chart is significant. It suggests that the current daily trend lacks the power to sustain itself and that a breakout in either direction could be imminent. The bullish Stochastic signal, despite other bearish indicators, hints that the downside might be limited, and a reversal could be on the cards if the price can break through key resistance levels.
The conflicting signals across different timeframes, particularly the bearish daily indicators versus the bullish signals on shorter timeframes and the low daily ADX, necessitate a cautious approach. Traders should look for confirmation before entering positions, especially a clear break above resistance or a decisive move below support.
What's Next for AUDUSD? Scenarios and Outlook
The immediate outlook for AUDUSD hinges on its ability to break through the resistance levels identified around $0.71201 to $0.7142. If the bullish momentum, fueled by the RBA's policy stance and positive equity markets, can overcome the dollar's general strength, we could see AUDUSD push higher. A successful breach of $0.7142 could then target the next resistance at $0.71569 and potentially aim for the $0.71968 level on the daily chart. This scenario relies on continued positive sentiment towards the Australian dollar and perhaps a softening of the US dollar's advance. It's also contingent on the RBA's forward guidance remaining hawkish, reinforcing the interest rate differential.
Conversely, if AUDUSD fails to break the immediate resistance, particularly the $0.71201 level, we could see a pullback. The dollar's strength, represented by the DXY at 99.4, could reassert itself. In this scenario, the pair could retreat to test the support at $0.7098, then $0.70895, and potentially lower towards $0.70811 on the 4-hour chart. A decisive break below $0.70588 on the daily chart would significantly increase the probability of a deeper correction, potentially negating the recent gains. This bearish scenario would be more likely if the DXY continues to accelerate, or if global risk sentiment deteriorates, leading investors back to safe-haven assets.
The upcoming economic calendar will be crucial. Traders will be keenly awaiting any further commentary from the Fed regarding their interest rate policy, as well as key inflation and employment data. For the Australian dollar, any hints from the RBA about future policy moves will be paramount. The interplay between these central bank policies and global economic health will ultimately dictate the direction of AUDUSD in the short to medium term. The current setup, with conflicting signals across timeframes and the critical juncture at resistance, presents a challenging but potentially rewarding environment for traders who exercise discipline and patience.
“The market always tells you what it's going to do, if you listen closely. Right now, AUDUSD is whispering about potential upside, but the DXY's shout is hard to ignore. Watch those key levels like a hawk – that's where the real story unfolds.”
Frequently Asked Questions: AUDUSD Analysis
What happens if AUDUSD breaks above the $0.71201 resistance level?
A sustained break above $0.71201 would likely trigger further buying, potentially targeting the next resistance at $0.71285 and then $0.7142. This would signal a continuation of the bullish momentum, especially if confirmed by strong volume and positive sentiment.
Should I buy AUDUSD at current levels of $0.71097 given the mixed signals?
Given the conflicting indicators across timeframes and AUDUSD testing resistance, caution is advised. A more prudent approach might be to wait for a clear confirmation: either a decisive break above $0.71201 resistance for a bullish entry, or a clear break below $0.7098 support for a bearish outlook.
Is the RSI at 48.99 a sell signal for AUDUSD right now?
No, an RSI reading of 48.99 is in the neutral zone and suggests there is still room for upward movement before hitting overbought territory. It does not currently signal a sell, but traders should monitor it for potential divergence or a move towards the 70 level.
How will the upcoming Fed decision affect AUDUSD this week?
If the Fed signals a more hawkish stance (e.g., hinting at earlier rate hikes or fewer cuts), it could strengthen the US dollar and pressure AUDUSD downwards. Conversely, a dovish signal might weaken the dollar, supporting AUDUSD, especially given the RBA's recent hike.
Technical Outlook Summary
| Indicator | Value | Signal | Interpretation |
|---|---|---|---|
| RSI (14) | 48.99 | Neutral | Room for upside on 1H, but showing downward inclination on 4H/1D. |
| MACD | Negative Momentum | Bearish | Suggests selling pressure, contradicting bullish Stochastic on 1H/4H. |
| Stochastic | K=66.83, D=37.97 | Bullish | Bullish crossover on 1H, indicating potential upward move. |
| ADX | 27.08 | Moderate Trend | Trend is present but not dominant on 1H; low daily ADX suggests potential breakout. |
| Bollinger Bands | Middle Band | Watch | Price above middle band on 1H/4H suggests upward bias, but below on 1D. |
Track markets in real-time
AI-powered analysis, technical indicators and real-time price data.
Join Our Telegram Channel
Breaking market news, AI analysis and trading signals instantly.
Join Channel