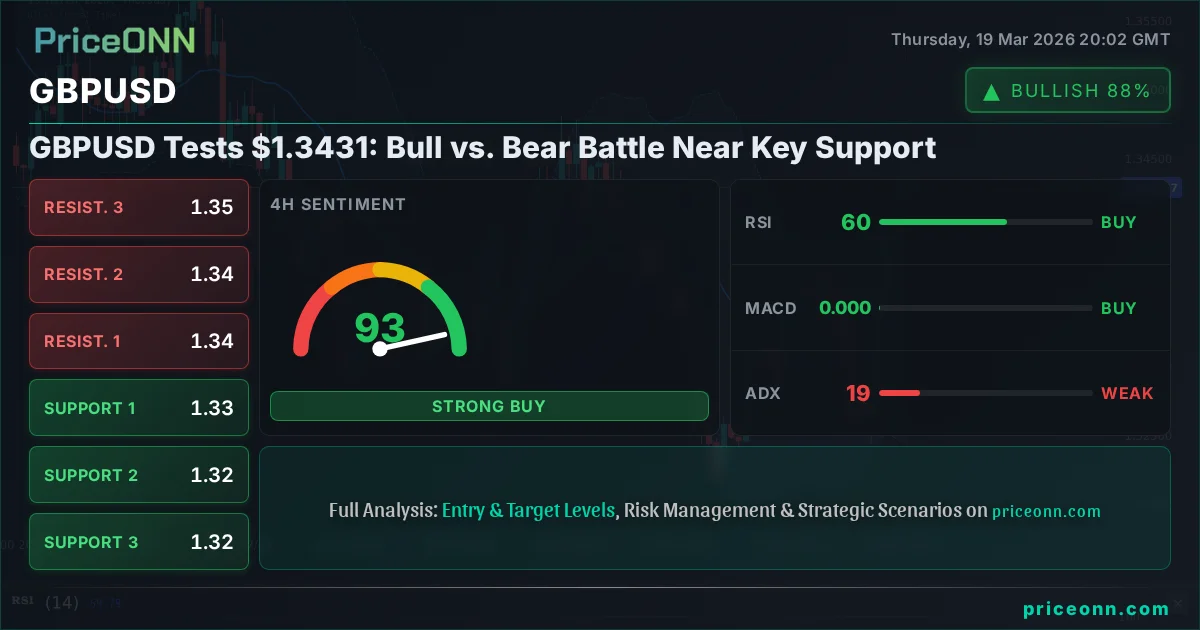
GBPUSD Tests $1.3431: Bull vs. Bear Battle Near Key Support
GBPUSD is testing $1.3431 as the dollar strengthens and economic uncertainty looms. Bulls eye a bounce, while bears eye further downside.
The currency markets are locked in a tense standoff, particularly around the $1.34 mark for GBPUSD. This pivotal level is currently the battleground where bulls and bears are fiercely contesting control, with the pair hovering precariously near critical support. Recent market data reveals a GBPUSD price of $1.34309, down 1.25% on the day, as the US Dollar Index (DXY) shows signs of strength. This tug-of-war is not just about price action; it's a complex interplay of economic data, central bank policy expectations, and broader geopolitical undercurrents that traders are dissecting with a fine-tooth comb. Can the bulls defend the 1.34014 support, or will the bears push through, targeting lower levels?
- GBPUSD is trading near $1.34309, with the 1-hour RSI at 39.72 indicating bearish momentum.
- Critical support is holding around 1.34014, a level that needs to hold for bulls to regain footing.
- The DXY is at 99.00, reinforcing dollar strength and adding pressure on GBPUSD.
- Upcoming UK GDP and US Non-Farm Payrolls data will be crucial catalysts for the next move.
The Bullish Case: A Bounce at the Precipice?
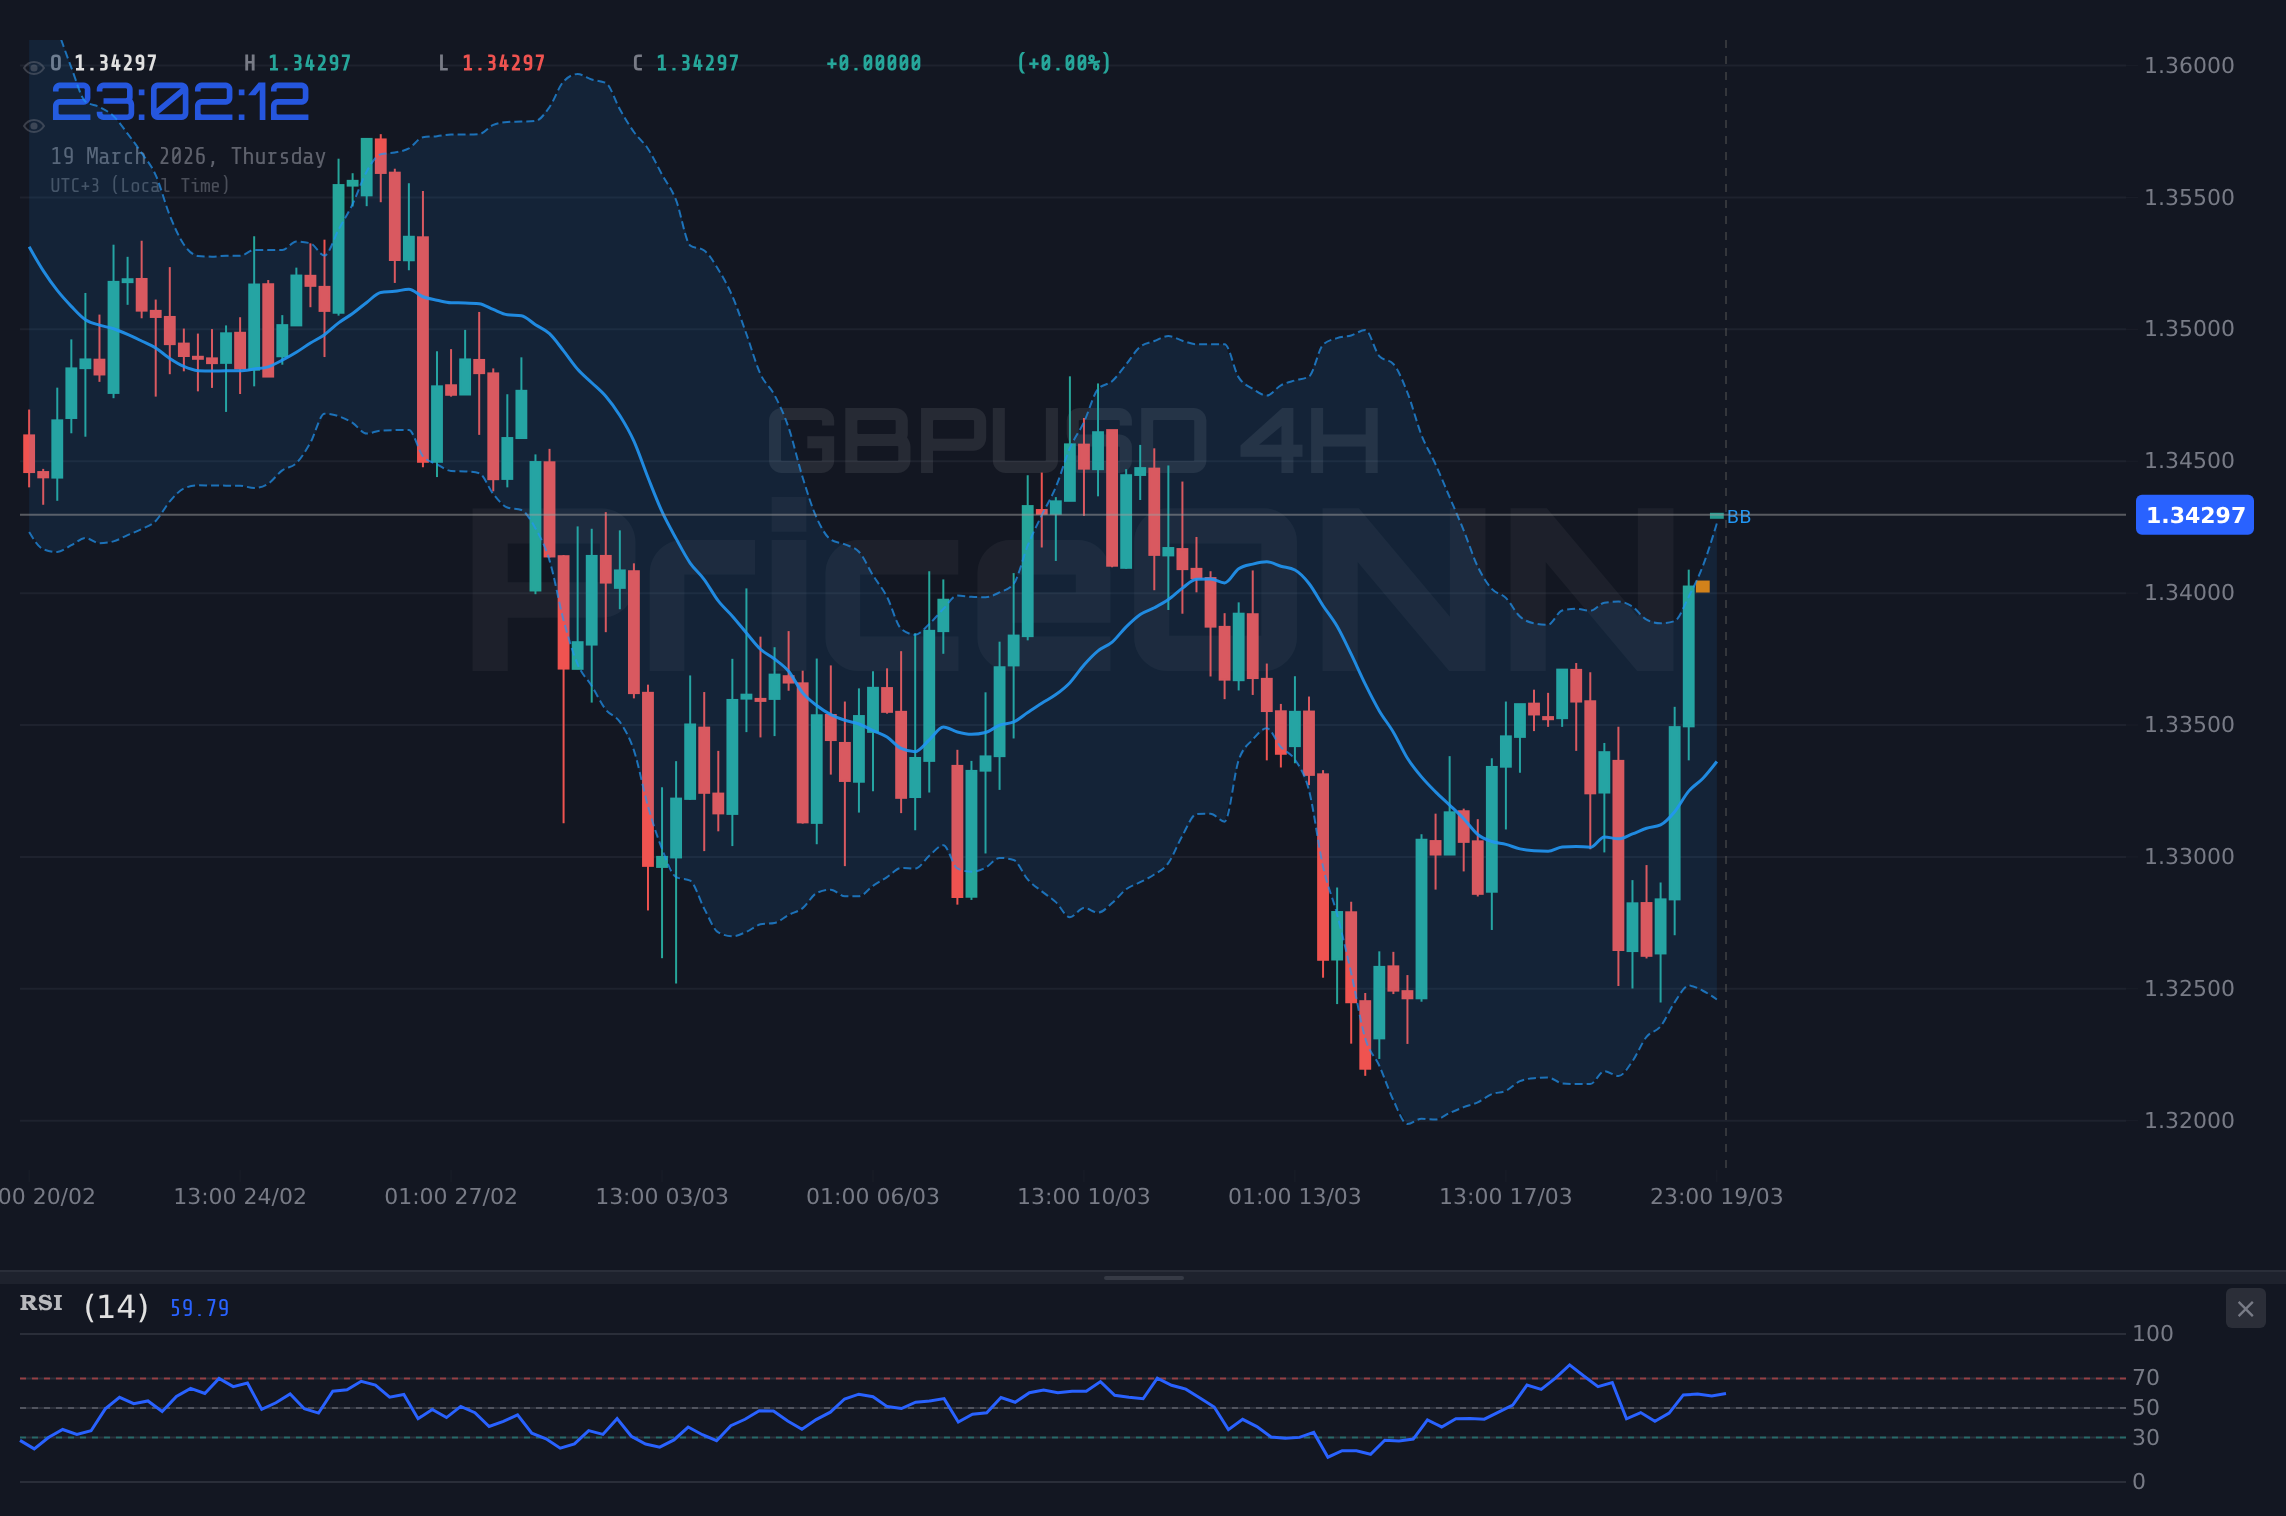
On the surface, the technical indicators on the 1-hour chart might offer a glimmer of hope for the bulls. With the Relative Strength Index (RSI) at 39.72, the pair is moving out of oversold territory on shorter timeframes, though it still suggests a bearish lean. More optimistically, the Stochastic oscillator is showing a bullish signal with its %K line (37.63) crossing above its %D line (24.72) in the 1-hour timeframe, suggesting that a short-term bounce could be on the cards. The MACD, while still showing negative momentum, is hovering just below its signal line, hinting at a potential shift if buying pressure intensifies. Furthermore, the 4-hour chart's ADX at 18.98 indicates a weak trend, which could mean that the current downward move might lack conviction and be susceptible to a reversal, especially if key economic data from the UK surprises to the upside.
Fundamentally, the narrative for a potential GBPUSD rebound hinges on the Bank of England (BoE) adopting a more hawkish stance than anticipated. While the market is largely pricing in a steady interest rate, any hint of a delayed rate cut or even a surprise hike could inject significant strength into the British Pound. Traders will be scrutinizing every word from BoE officials for clues about future monetary policy. Moreover, a stronger-than-expected UK GDP or employment figures could also provide the necessary catalyst for a bullish reversal. The market is currently priced for a certain outcome; any deviation from that expectation could trigger a sharp repricing. The recent news that the Swiss National Bank (SNB) held rates steady, while not directly impacting GBPUSD, shows a trend of central banks prioritizing stability, a theme the BoE might echo, potentially bolstering Sterling if inflation remains sticky.
Historically, significant drawdowns in GBPUSD have often been followed by sharp, albeit sometimes short-lived, recoveries. The current price action, testing the 1.34014 support, presents a classic risk/reward scenario for contrarian buyers. If this level holds firm, similar to how previous support zones have acted as inflection points, we could see a test of the 1.34267 resistance. The key is confirmation: a sustained move above this immediate resistance, coupled with increasing volume and a shift in momentum indicators, would be the signal bulls are waiting for. The fact that the 1-day RSI is at 45.61, while leaning bearish, is not yet in deeply oversold territory, leaving room for price appreciation before overbought conditions emerge.
The Bearish Case: Dollar Dominance and Economic Headwinds
However, the bears have a compelling argument, primarily driven by the persistent strength of the US Dollar. The Dollar Index (DXY) is currently trading around 99.00, with its 1-day trend showing a strong 97% upward bias. This broad dollar strength inherently puts downward pressure on pairs like GBPUSD. The 1-day timeframe for GBPUSD itself shows a strong 95% downward trend. Technical indicators on the daily chart paint a grim picture for Sterling, with the RSI at 45.61 and MACD showing negative momentum below its signal line. The Bollinger Bands on the daily chart are also indicating a bearish trend, with the price trading below the middle band, suggesting further downside potential. The ADX on the daily chart is at 37.45, confirming a strong downtrend is in play.
Economically, the outlook for the UK appears more challenging than for the US. Inflation concerns continue to linger, and the Bank of England faces a delicate balancing act between controlling price pressures and supporting economic growth. Recent news regarding Europe's economy heading towards stagflation due to war-related disruptions serves as a stark warning. While this isn't directly about the UK, it highlights the vulnerability of major economies to geopolitical shocks and energy price volatility, which could spill over. The Federal Reserve, on the other hand, appears more resolute in its stance against premature rate cuts, as indicated by recent market sentiment suggesting a lower probability of cuts in 2026. This divergence in central bank policy outlooks, with the Fed likely maintaining higher rates for longer than the BoE, favors the US Dollar.
On the technical front, the 4-hour chart reinforces the bearish narrative. The trend is decidedly downward (89% strength), and while the RSI at 60.4 is in neutral territory, it's within a downtrend. The MACD is positive but showing signs of weakening momentum. Crucially, the daily chart presents a strong bearish picture, with the ADX at 30.82 indicating a strong downtrend. The immediate resistance at 1.34267 is a significant hurdle. A failure to decisively break above this level, especially with the broader dollar strength and UK economic headwinds, makes a move towards the 1.33806 support level, and potentially lower, a more probable scenario. The $1.34 level, while a psychological point, is currently sandwiched between strong bearish indicators on longer timeframes.
The Verdict: Bears Have the Upper Hand, But Watch for BoE Signals
Weighing the bullish and bearish arguments, the bears currently hold a more convincing position, primarily due to the confluence of dollar strength and a potentially more challenging economic outlook for the UK compared to the US. The 1-day and 4-hour technicals lean bearish, with strong downtrend indicators like ADX and RSI readings that, while not deeply oversold, suggest room for further decline before a significant bounce. The DXY's upward trajectory is a significant headwind for GBPUSD. The key support at 1.34014 is under intense pressure, and a break below it could accelerate selling towards 1.33806.
However, the market is rarely one-sided, and the bulls are not without hope. The 1-hour chart does show some nascent signs of a potential bounce, and any dovish surprise from the Bank of England or significantly positive UK economic data could quickly shift the sentiment. The $1.34 psychological level is a critical juncture; its defense is paramount for any bullish recovery. Traders should remain vigilant for confirmation signals: a sustained move above 1.34267, coupled with bullish divergences on longer-term charts and a weakening DXY, would be needed to invalidate the bearish thesis. Until then, the path of least resistance appears to be to the downside, with the 1.33806 level as the next logical target if 1.34014 fails.
Geopolitical tensions and unexpected economic data releases can cause rapid and significant price swings. Always employ strict risk management, including stop-loss orders, and never risk more than you can afford to lose. The $1.34 level is a key battleground, and a break could lead to accelerated moves.
Looking ahead, the economic calendar is packed with crucial events that will likely dictate the next significant move. The upcoming UK GDP and employment figures will be closely watched for signs of economic resilience or weakness. Simultaneously, US Non-Farm Payrolls (NFP) data and any further commentary from Federal Reserve officials regarding interest rates will heavily influence the DXY and, consequently, GBPUSD. The divergence between the Fed's hawkish bias and the BoE's more cautious approach remains a key theme. Traders must remain agile, prepared to adjust their positions based on incoming data and central bank communications. The $1.34 level is more than just a price; it represents the current equilibrium point in a market grappling with conflicting economic signals and geopolitical uncertainty.
The $1.34309 price point for GBPUSD signifies a critical juncture where the short-term bullish signals on the 1-hour chart clash with the dominant bearish trends on the daily and 4-hour timeframes. While a minor bounce from current levels is plausible, the overarching macroeconomic environment, characterized by dollar strength and UK economic uncertainties, suggests that any upward movements might be met with selling pressure. The bears are likely to defend resistance levels such as 1.34267 and 1.34353. Should these levels hold, the focus will shift back to the support structure, with 1.34014 and 1.33806 being the next areas of interest for potential downside continuation. Vigilance around the $1.34 psychological mark is essential, as a decisive break either above key resistance or below critical support will likely trigger a more pronounced trend.
For those looking to trade this volatility, consider the 1-hour Stochastic (K:37.63, D:24.72) for short-term reversal signals, but always confirm with the broader trend on the daily chart. A break of 1.34014 on the daily chart, supported by a strong DXY, would be a high-probability signal for bearish continuation.
The current market sentiment, as reflected by the technical indicators, suggests caution. The strong ADX readings on longer timeframes indicate a firmly established trend, whether bullish or bearish. While the 1-hour chart offers some potential for a counter-trend bounce, the dominant narrative is one of dollar strength and potential UK economic headwinds. Therefore, any bullish trades should be approached with tight stop-losses, ideally below the 1.34014 support. Conversely, a break below this level could present a more compelling bearish opportunity, targeting 1.33806 and potentially lower. The $1.34 level is a critical psychological and technical point that will likely see significant action in the coming sessions.
Frequently Asked Questions: GBPUSD Analysis
What happens if GBPUSD breaks below $1.34014 support?
A break below the 1.34014 support level on GBPUSD would likely trigger further selling pressure, targeting the next key support at 1.33806. This scenario is supported by the strong bearish trend indicated by the daily ADX (37.45) and a persistent DXY strength.
Should I buy GBPUSD at current levels near $1.34309 given the 1-hour Stochastic signal?
Buying solely based on the 1-hour Stochastic (K:37.63, D:24.72) signal near $1.34309 carries significant risk due to the dominant bearish trend on longer timeframes. A more prudent approach would be to wait for confirmation, such as a sustained break above 1.34267 resistance, and a shift in daily indicators.
Is the RSI at 39.72 a sell signal for GBPUSD right now?
An RSI of 39.72 on the 1-hour chart indicates bearish momentum but is not yet in oversold territory. While it suggests selling pressure, it doesn't independently signal a definitive sell. This reading should be considered alongside other indicators and the broader trend, which on the daily chart is strongly bearish (ADX: 37.45).
How will upcoming UK GDP data affect GBPUSD this week?
Stronger-than-expected UK GDP data could act as a catalyst for a GBPUSD rebound, potentially pushing the price towards resistance levels like 1.34267. Conversely, weaker data would exacerbate the bearish trend, increasing the likelihood of a break below 1.34014.
Track markets in real-time
AI-powered analysis, technical indicators and real-time price data.
Join Our Telegram Channel
Breaking market news, AI analysis and trading signals instantly.
Join Channel