XAUUSD Tests $4,744 Support Amid Dollar Surge and Oil Shock
Gold (XAUUSD) tumbles to $4,712.60 as the US Dollar Index (DXY) rallies above 100.00, with Brent crude prices also spiking.
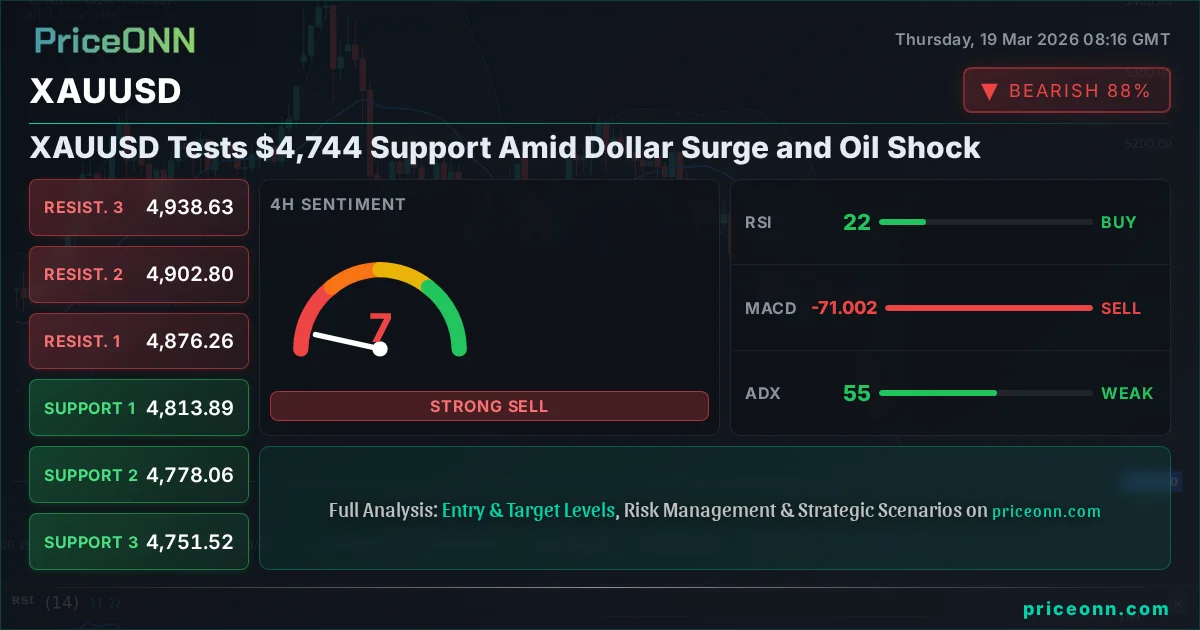
As the global financial stage braces for shifting economic winds, gold, or XAUUSD, is currently testing critical support levels around the $4,744 mark. This sharp downturn comes as the US Dollar Index (DXY) surges past 100.00, fueled by a hawkish stance from the Federal Reserve and a significant geopolitical shock that has sent crude oil prices rocketing past $110. The interplay of these factors presents a complex picture for investors seeking safe-haven assets and navigating inflationary pressures.
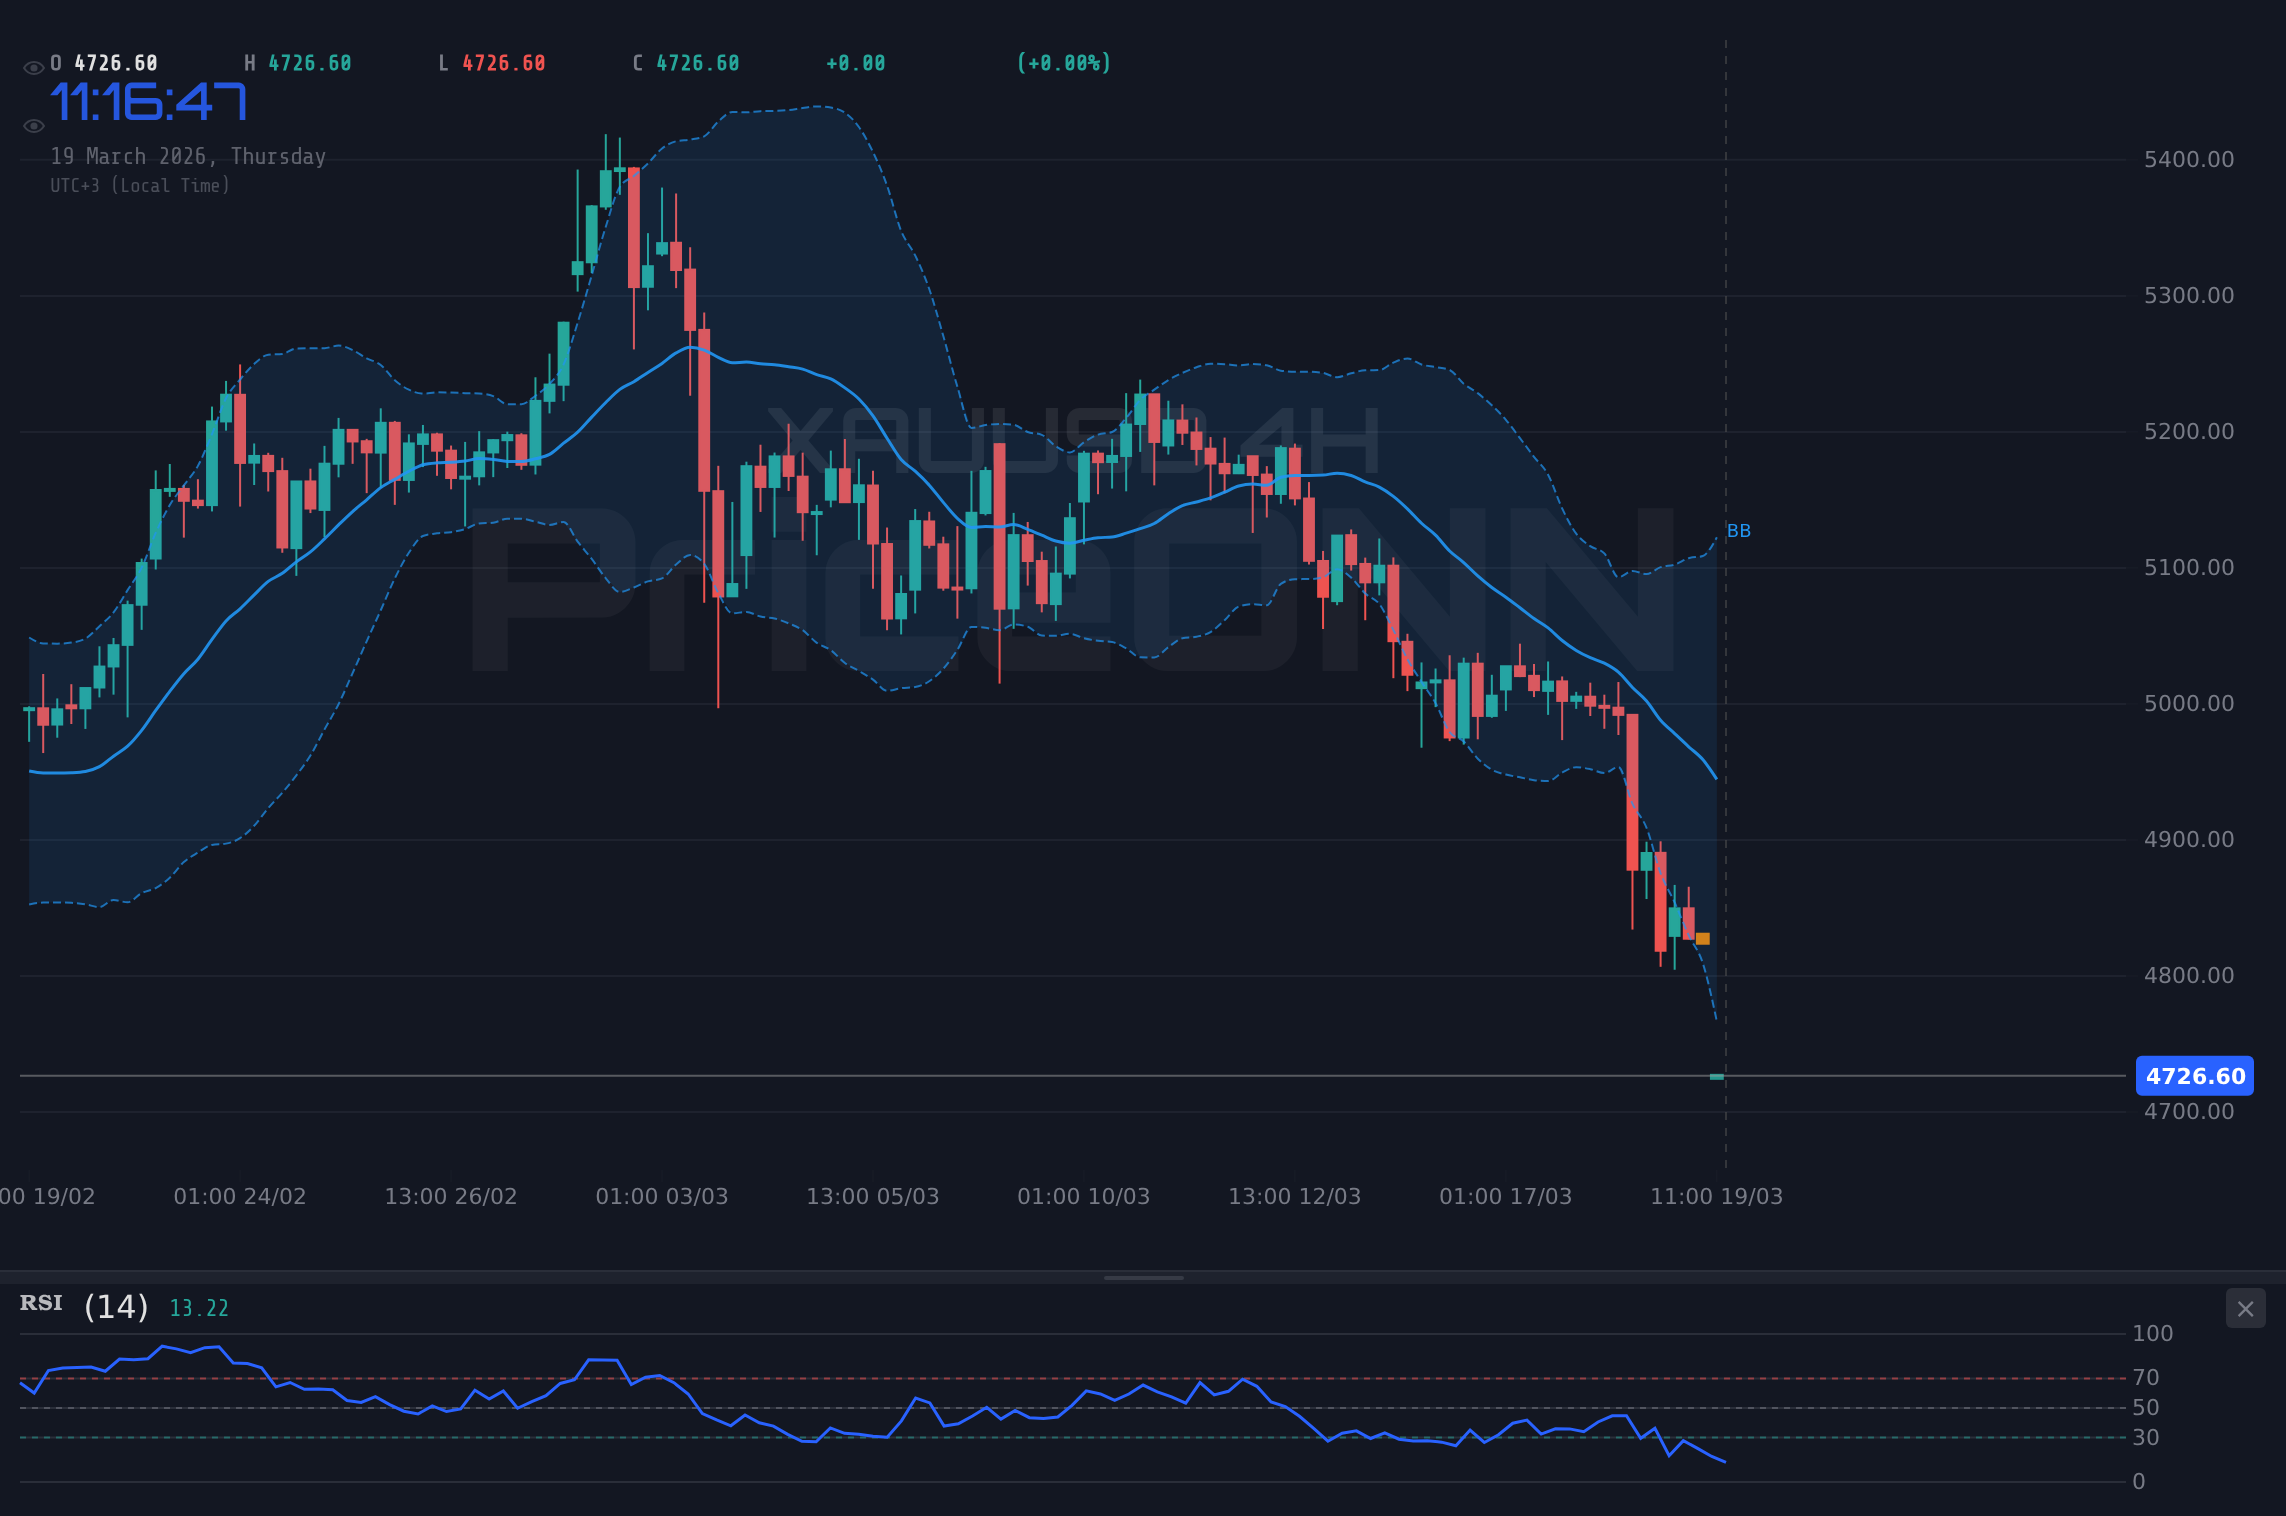
- XAUUSD is trading at $4,712.60, down 2.2% today, with RSI(14) at 16.87 on the 1H chart indicating extreme oversold conditions.
- The US Dollar Index (DXY) is above 100.05, showing strong upward momentum with RSI at 73.86, suggesting potential for further gains.
- Brent crude prices surged to $113.73, a 3.71% daily increase, driven by escalating Middle East tensions, which typically fuels inflation fears and safe-haven demand for gold.
- Key support for XAUUSD is identified at $4,726.9, with immediate resistance at $4,821.04; a break below $4,708.17 could signal further downside.
- The Federal Reserve's hawkish pause on interest rates, coupled with hotter-than-expected US PPI data, is reinforcing inflation concerns and supporting the dollar's strength.
The dramatic fall in gold prices to $4,712.60 is not occurring in a vacuum. It's a direct consequence of a potent cocktail of market forces. The Federal Reserve's recent policy meeting, characterized by a 'hawkish pause,' has signaled fewer rate cuts than previously anticipated for 2026. This stance bolsters the dollar, making it a more attractive investment and simultaneously increasing the opportunity cost of holding non-yielding assets like gold. The US Dollar Index (DXY) has responded by climbing decisively above the 100-point psychological level, currently trading at 100.05. This strength in the dollar inherently puts downward pressure on dollar-denominated commodities, including gold.
Adding to the complexity, crude oil prices have experienced a significant surge, with Brent crude reaching $113.73. This spike is largely attributed to escalating geopolitical tensions in the Middle East, a region critical for global energy supply. Such a sharp rise in oil prices typically ignites inflation concerns, as energy costs are a primary driver of consumer and industrial prices. Historically, rising inflation can be a tailwind for gold, as it's often seen as a hedge against currency debasement. However, in the current environment, the dollar's strength appears to be the dominant factor, overshadowing gold's traditional inflation-hedging role.
The Dollar's Dominance and Gold's Vulnerability
The current market narrative is heavily influenced by the US dollar's resurgence. With the DXY trading at 100.05, reflecting strength against a basket of major currencies, the greenback is demonstrating robust momentum. On the 1-hour timeframe, the DXY shows a strong uptrend (94% strength) with RSI at 73.86, firmly in overbought territory but indicating sustained buying pressure. This dollar strength makes it more expensive for holders of other currencies to purchase dollar-denominated assets, including gold. The immediate support for XAUUSD is observed at $4,726.9, while resistance looms at $4,821.04. A break below the daily low of $4,708.17 could signal a deeper correction, pushing prices towards the $4,690.27 support level.
The technical indicators for XAUUSD paint a grim short-term picture. On the 1-hour chart, the RSI(14) is at a mere 16.87, deep within the oversold territory. While this might suggest a potential for a short-term bounce, the ADX at 48.77 indicates a very strong downward trend, implying that any oversold conditions could persist. The MACD is negative and below its signal line, reinforcing the bearish momentum. Similarly, on the 4-hour chart, the RSI is at 20.98, and the ADX is an even stronger 54.93, signaling a very powerful downtrend. Stochastic oscillators on both timeframes show %K below %D, confirming the bearish bias. Even on the daily timeframe, where the trend is rated as neutral (50% strength), the RSI at 35.5 and a weak ADX of 16.29 suggest a lack of immediate buying conviction, despite the oversold readings.
Geopolitical Shocks and Inflationary Fears
The surge in Brent crude prices to $113.73, a significant 3.71% increase on the day, is a critical development. This price action is directly linked to escalating geopolitical tensions in the Middle East, a region that significantly influences global oil supply. When oil prices spike like this, it has a ripple effect across the economy. It directly impacts transportation costs, manufacturing, and ultimately consumer prices, stoking inflation fears. The US Producer Price Index (PPI) data, which came in hotter than expected, further validates these inflation concerns. Normally, such an environment would be a strong catalyst for gold as a traditional inflation hedge. However, the current market dynamics show the dollar's strength taking precedence.
The correlation between oil prices, inflation expectations, and gold is usually quite strong. A sharp rise in oil, like the one we are witnessing, often leads to increased demand for gold as investors seek to protect their purchasing power against rising inflation. Yet, the current data suggests a divergence. While oil is soaring, pushing inflation concerns to the forefront, gold is falling. This is primarily because the Federal Reserve's commitment to fighting inflation, even at the cost of slower economic growth or higher rates for longer, is making the dollar the preferred safe-haven currency. The market is pricing in a scenario where the Fed might be more concerned about inflation than a potential economic slowdown, thus prioritizing dollar strength.
Technical Breakdown: XAUUSD's Plunge
Delving deeper into the technicals, XAUUSD's price action is concerning for bulls. The 1-hour chart shows the price trading below the lower Bollinger Band, a sign of extreme bearish pressure. The ADX at 48.77 confirms a strong existing trend, and the MACD continues to generate negative momentum. The overall signal on this timeframe is a strong 'SELL'. Moving to the 4-hour chart, the picture is even more dire, with an ADX of 54.93 indicating a very robust downtrend. The RSI is deeply oversold at 20.98, but in such strong trends, oversold conditions can persist for extended periods. The daily chart offers a glimmer of hope, with a neutral trend strength (ADX 16.29), but the RSI at 35.5 and the overall 'SELL' signal from the majority of indicators suggest that the path of least resistance remains to the downside for now.
The immediate support levels to watch are $4,726.9, followed by $4,690.27. A decisive break below $4,632.76 would signal a significant capitulation. On the resistance side, $4,821.04 is the first hurdle, followed by $4,878.55. Given the prevailing sentiment and the technical indicators, a bounce from the current oversold levels cannot be ruled out, but it would likely be a technical correction rather than a trend reversal unless accompanied by a significant shift in macroeconomic drivers or geopolitical sentiment.
Correlation Analysis: DXY, Oil, and Equities
The relationship between gold, the dollar, and oil is a cornerstone of commodity market analysis. Currently, the DXY's strength at 100.05 is directly weighing on XAUUSD. This inverse correlation is a well-established phenomenon; as the dollar strengthens, gold becomes more expensive for buyers using other currencies, leading to reduced demand. The surge in Brent crude to $113.73, while typically a bullish signal for gold due to inflation expectations, is being counteracted by the dollar's dominance. This divergence highlights the current market's priorities: immediate currency strength and the Fed's inflation fight seem to be outweighing longer-term inflation hedging narratives.
Equity markets are also reflecting this cautious sentiment. The S&P 500 is trading near 6,613.40, and the Nasdaq 100 at 24,364.5, both showing slight declines on the day. While not a sharp selloff, the downward pressure on equities, coupled with the dollar's rise, reinforces the 'risk-off' sentiment that often benefits safe-haven assets. However, the dollar itself is currently acting as the primary safe haven, drawing capital away from traditional havens like gold. This complex interplay suggests that market participants are prioritizing currency stability and the Fed's policy path over immediate inflation hedges, at least for the short term.
Central Bank Watch: The Fed's Shadow
The Federal Reserve's recent monetary policy decision, particularly its 'hawkish pause,' is the linchpin of the current market narrative. By signaling fewer rate cuts than expected for 2026, the Fed is effectively communicating a commitment to keeping monetary policy tighter for longer to combat persistent inflation. This has significant implications for gold. Higher real interest rates increase the attractiveness of interest-bearing assets, making non-yielding gold less appealing. The CME FedWatch tool, if data were available, would likely show increased probabilities for a longer period of unchanged rates. This policy direction directly supports the dollar's strength and puts a lid on gold prices, even amidst rising oil costs and geopolitical uncertainty.
The market's interpretation of the Fed's actions is crucial. The stronger-than-expected US PPI data reinforces the narrative that inflation remains a concern, potentially justifying the Fed's cautious approach. This means that any immediate hope for a dovish pivot from the Fed is likely misplaced, which in turn suggests that the dollar could remain supported, and gold could face continued headwinds. Investors will be closely watching upcoming economic data, particularly employment figures and further inflation reports, to gauge whether the Fed's assessment of inflation risks is accurate and whether their current policy path is sustainable without triggering a sharper economic slowdown.
Looking Ahead: Key Levels and Potential Scenarios
The technical landscape for XAUUSD is currently dominated by bearish signals, but the oversold conditions warrant attention for potential short-term rebounds. The immediate focus remains on the support level at $4,726.9. A failure to hold this level could accelerate the decline towards $4,690.27. Conversely, a sustained move above the $4,821.04 resistance, ideally with increasing volume and confirmation from other indicators, would be needed to signal a potential shift in momentum. However, given the strong dollar and the prevailing 'sell everything' sentiment driven by geopolitical events and Fed policy, such a bullish reversal appears unlikely in the immediate term without a significant change in underlying drivers.
The current market environment is characterized by high volatility and conflicting signals. While rising oil prices and geopolitical risks typically support gold, the overwhelming strength of the US dollar, backed by a hawkish Federal Reserve, is currently dominating price action. This suggests that short-term traders might find opportunities in tactical bounces from oversold levels, but the broader trend remains under pressure. Long-term investors, however, may view this pullback as a potential accumulation phase, especially if inflation concerns continue to mount and real interest rates remain subdued. The key will be to monitor the confluence of these factors and wait for clearer directional signals.
Frequently Asked Questions: XAUUSD Analysis
What happens if XAUUSD breaks below the $4,708.17 support level?
A break below $4,708.17 would likely trigger further selling pressure, potentially accelerating the decline towards the $4,690.27 support level. This would confirm the strong bearish momentum indicated by the ADX at 48.77 on the 1-hour chart.
Should I buy XAUUSD at current levels of $4,712.60 given the oversold RSI?
While the RSI at 16.87 suggests oversold conditions, the prevailing strong downtrend (ADX 54.93 on 4H) means a bounce is not guaranteed and could be short-lived. A confirmation of buying interest, such as a close above $4,744.83 resistance on the daily chart, would be needed for a more reliable entry.
Is the RSI at 16.87 a sell signal for XAUUSD right now?
An RSI of 16.87 is considered deeply oversold, which typically signals a potential reversal or pause in a downtrend. However, in strongly trending markets, oversold conditions can persist. The overall 'SELL' signal across most timeframes indicates caution is warranted, and this RSI reading alone is not a buy signal.
How will the Fed's hawkish pause and oil surge affect XAUUSD this week?
The Fed's hawkish stance is strengthening the dollar, which is currently the dominant factor pressuring XAUUSD lower, despite the oil surge fueling inflation concerns. This suggests that gold may remain under pressure unless the dollar weakens significantly or geopolitical risks escalate dramatically to override Fed policy influence.
Bearish Scenario: Downward Momentum Continues
65% ProbabilityNeutral Scenario: Consolidation and Range-Bound Action
25% ProbabilityBullish Scenario: Short-Term Rebound Potential
10% ProbabilityOutlook: Navigating Volatility
The current market presents a challenging environment for gold. The powerful combination of a strengthening dollar, driven by a hawkish Fed, and escalating geopolitical tensions causing oil price spikes, creates a tug-of-war for market sentiment. While rising oil prices traditionally support gold through inflation fears, the dollar's dominance, amplified by the Fed's commitment to price stability, is currently the more potent force. This dynamic suggests that any short-term gains in gold may be capped unless there is a significant shift in monetary policy expectations or a dramatic escalation of geopolitical risks that fundamentally alters the safe-haven demand calculus.
For traders and investors, patience and disciplined risk management are paramount. The oversold technical conditions on shorter timeframes for XAUUSD suggest that a technical bounce is possible, but the prevailing trend strength indicates that such moves should be treated with caution. The critical support at $4,726.9 needs to hold to prevent further downside acceleration. Conversely, a sustained break above immediate resistance levels, particularly $4,821.04, would be required to signal a potential shift in sentiment. Long-term, the fundamental drivers of central bank demand and persistent inflation concerns remain supportive of gold, but the short-to-medium term outlook is clouded by dollar strength and Fed policy.
| Indicator | Value | Signal | Interpretation |
|---|---|---|---|
| RSI (1H) | 16.87 | Oversold | Extreme sell-off, potential bounce |
| MACD (1H) | Negative | Bearish Momentum | Sellers in control |
| ADX (4H) | 54.93 | Strong Trend | Very strong downtrend |
| Stochastic (1H) | K=16.59, D=44.72 | Bearish Crossover | Confirms downtrend |
| Bollinger Bands (1H) | Below Lower Band | Breakdown | Extreme bearish pressure |
Track markets in real-time
AI-powered analysis, technical indicators and real-time price data.
Join Our Telegram Channel
Breaking market news, AI analysis and trading signals instantly.
Join Channel