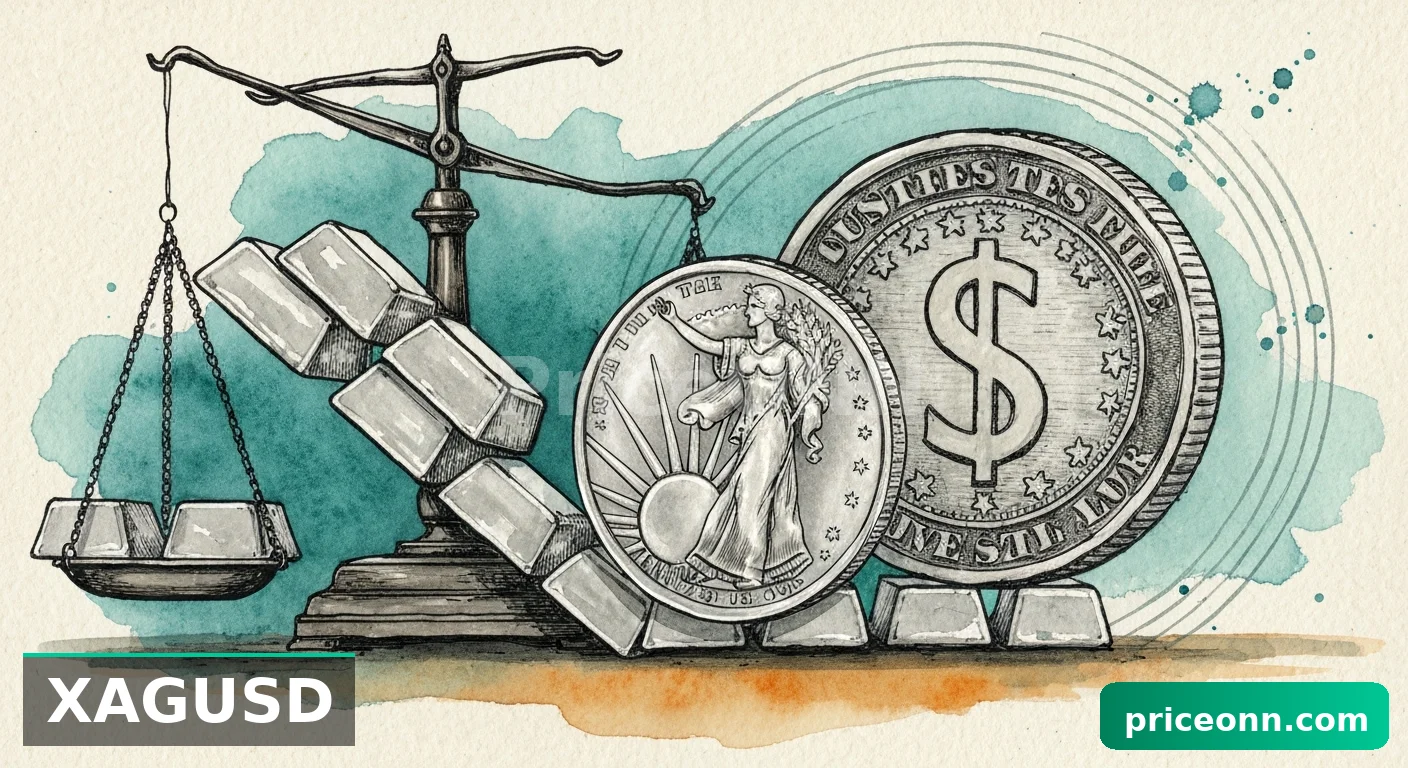
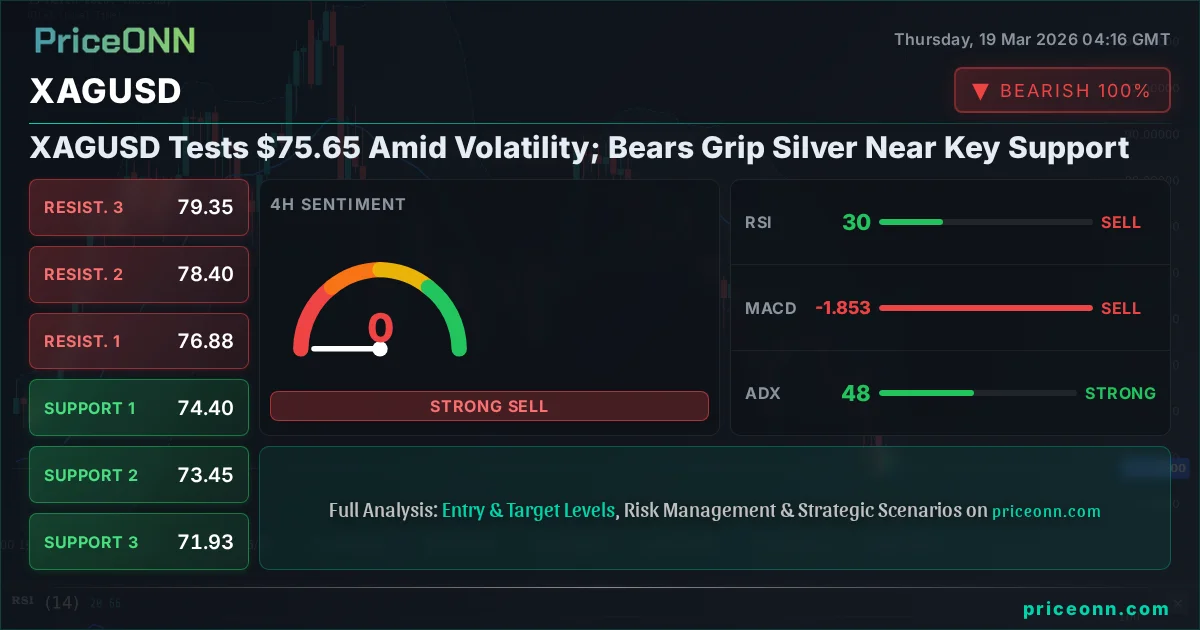
XAGUSD Tests $75.65 Amid Volatility; Bears Grip Silver Near Key Support
Silver (XAGUSD) trades at $75.65. Bears are applying pressure as key support levels are tested, with RSI at 35.23 signaling potential downside.
The relentless tug-of-war in the silver market continues, with XAGUSD currently hovering precariously around the $75.65 mark. We've seen significant volatility recently, and the bears appear to be gaining a firmer grip as we approach critical support levels. This isn't just about price action; it's about understanding the underlying currents - from global economic shifts to market sentiment - that are dictating silver's path right now. Having tracked XAGUSD through periods of sharp gains and painful declines, I can tell you that the current technical setup demands close attention, especially with multiple indicators flashing cautionary signals.
- XAGUSD is currently trading at $75.65, with bears testing key support levels.
- The 1-hour RSI is at 35.23, indicating a bearish trend, while the 4-hour RSI sits at 30.67, nearing oversold territory.
- Strong downward trend signals are evident across multiple timeframes, with ADX readings above 35.
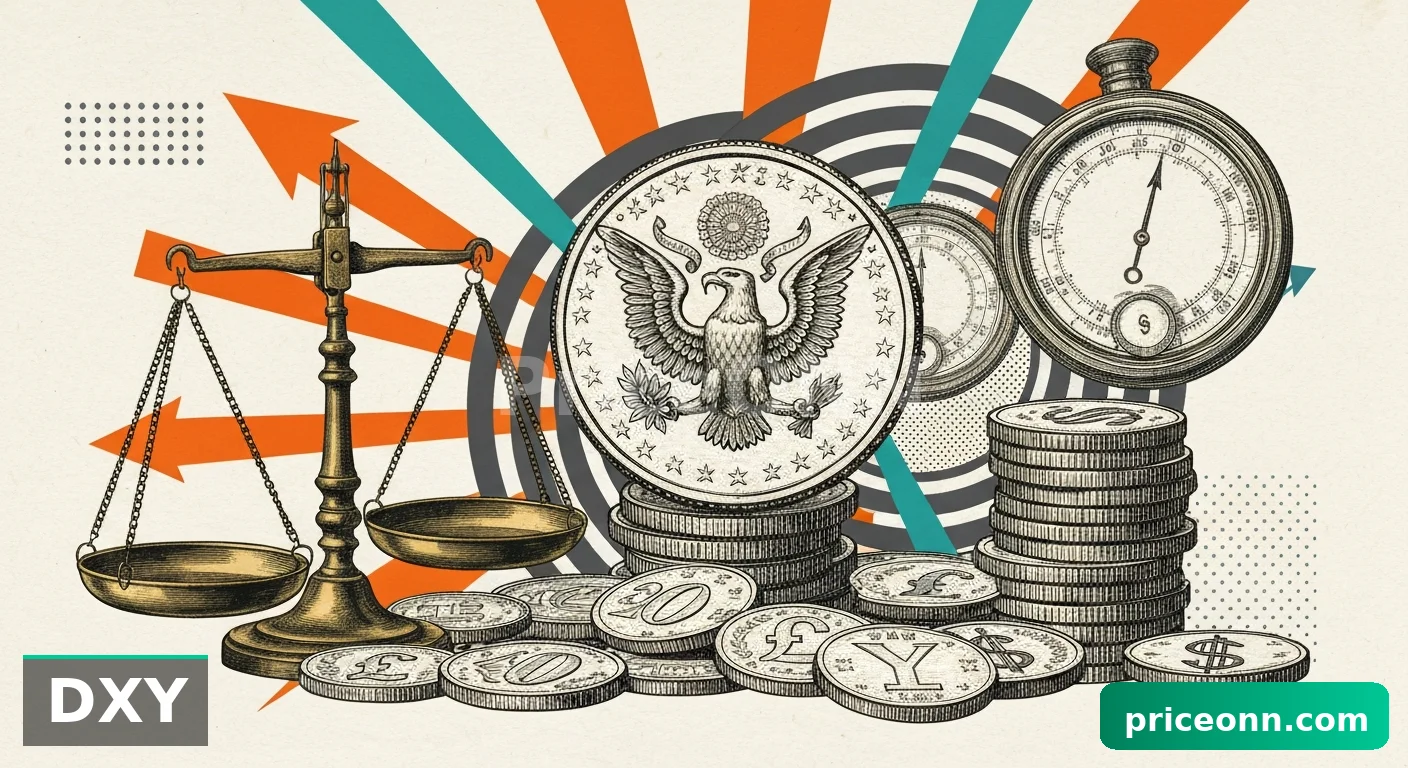
- The US Dollar Index (DXY) at 99.93 shows strength, potentially pressuring precious metals like silver.
Navigating the Bearish Crosscurrents: What the Indicators Are Saying
Let's dive straight into the charts. On the 1-hour timeframe, the trend is decidedly bearish, with an ADX reading of 35.93 underscoring the strength of this downward move. The RSI at 35.23, while not yet in oversold territory, certainly indicates a bearish leaning. The MACD, though showing positive momentum on this short timeframe, is struggling against the prevailing trend. Bollinger Bands are also signaling a bearish inclination, with price action below the middle band.
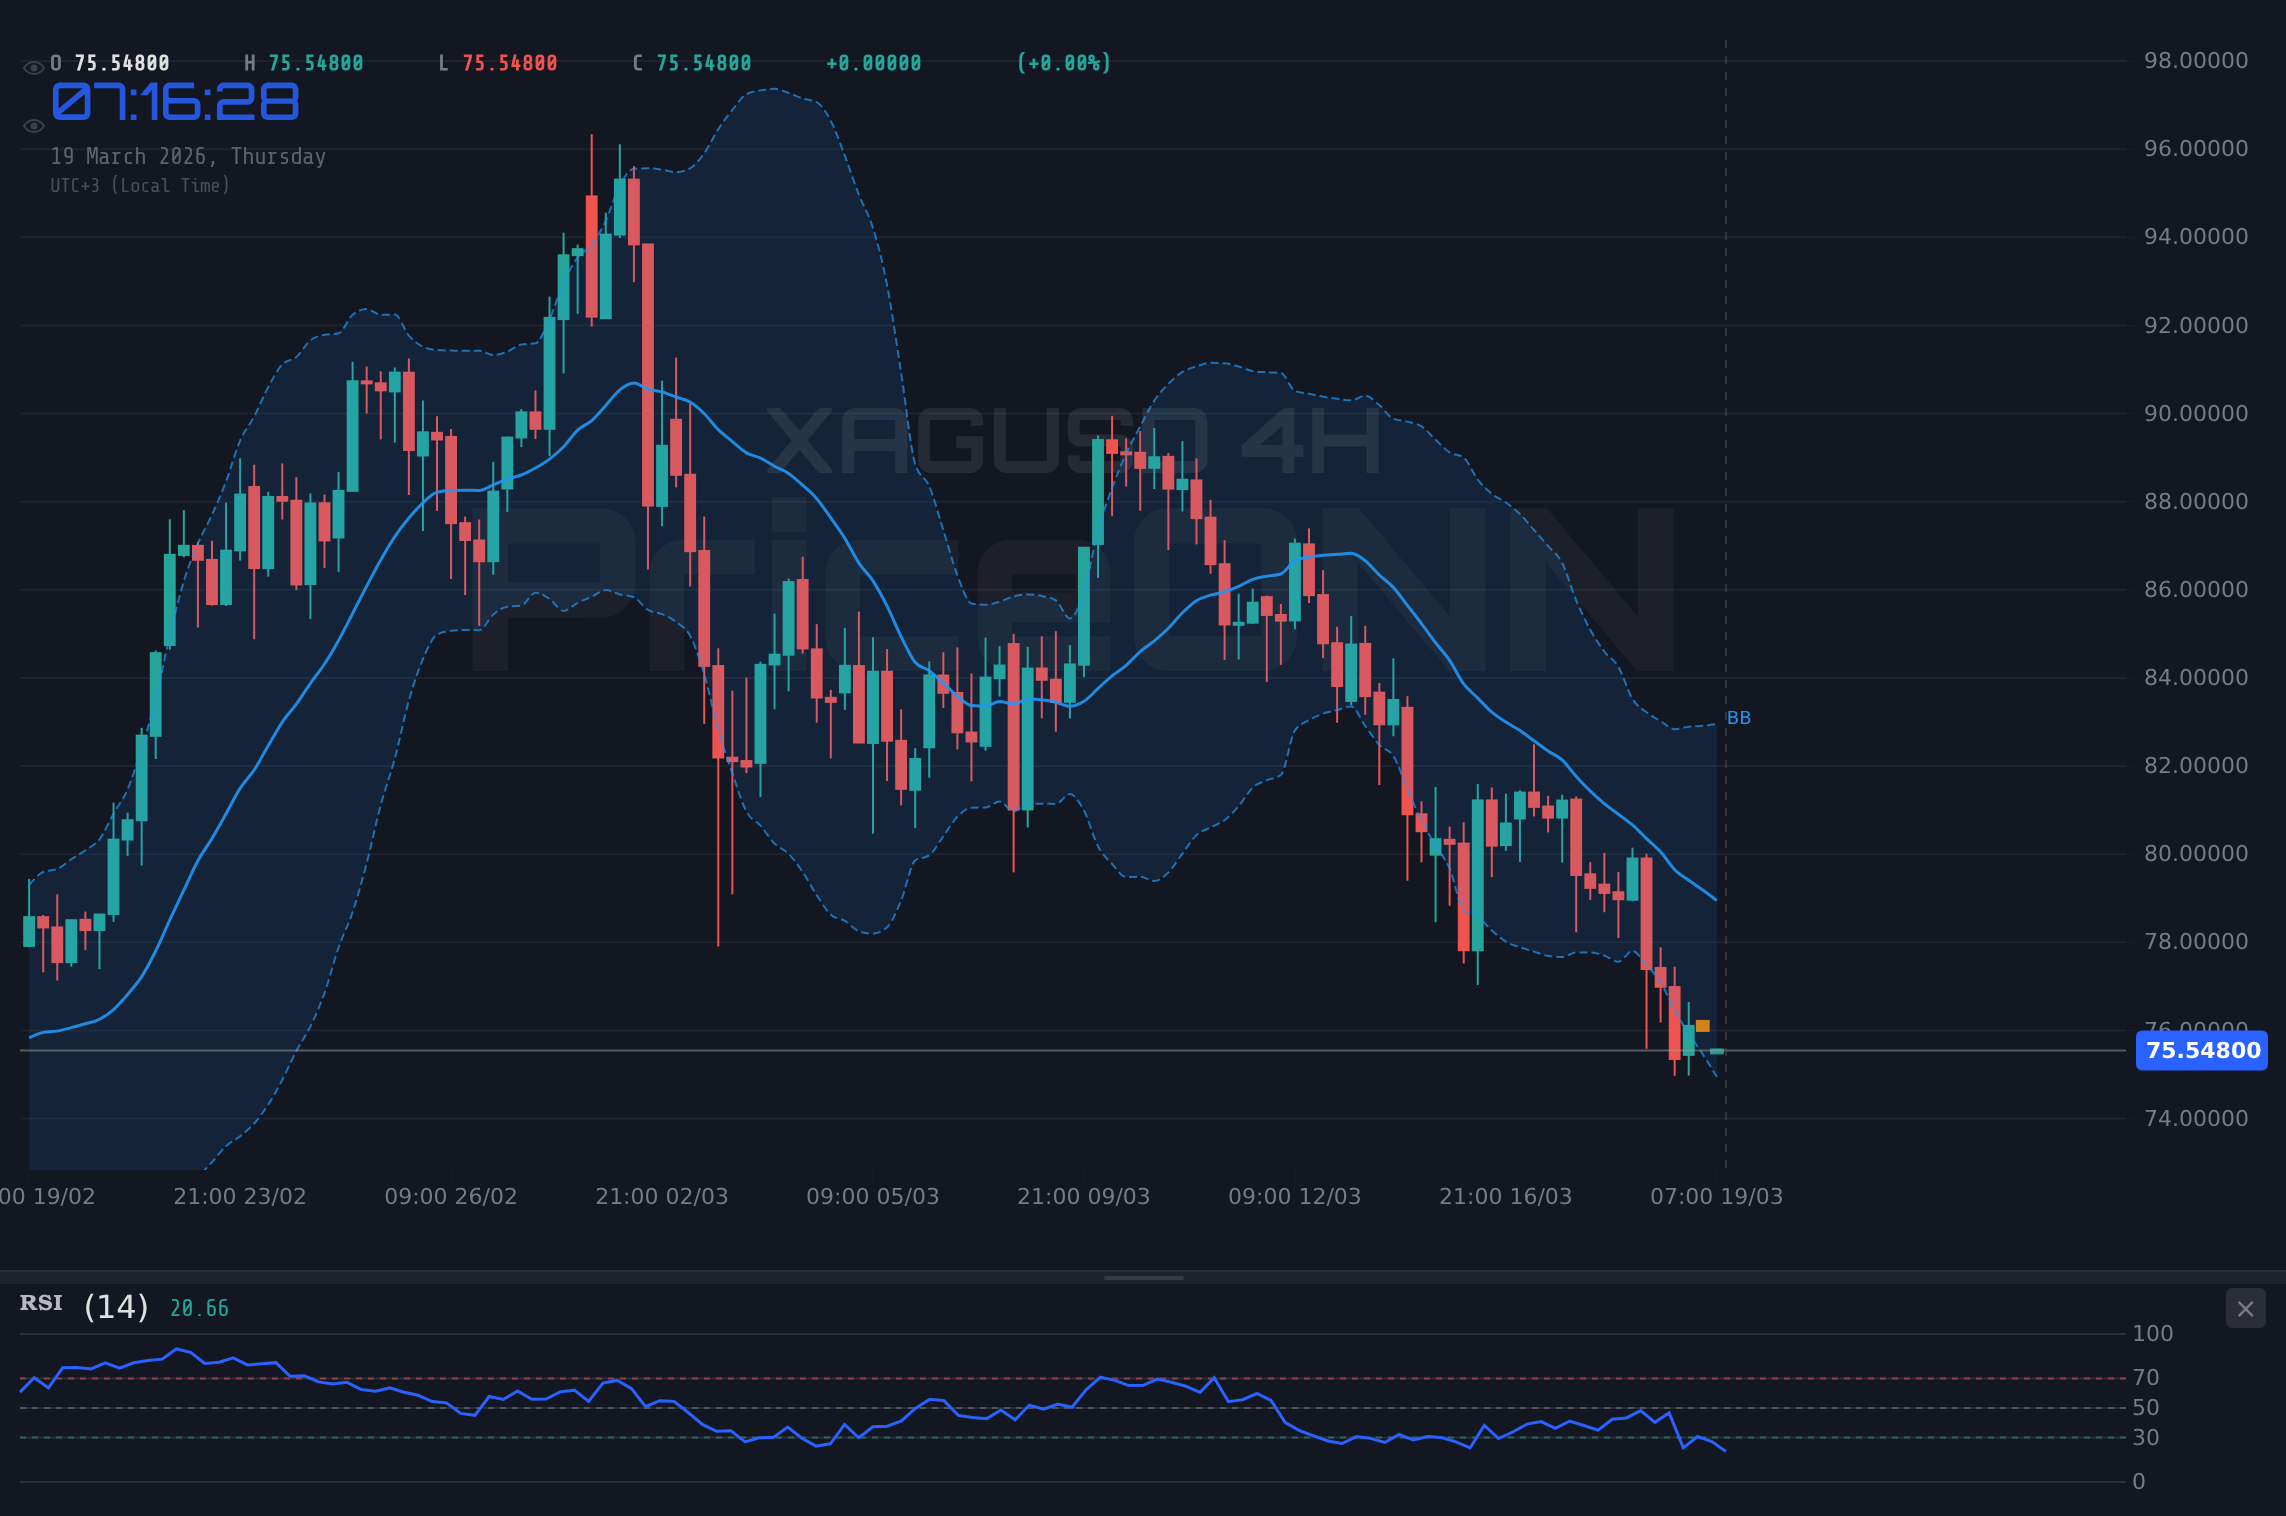
However, when we zoom out to the 4-hour chart, the picture becomes even starker. The trend is overwhelmingly bearish (99% strength), and the ADX has climbed to a formidable 52.97 - this is a very strong trend. The RSI here plunges to 29.39, firmly in oversold territory. This divergence between the strong bearish trend and the oversold RSI presents a classic dilemma for traders: Is this a sign of capitulation, or simply a deeper dip before further declines? The Stochastic indicator also shows a bearish signal (%K < %D), reinforcing the downside pressure. The overall signal across this timeframe is a strong 'SELL' (7 out of 8 indicators). This is exactly where you need to pay attention; the market is screaming caution.
Even looking at the daily chart, the bearish sentiment persists, although the trend strength moderates to 50% and the ADX drops to 15.81, suggesting a weakening trend or a potential consolidation phase. The RSI is at 40.5, still in neutral territory but trending down, and the MACD remains negative. The Stochastic is deep in oversold territory (K=8.04, D=17.17), hinting at a potential bounce, but the overall signal remains 'SELL' (6 out of 8). This multi-timeframe analysis paints a consistent picture: the path of least resistance for XAGUSD currently appears to be downwards, despite the oversold conditions appearing on longer timeframes.
The Dollar's Shadow: How DXY Impacts Silver's Trajectory
We cannot discuss precious metals without acknowledging the mighty US Dollar Index (DXY). Currently trading around 99.93, the DXY is showing signs of strength, particularly on the 1-hour and 4-hour charts, with strong ADX readings indicating a robust uptrend. This strength in the dollar acts as a significant headwind for commodities priced in dollars, including silver. When the dollar strengthens, it takes fewer dollars to buy the same amount of silver, making it relatively more expensive for holders of other currencies. This dynamic often leads to decreased demand and, consequently, downward pressure on prices.
The DXY's current upward momentum, supported by positive MACD and RSI readings above 60 on the 1-hour and 4-hour charts, suggests that this dollar strength could persist in the short term. While the daily chart shows a slight pullback in Stochastic, the overall trend remains bullish. This correlation is crucial. If the DXY continues to climb, it will likely exacerbate the selling pressure on XAGUSD. Traders watching silver must also keep a close eye on the dollar; they are often two sides of the same coin, especially in times of economic uncertainty. The fact that the DXY is showing strong uptrend signals on multiple timeframes while XAGUSD shows predominantly sell signals highlights this inverse relationship.
Macroeconomic Undercurrents: Inflation, Interest Rates, and Silver's Dilemma
The fundamental drivers behind silver's price action are complex, but the overarching themes remain inflation and interest rate expectations. Recent economic data, like the hot US PPI numbers released yesterday, have injected a dose of volatility into the markets. Higher-than-expected Producer Price Index data can signal persistent inflation, which traditionally benefits gold and silver as inflation hedges. However, this same data can also prompt central banks, like the Federal Reserve, to maintain a hawkish stance or delay interest rate cuts, which can strengthen the dollar and dampen demand for non-yielding assets like precious metals.
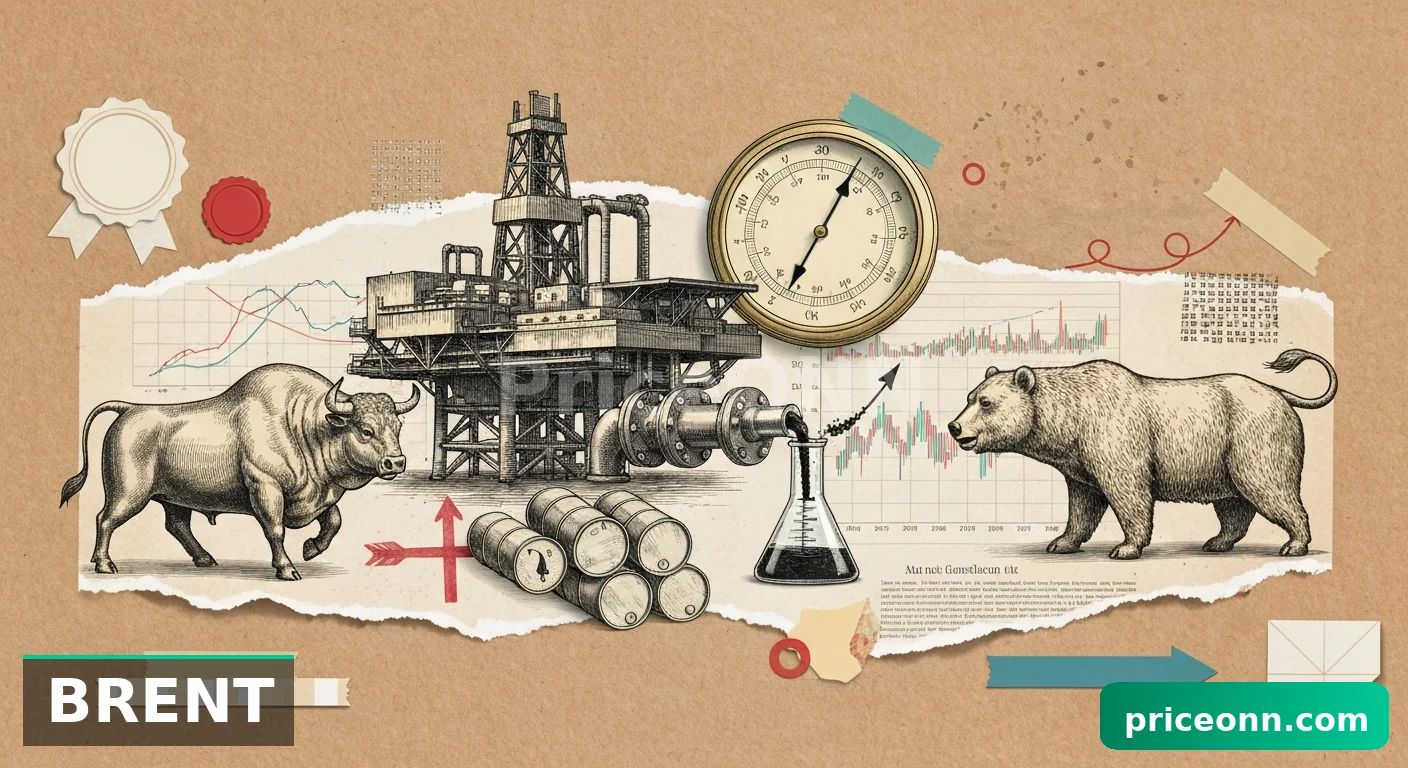
The Federal Reserve's upcoming policy decision is a major event on the horizon. While markets have been pricing in potential rate cuts, persistent inflation data might force the Fed to hold rates steady or signal fewer cuts than anticipated. This uncertainty creates a challenging environment for silver. On one hand, inflation fears could drive safe-haven demand. On the other hand, high interest rates make holding non-yielding assets less attractive compared to fixed-income investments. The market is currently grappling with this duality; the immediate reaction to PPI was a surge in oil prices, but the broader market sentiment, influenced by Fed uncertainty, is keeping a lid on silver's upside potential. We need to see clear direction from the Fed before silver can establish a firm trend. The recent news about oil prices surging past $108 for Brent, while WTI lagged, also points to geopolitical tensions impacting energy markets, which can feed into inflation concerns.
Geopolitical Tensions: A Double-Edged Sword for Silver
Geopolitical instability is another significant factor influencing silver prices. Ongoing tensions in the Middle East, as highlighted by recent news, can increase demand for safe-haven assets. Historically, periods of heightened geopolitical risk have seen silver prices rise as investors seek refuge from uncertainty. The surge in oil prices, partly attributed to these tensions, also fuels inflation expectations, which, as mentioned, can be a tailwind for precious metals.
However, the situation is nuanced. While geopolitical risks can boost silver's appeal as a safe haven, they can also lead to broader market selloffs and a flight to the perceived safety of the US dollar. This is where the correlation with DXY becomes paramount. If geopolitical events trigger a significant risk-off sentiment, investors might flock to the dollar rather than silver, creating a complex interplay of forces. The recent news indicating that Saudi Aramco restarted its Ras Tanura refinery, while geopolitical tensions simmer, adds another layer of complexity to the energy market, which in turn affects inflation and, by extension, silver. We need to watch how these geopolitical events unfold and how the market interprets them in the context of inflation and central bank policy.
The Volatility Conundrum: Reading Between the Lines
The current market environment for XAGUSD is characterized by significant volatility. We've seen sharp price swings, often driven by conflicting economic data and geopolitical headlines. This makes it challenging for traders to establish clear positions. The data shows that on the 1-hour chart, the ADX is at 35.93, indicating a strong trend, yet the daily ADX is a much weaker 15.81. This suggests that while short-term moves might be strong, the longer-term trend is less committed, or perhaps consolidating. This is the kind of environment where stop hunts can occur, as the market tries to shake out weaker hands before making its next significant move.
The RSI readings also present a puzzle. On the 1-hour, it's at 35.23, leaning bearish. On the 4-hour, it's 29.39, oversold. On the daily, it's 40.5, neutral but trending down. This mixed signal implies that while short-term momentum is down, there's potential for a bounce from oversold conditions on the 4-hour chart. However, the dominant bearish signals from the ADX and overall trend strength across multiple timeframes cannot be ignored. This is not a time for aggressive bets; it's a time for patience and precise risk management. We need to see a clear confirmation, perhaps a decisive break above a key resistance level or a sustained move away from oversold conditions, before considering a directional bias.
Expert Take: What the Current XAGUSD Price Action Means for Traders
From a trader's perspective, the current situation around $75.65 for XAGUSD presents a complex risk-reward profile. The strong bearish signals on the 1-hour and 4-hour charts, coupled with the strength of the DXY, suggest that further downside is possible. The support levels at $75.03, $74.40, and $73.50 are the immediate areas to watch. A break below $75.03 on the 1-hour chart could accelerate selling towards $74.40. However, the oversold RSI on the 4-hour chart (29.39) hints at a potential short-term bounce. This means that while betting on a significant rally right now would be premature, looking for short-covering opportunities or a consolidation phase might be more prudent.
The key is to avoid chasing the price. If silver breaks below $75.03, don't jump in to sell immediately; wait for confirmation, perhaps a retest of that level as resistance. Conversely, if it bounces, don't chase the upside without seeing a clear break of resistance, like the $76.77 level on the 1-hour chart. The ADX at 52.97 on the 4-hour chart is a strong indicator of a committed trend, meaning that any counter-trend moves might be short-lived. It's crucial to manage risk tightly in such environments. As the saying goes, the market always gives a second chance, and it’s better to miss a move than to take a forced trade against strong prevailing signals.
Bearish Outlook: Downside Pressure Persists
65% ProbabilityConsolidation Phase: Choppy Trading Ahead
25% ProbabilityBullish Reversal: Oversold Conditions Beckon?
10% ProbabilityFrequently Asked Questions: XAGUSD Analysis
What happens if XAGUSD breaks below the $75.03 support level?
A break below $75.03 on the 1-hour chart would invalidate the potential for a short-term bounce and signal further downside pressure. We could then see a rapid move towards the next key support at $74.40, as indicated by the 4-hour timeframe.
Should I consider buying XAGUSD at current levels around $75.65 given the oversold RSI on the 4-hour chart?
While the 4-hour RSI at 29.39 suggests oversold conditions, the strong bearish trend indicated by the ADX at 52.97 makes immediate buying risky. Wait for a confirmed bounce or a break of resistance before considering long positions; chasing falling knives can be perilous.
Is the RSI at 35.23 a sell signal for XAGUSD on the 1-hour chart?
An RSI of 35.23 on the 1-hour chart indicates bearish momentum, but it's not yet in the oversold territory that typically signals a strong reversal. It confirms the prevailing bearish trend, suggesting that any rallies might be met with selling pressure near resistance levels.
How will the Fed's upcoming policy decision affect XAGUSD this week, given the hot PPI data?
If the Fed signals a more hawkish stance due to hot PPI data, it could strengthen the US Dollar (DXY at 99.93) and put further pressure on XAGUSD. Conversely, any dovish surprises might weaken the dollar and offer some relief to silver, but the current bearish technicals suggest upside may be capped.
The path forward for XAGUSD is far from clear, but the technical signals are painting a predominantly bearish picture in the short to medium term. The strong ADX readings across multiple timeframes indicate a committed trend, and the correlation with a strengthening dollar adds another layer of complexity. While oversold conditions are appearing on the 4-hour chart, suggesting potential for a temporary bounce, the overall pressure remains to the downside. Patience and disciplined risk management are paramount. We must wait for clearer confirmation, either a decisive break of support or a confirmed reversal pattern, before committing to a strong directional bias. The market is volatile, but within this volatility lie opportunities for the prepared trader. Manage your risk, wait for your setup - the market always provides another chance.
“The market is a device for transferring money from the impatient to the patient.” – Warren Buffett. In volatile times like these, patience isn't just a virtue; it's a strategy.
Track markets in real-time
AI-powered analysis, technical indicators and real-time price data.
Join Our Telegram Channel
Breaking market news, AI analysis and trading signals instantly.
Join Channel