ETHUSD Dives to $2,112.35: Can Support Hold Amidst Strong Downtrend?
ETHUSD is trading near critical support at $2,112.35. With a strong downtrend in place and indicators flashing mixed signals, traders are watching closely to see if current levels can stem the losses.
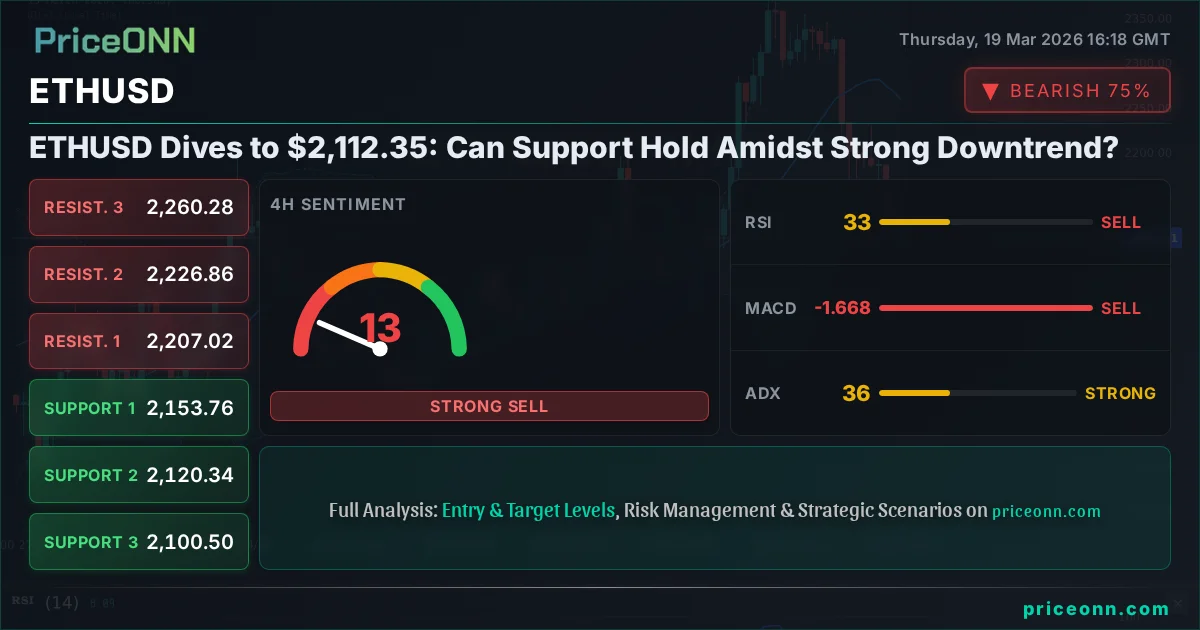
ETHUSD is currently grappling with significant downward pressure, trading at precisely $2,112.35. This level is more than just a number; it represents a crucial support zone that traders and analysts are watching with bated breath. The question on everyone's mind is whether this current price point can act as a springboard for a recovery, or if it's merely a brief pause before a further descent. The broader market sentiment, coupled with specific technical indicators, paints a complex picture, suggesting that the path ahead for Ethereum is fraught with both risk and potential opportunity.
- ETHUSD's RSI is at 28.16, signaling oversold conditions that could precede a bounce.
- Critical support is holding at $2,098.03, tested multiple times in the 1H timeframe.
- The MACD histogram is negative, indicating bearish momentum is still in control on the 1H chart.
- A strong downtrend with 96% power is evident on the 1H timeframe, suggesting caution is warranted.
Navigating the Downtrend: What the Charts Are Saying
The 1-hour chart for ETHUSD presents a stark picture of a market under duress. A formidable downtrend, boasting a strength of 96%, dictates the immediate price action. This isn't just a minor pullback; it's a committed move by sellers, pushing the price down with conviction. The current price of $2,112.35 is hovering precariously above the first key support level at $2,098.03. Should this level falter, the next significant psychological and technical barrier lies at $2,076.63, followed by $2,053.07. These levels are not arbitrary; they represent historical price congestion points where buying interest previously emerged. However, in a strong downtrend, these historical anchors can quickly become mere waypoints on a much steeper descent.
The technical indicators on this shorter timeframe offer a conflicting narrative, a common theme in volatile markets. The Relative Strength Index (RSI) at 28.16 is deep within oversold territory. Historically, such readings often precede a short-term price reversal as buyers step in to capitalize on perceived value. However, the MACD histogram remains firmly in negative territory, with the MACD line below its signal line. This suggests that while the selling momentum might be exhausting, the underlying bearish pressure is still very much in play. The Stochastic Oscillator, with %K at 31.73 and %D at 28.36, shows %K crossing above %D, offering a nascent bullish signal, but this is happening from extremely low levels and needs further confirmation. The ADX, a measure of trend strength, stands at a robust 32.45, confirming that the current downtrend has significant power, making any potential bounce fragile.
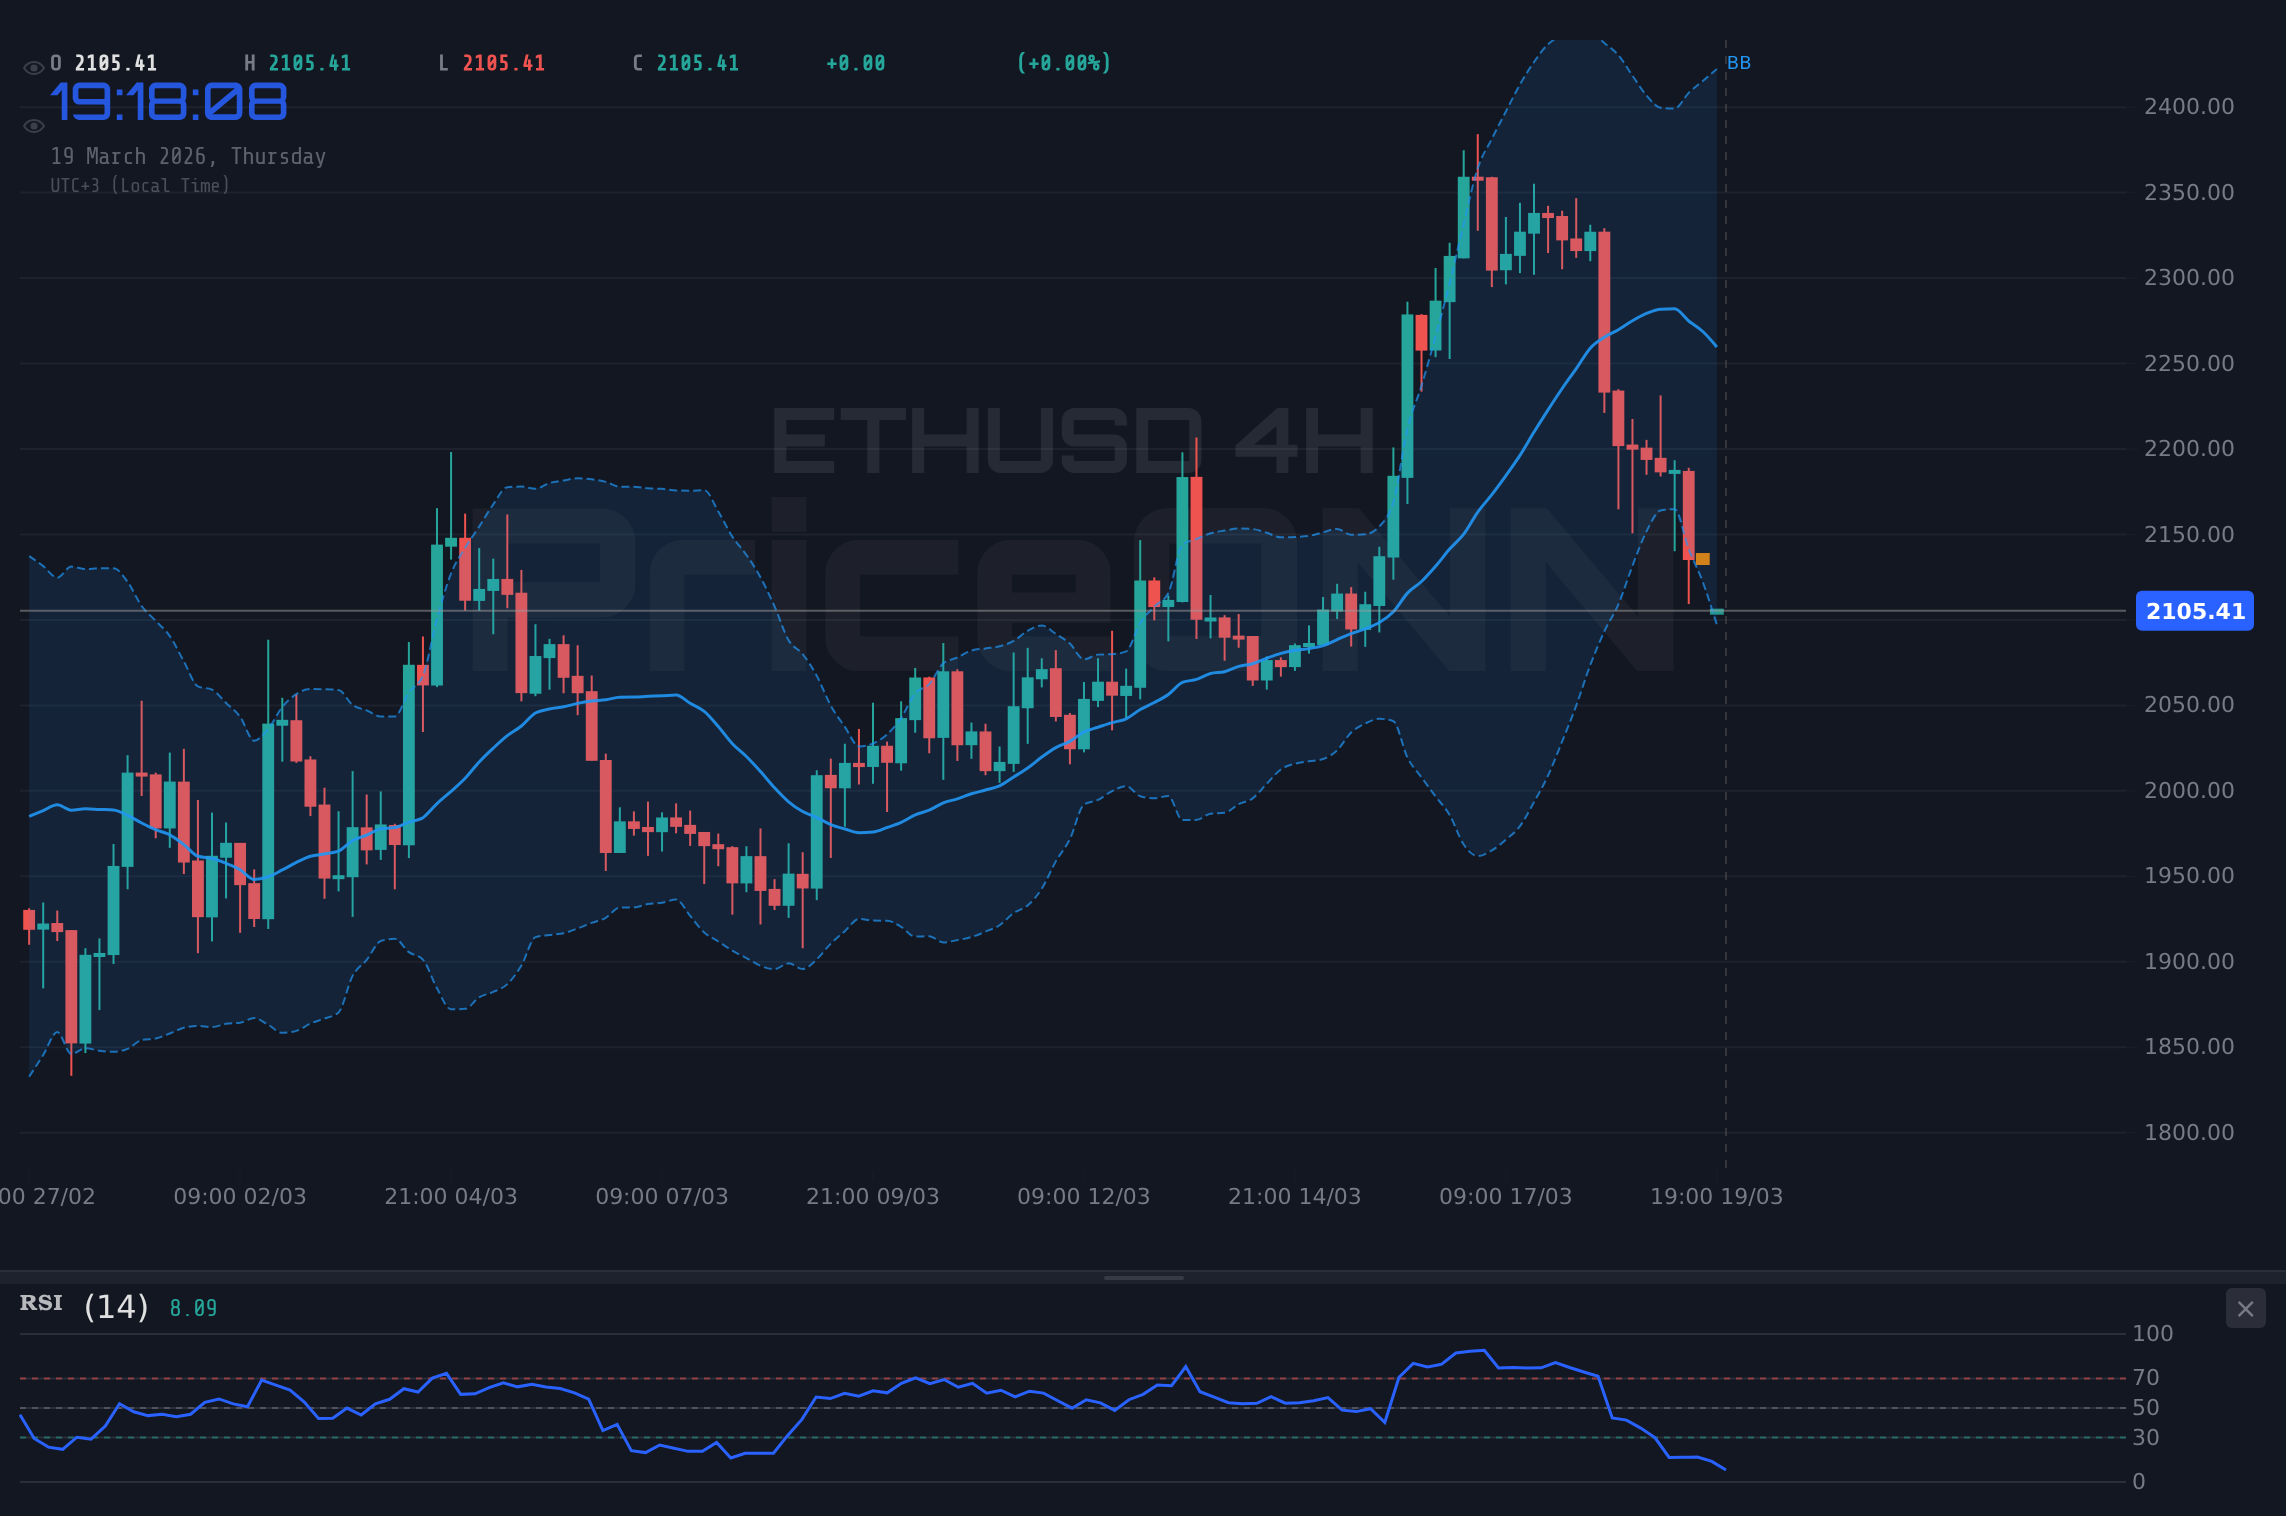
The Bollinger Bands further underscore the bearish sentiment on the 1-hour chart. The price is currently trading below the middle band and is testing the lower band. This configuration typically indicates strong selling pressure and a potential for further downside if the lower band cannot provide adequate support. The general signal across these indicators on the 1-hour timeframe leans heavily towards a 'SELL' (2 Buy, 6 Sell, 0 Neutral), reflecting the dominance of the bearish trend despite oversold readings.
The 4-Hour Perspective: A Battle for Control
Shifting our focus to the 4-hour chart, the trend appears more neutral, though still tinged with caution. Here, the trend strength is assessed at 50%, indicating a market that is consolidating or in a state of flux rather than a committed directional move. The immediate support levels on this timeframe are identified at $2,153.76, $2,120.34, and $2,100.50. These are crucial as they represent the immediate battleground where buyers and sellers are locking horns. Resistance, on the other hand, looms at $2,207.02, $2,226.86, and $2,260.28. Breaking above these resistance levels would be the first sign of a potential trend reversal, but the current momentum doesn't strongly suggest that outcome.
The technical indicators on the 4-hour chart reinforce this sense of indecision, albeit with a bearish lean. The RSI is hovering at 33.18, still in oversold territory but higher than the 1-hour reading, suggesting a slight easing of the extreme selling pressure. However, the MACD continues to show negative momentum, with the MACD line remaining below its signal line, indicating that the bears still have the upper hand. The Stochastic Oscillator is also deeply oversold, with %K at 14.18 and %D at 19.52, presenting a potential buy signal as %K is below %D, but it's too early to call a definitive reversal. The ADX reading here is 36.01, still indicating a strong downtrend, though slightly less aggressive than on the 1-hour chart. This confluence of indicators suggests that while there might be a short-term technical bounce potential, the underlying trend remains bearish.
The Bollinger Bands on the 4-hour chart are also noteworthy. The price is hugging the lower band, a sign of significant selling pressure and potential for a move back towards the middle band if a short-term recovery materializes. The overall signal on this timeframe is leaning towards 'SELL' (2 Buy, 6 Sell, 0 Neutral), reflecting the bearish bias despite the neutral trend classification. This conflict between trend neutrality and bearish indicator signals highlights the current chop and uncertainty within ETHUSD's price action on this timeframe.
The Daily View: A Longer-Term Trend Under Pressure
Zooming out to the daily timeframe, the picture becomes even more complex. Here, the trend is classified as neutral with 50% strength, suggesting that while the short-term and mid-term charts show bearish pressure, the longer-term picture is less decisive. This often occurs when a market has experienced a significant move and is awaiting new catalysts or clearer direction. The daily support levels are situated at $2,118.31, $2,036.43, and $1,922.19. These represent more significant historical price floors. Resistance is found at $2,314.43, $2,428.67, and $2,510.55. A decisive break above the $2,314.43 resistance would be a crucial first step for any sustained bullish recovery on the daily chart.
On the daily timeframe, the indicators present a fascinating dichotomy. The RSI sits at 49.88, almost perfectly neutral, indicating neither overbought nor oversold conditions, but reflecting the market's indecision. This neutral RSI reading, however, is coupled with negative MACD momentum, where the MACD line is below its signal line. This suggests that despite the lack of extreme conditions, the bearish bias is still subtly present. The Stochastic Oscillator, with %K at 57.26 and %D at 71.31, shows a bearish signal as %K is below %D, moving away from overbought territory. This is a slightly more concerning sign for bulls, as it implies that even from a neutral RSI, the downward momentum might be reasserting itself.
The Bollinger Bands on the daily chart are currently positioned around the middle band, indicating a period of consolidation or a transition phase. The ADX reading of 25.29 suggests a strong uptrend, which seems counterintuitive given the bearish signals from MACD and Stochastic. This discrepancy might be a data anomaly or reflect a lagging indicator effect, where the ADX is still reflecting past strength that is now dissipating. The overall signal on the daily chart is a mixed 'SAT' (3 Buy, 5 Sell, 0 Neutral), indicating that while the longer-term trend isn't definitively bearish, the immediate leaning is towards caution and potential downside.
Correlation with the Macro Environment: DXY and Equities
Understanding ETHUSD's price action requires looking beyond its own charts and considering its correlations with broader market forces. The US Dollar Index (DXY) is currently trading at 99.41, showing a slight downtrend on the 1-hour and 4-hour charts, but a strong uptrend on the daily. This divergence is key. A weakening dollar typically correlates with stronger crypto prices, as it reduces the purchasing power of fiat currency and can encourage a flight to riskier assets like Ethereum. Conversely, a strengthening dollar, as indicated by the daily DXY trend, can put pressure on ETHUSD.
The current situation presents a mixed signal. While the 1H and 4H DXY trends are down, suggesting a potentially supportive environment for ETHUSD, the dominant daily trend for DXY is up. This implies that any short-term gains for Ethereum might be capped by the overarching strength of the US dollar. Traders should be closely monitoring the DXY's ability to break below its key support levels on the daily chart; a decisive move there could provide a significant tailwind for ETHUSD. Conversely, if the DXY continues its ascent, it will likely add to the selling pressure on Ethereum.
Furthermore, the performance of major equity indices like the S&P 500 and Nasdaq 100 cannot be ignored. Both are currently experiencing significant downturns, with the S&P 500 at 6583.5 and the Nasdaq 100 at 24242.31. This broad risk-off sentiment in the stock market often spills over into the cryptocurrency space, which is perceived as a higher-risk asset class. When major stock indices are falling, investors tend to reduce their exposure to riskier assets, leading to sell-offs in crypto. The strong negative correlation between equities and ETHUSD in risk-off environments means that any further decline in the S&P 500 or Nasdaq could exacerbate the downward pressure on Ethereum, even if its own technical indicators suggest a potential bounce.
The current correlation between ETHUSD and risk assets like equities (S&P 500 at 6583.5, Nasdaq 100 at 24242.31) is a critical factor. A sustained sell-off in stocks could amplify ETHUSD's downtrend, overriding short-term oversold signals. Conversely, a rebound in equities, potentially spurred by dovish central bank signals, could provide a much-needed lift.
Central Bank Uncertainty and Its Shadow on Crypto
The global macroeconomic landscape is heavily influenced by the policy decisions and forward guidance of major central banks. While specific central bank actions weren't detailed in the provided market data for ETHUSD, the general sentiment surrounding monetary policy is crucial. Fears of sustained higher interest rates, as hinted at by the gold price's tumble below $4,850 due to 'Fed rate hike fears', are a significant overhang for risk assets. Higher interest rates increase the cost of capital and can reduce the attractiveness of growth-oriented assets like cryptocurrencies, which don't offer yield. This environment makes it harder for assets like ETHUSD to attract investment capital, especially when compared to safer, interest-bearing alternatives.
The Bank of Japan's cautious approach to interest rates, holding them steady despite rising oil prices and geopolitical fears, exemplifies the delicate balancing act central banks face. While the BoJ's stance might not directly impact ETHUSD, it reflects a global trend of central banks navigating inflation risks while trying not to stifle economic growth. This uncertainty about the future path of interest rates creates volatility across all asset classes. If major central banks begin to signal a more dovish stance, perhaps due to weakening economic data or easing inflation, it could significantly boost risk appetite and provide a much-needed catalyst for ETHUSD to climb above its current resistance levels.
Conversely, any indication of continued hawkishness or a delay in expected rate cuts could further dampen sentiment. The market is highly sensitive to these signals, and even subtle shifts in language from central bank officials can trigger significant price movements. For ETHUSD, a macro environment characterized by high-interest rates and cautious risk appetite acts as a persistent headwind, making it more challenging to sustain upward momentum and increasing the likelihood of further price erosion towards support levels.
The interplay between central bank policy and risk asset performance is paramount. While short-term technical bounces are possible for ETHUSD at $2,112.35, a sustained recovery will likely require a shift in the broader macroeconomic narrative - specifically, clearer signals of easing monetary policy or a significant de-escalation of geopolitical risks.
Navigating the Levels: ETHUSD's Crucial Price Zones
The current trading range for ETHUSD, from its daily low of $2,096.96 to its high of $2,231.36, highlights the volatility inherent in the cryptocurrency market. At $2,112.35, ETHUSD is teetering on the edge, with immediate support at $2,098.03 on the 1-hour chart and $2,118.31 on the daily chart serving as the critical juncture. A failure to hold these levels could precipitate a sharp decline, with the next major support points identified at $2,076.63 and $2,036.43 respectively. These aren't just lines on a chart; they represent areas where significant buying interest has historically materialized, and their breach could signal a fundamental shift in market sentiment.
On the resistance side, the path upwards is equally challenging. The immediate hurdle on the 1-hour chart is $2,142.99, followed by $2,166.55. A sustained move above these levels would be necessary to even consider a trend reversal. However, the daily resistance levels are far more significant: $2,314.43, $2,428.67, and ultimately $2,510.55. Breaking through these higher resistance points would require a significant shift in market dynamics, likely driven by positive fundamental news or a broad recovery in risk sentiment. Until then, the price action is likely to remain range-bound or continue its downward trajectory, dictated by the prevailing bearish momentum.
The strength of the downtrend across multiple timeframes cannot be overstated. The 1-hour chart shows a 96% trend strength, and the 4-hour shows 87%. While the daily trend is classified as neutral (50%), the persistent bearish signals from indicators like MACD and Stochastic suggest that this neutrality might be temporary, with a potential to re-establish a stronger downtrend. Traders must remain vigilant, respecting these key levels and understanding that a break below support or a consolidation above resistance will dictate the next significant move.
Scenario Analysis: Mapping Potential Futures for ETHUSD
Bearish Scenario: Downside Momentum Continues
65% ProbabilityConsolidation Scenario: Sideways Grind
25% ProbabilityBullish Scenario: Oversold Bounce
10% ProbabilityFrequently Asked Questions: ETHUSD Analysis
What happens if ETHUSD breaks below the $2,098.03 support level?
If ETHUSD closes below the $2,098.03 support on the 1-hour chart, it invalidates the immediate bounce scenario. This could trigger further selling pressure, potentially pushing the price towards the next significant support at $2,076.63, as indicated by the bearish scenario with a 65% probability.
Is the current RSI level of 28.16 a buy signal for ETHUSD at $2,112.35?
An RSI of 28.16 on the 1-hour chart does indicate oversold conditions, historically suggesting a potential for a short-term bounce. However, given the strong 96% downtrend strength and bearish MACD signals, this is not a standalone buy signal. Confirmation above resistance levels like $2,142.99 is crucial before considering a bullish entry.
How is the DXY's daily trend impacting ETHUSD's price around $2,112.35?
The DXY's strong daily uptrend at 99.41 exerts downward pressure on ETHUSD. While shorter-term DXY trends might offer brief relief, the dominant dollar strength acts as a headwind, making it harder for ETHUSD to sustain any upward movements and increasing the risk of further declines towards support.
How might upcoming central bank policy shifts affect ETHUSD if it holds current levels?
If ETHUSD manages to hold its current levels around $2,112.35, a shift towards more dovish central bank policies could fuel a recovery. Conversely, continued hawkish rhetoric or delayed rate cuts would likely exacerbate selling pressure, making it difficult for ETHUSD to climb above resistance levels like $2,142.99.
| Indicator | Value | Signal | Interpretation |
|---|---|---|---|
| RSI (14) | 28.16 | Oversold | Potential for bounce, but confirms selling pressure |
| MACD Histogram | -15.20 | Negative Momentum | Bearish pressure still dominant |
| Stochastic | K=31.73, D=28.36 | Bullish Crossover | Nascent buy signal, needs confirmation |
| ADX | 32.45 | Strong Downtrend | Confirms current trend strength |
| Bollinger Bands | Price below Middle Band | Bearish Bias | Selling pressure evident |
ETHUSD is currently navigating a critical juncture at $2,112.35. While oversold indicators on shorter timeframes suggest a potential for a short-term bounce, the overwhelming strength of the downtrend across multiple timeframes, coupled with broader macroeconomic headwinds and risk-off sentiment in equities, paints a cautious picture. The ability of key support levels to hold will be paramount in determining the next directional move. Traders should remain disciplined, respect the price action, and wait for clear confirmation before committing to any positions. Patience is key in these volatile markets; the setup will present itself.
Track markets in real-time
AI-powered analysis, technical indicators and real-time price data.
Join Our Telegram Channel
Breaking market news, AI analysis and trading signals instantly.
Join Channel