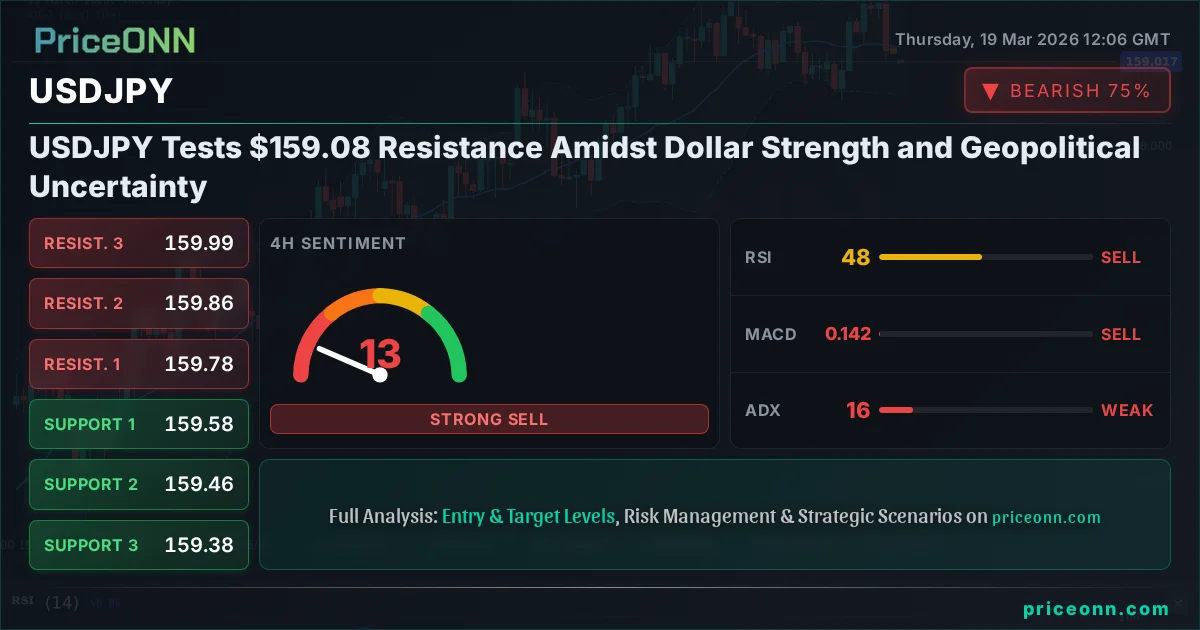
USDJPY Tests $159.08 Resistance Amidst Dollar Strength and Geopolitical Uncertainty
USDJPY hovers near $159.08 as a strong Dollar Index clashes with geopolitical jitters, creating a critical inflection point for traders. Analysis delves into technicals and macro drivers.
The currency markets are currently fixated on the USDJPY pair, which finds itself teetering precariously close to the significant psychological and technical level of $159.08. This pivotal juncture isn't just a number on a screen; it represents a battleground where bulls and bears are locked in a fierce contest, their next moves dictated by a complex interplay of dollar strength, Bank of Japan policy whispers, and a shifting global risk sentiment. Today's analysis dives deep into the USDJPY today analysis, exploring whether this key level will hold or if the pair is poised for a significant move. We'll dissect the technical chart patterns, weigh the fundamental drivers, and assess the market sentiment to paint a comprehensive picture for traders navigating these choppy waters.
- USDJPY is trading near the critical $159.08 resistance level, with the Dollar Index (DXY) at 99.86 showing dollar strength.
- On the 1H chart, RSI stands at 35.94, indicating a bearish inclination, while the ADX at 26.11 suggests a strong downtrend is in play.
- The 1D chart shows a strong bullish trend for USDJPY with RSI at 61.41, but stochastic signals a potential pullback with K=79.15 and D=87.22.
- Geopolitical tensions and central bank divergence are key macro drivers influencing USDJPY's correlation with global risk appetite.
The Tug-of-War at $159.08: Bulls vs. Bears in Focus
The $159.08 price point for USDJPY is more than just a round number; it's a level that has seen considerable action and now acts as a crucial battleground. For the bulls, pushing USDJPY above this mark signifies a continuation of the strong uptrend observed on the daily chart, potentially signaling further gains towards higher resistance levels. They are drawing confidence from the daily chart's bullish signals, including an RSI of 61.41 and a powerful ADX of 35.89 indicating a robust trend. However, the immediate picture painted by the shorter timeframes tells a different story. The 1-hour chart, for instance, presents a more cautious outlook, with an RSI of 35.94 and an ADX of 26.11 suggesting a strong downtrend is currently dominating price action. This divergence between the long-term trend and the short-term momentum creates a tense environment, where every tick could be decisive.
The bears, conversely, see $159.08 as a formidable ceiling, a point where the recent upward momentum falters. They are emboldened by the bearish signals on the 1-hour and 4-hour charts, which suggest that the pair might be due for a correction or consolidation. The stochastic oscillator on the daily chart, showing %K at 79.15 and %D at 87.22, is flashing an overbought warning, hinting at a potential reversal. This technical setup, coupled with broader market dynamics such as a strengthening US Dollar Index (DXY) currently at 99.86, and the ever-present geopolitical risks, provides fertile ground for bearish sentiment to take hold. The question on every trader's mind is which narrative will prevail: the persistent long-term bullish trend or the immediate bearish pressure from shorter timeframes and external factors?
The Bull Case: Riding the Dollar's Coat-Tails
The argument for USDJPY continuing its ascent, breaking decisively above $159.08, is built upon several strong pillars. Firstly, the overarching trend on the daily timeframe remains undeniably bullish. With an RSI reading of 61.41, the pair is comfortably in neutral territory but leaning towards bullish momentum, far from the overbought conditions that would typically signal a reversal. More importantly, the ADX at 35.89 on the daily chart signifies a strong, established uptrend. This isn't a fleeting move; it's a trend with conviction, suggesting that underlying forces are pushing the pair higher. For bulls, the immediate resistance at $159.202 on the 1-hour chart is a hurdle that can be overcome, especially if the broader US Dollar Index (DXY) continues its upward trajectory. The DXY is currently at 99.86, and any further strength from the dollar typically translates into gains for USDJPY, given the pair's strong positive correlation. This correlation is a well-documented phenomenon, where a stronger dollar, driven by factors such as interest rate differentials or safe-haven demand, naturally pulls USDJPY higher.
Furthermore, the economic backdrop provides a supportive narrative for a continued dollar rally. While specific economic calendar data for the last 48 hours doesn't directly detail USDJPY's immediate catalysts, the general resilience shown by the US economy, as suggested by the recent news about US growth showing resilience, contrasts with potential headwinds in other major economies. If upcoming US economic releases, such as employment figures or inflation data, continue to paint a picture of economic strength, it would likely reinforce the Federal Reserve's stance on monetary policy, potentially keeping interest rate differentials favorable for the dollar. This divergence in economic performance and monetary policy expectations between the US and Japan has historically been a significant driver of USDJPY's strength. The Bank of Japan, while facing inflationary pressures, has been cautious about aggressively tightening policy, maintaining a yield gap that benefits dollar bulls. This fundamental divergence is a powerful tailwind that, in the eyes of the bulls, should eventually overpower the short-term technical headwinds around the $159.08 mark.
The Bear Case: Caution at the Threshold
On the flip side, the bearish argument for USDJPY hinges on the immediate technical signals and the potential for a global risk-off sentiment to emerge. The 1-hour and 4-hour charts present a compelling case for caution. The RSI on the 1-hour chart is at 35.94, firmly in the lower half of the neutral zone and indicating a bearish bias in the short term. Similarly, the ADX on the 1-hour chart at 26.11, while indicating a trend, suggests it's a strong downtrend currently in play on this timeframe. This immediate bearish momentum is a significant concern for those looking for upside continuation. Moreover, the stochastic oscillator on the daily chart is flashing a warning. With %K at 79.15 and %D at 87.22, it's approaching overbought territory, suggesting that the recent rally may be losing steam and a pullback is increasingly likely. This technical divergence - bullish on daily, bearish on shorter frames - is a classic setup for a potential reversal or, at the very least, a period of consolidation.
Beyond the charts, external factors could also fuel a bearish narrative. Geopolitical tensions, as evidenced by the recent escalation between Iran and Israel and the subsequent surge in oil prices (Brent crude past $112), can trigger a flight to safety. While the US dollar often benefits from safe-haven flows, a sharp increase in global uncertainty can sometimes lead to broader risk aversion that impacts all major currencies, including the dollar. If market participants begin to price in a significant global economic slowdown due to these geopolitical events, it could lead to a reassessment of interest rate expectations, potentially putting a dampener on dollar strength. Furthermore, any unexpected shift in the Bank of Japan's monetary policy stance, perhaps a more hawkish tone or hints of policy normalization, could provide a strong counter-narrative to dollar strength and weigh heavily on USDJPY. While such a shift seems unlikely in the immediate future, it remains a persistent risk factor for USDJPY bulls, especially as the pair approaches significant resistance levels like $159.08.
Technical Confluence and Divergence: Reading the Tea Leaves
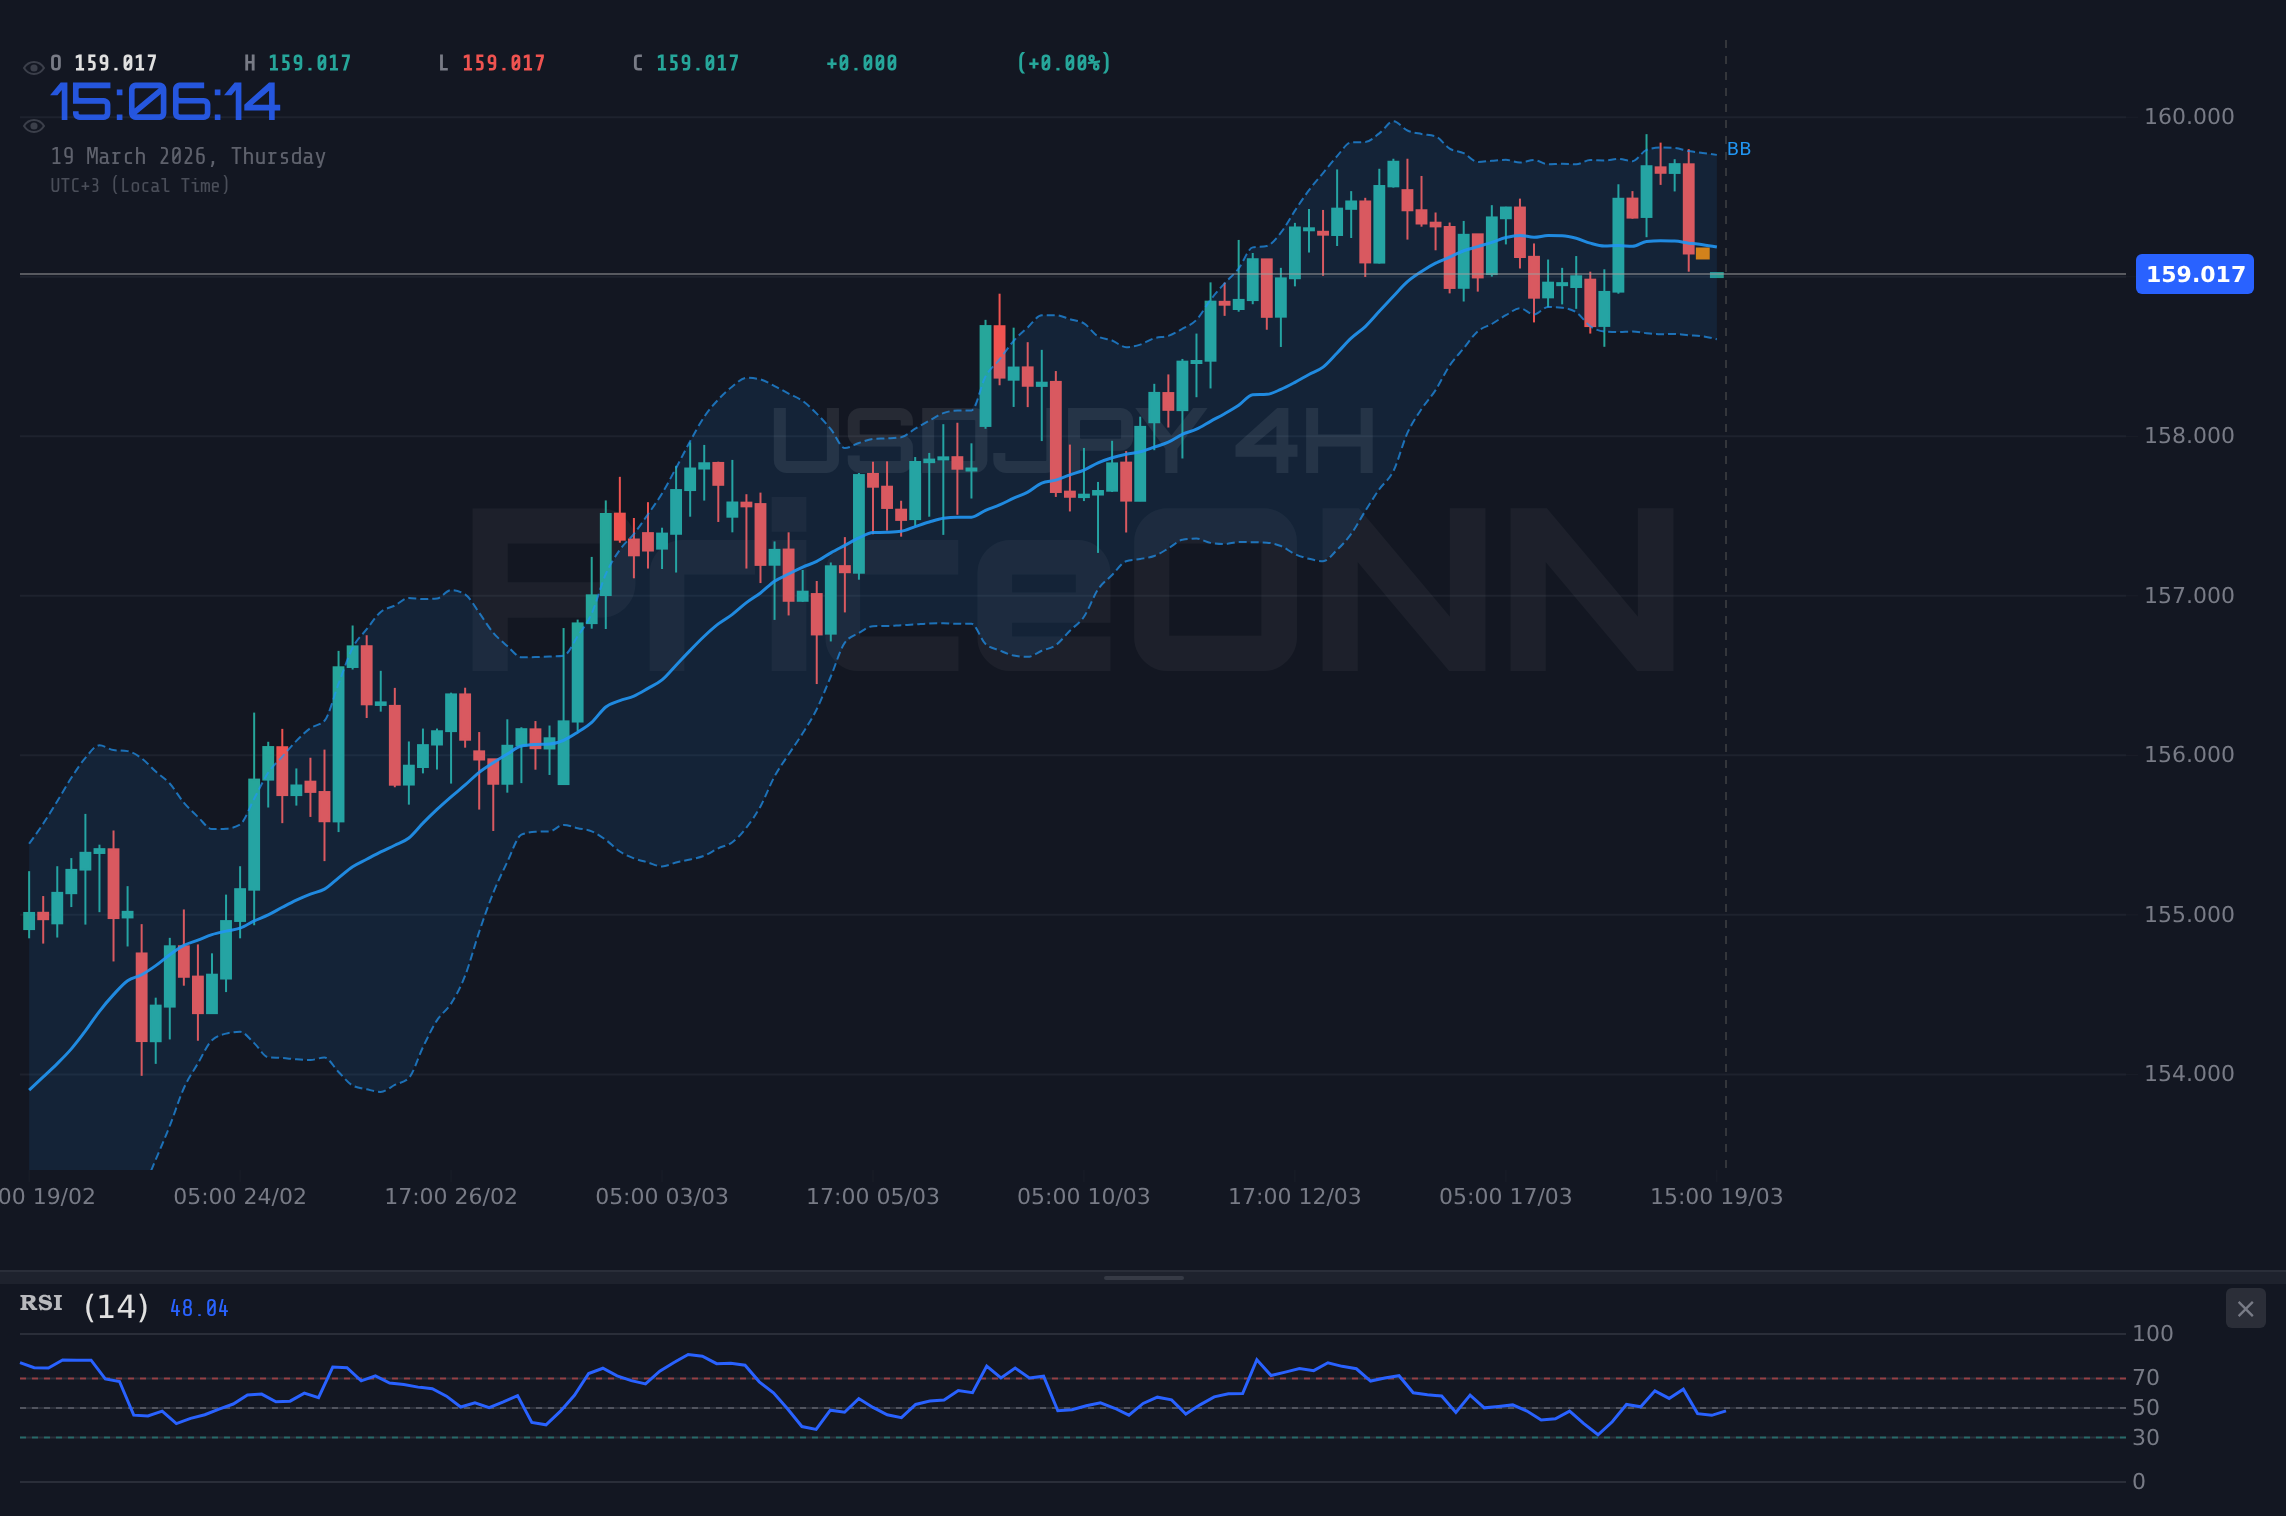
The technical indicators offer a fascinating, albeit conflicting, perspective on USDJPY's immediate future. On the daily chart, the picture is largely bullish. The RSI at 61.41 suggests room for further upside before reaching overbought territory, and the ADX at 35.89 confirms a strong existing uptrend. The Bollinger Bands on the daily chart are also positioned above the middle band, supporting the bullish sentiment. However, the daily stochastic oscillator, with %K at 79.15 and %D at 87.22, is inching closer to the overbought zone, signaling that the current upward momentum might be stretched and a correction is possible. This is a critical divergence within the daily timeframe itself, suggesting that while the trend is up, the pace might be unsustainable without a pause.
Zooming into the shorter timeframes, the bearish signals become more pronounced. The 1-hour chart shows an RSI of 35.94, which is relatively low and indicates bearish pressure. The MACD is below its signal line, further reinforcing this short-term bearish sentiment. The ADX at 26.11 on the 1-hour chart confirms a strong downtrend on this specific timeframe, indicating that intraday traders are likely selling into strength. The 4-hour chart mirrors these concerns, with an RSI of 43.86 and a bearish MACD. The stochastic on the 4-hour chart is also in oversold territory, suggesting potential for a bounce, but the overall trend on this timeframe is still bearish. This juxtaposition of daily bullishness against shorter-term bearishness is where the real trading edge lies – identifying when the short-term weakness is merely a pause within a larger uptrend versus a genuine reversal.
Navigating the Crossroads: What About the Economic Calendar?
The economic calendar plays a crucial role in shaping the narrative for USDJPY, particularly concerning the divergence between US and Japanese monetary policies and economic health. While there are no immediate, high-impact Japanese economic releases scheduled in the next 48 hours that could dramatically shift the BoJ's stance, the US economic calendar remains a key focus. Investors are keenly awaiting upcoming US data releases, such as employment figures and inflation reports, to gauge the Federal Reserve's next move. Stronger-than-expected US data would likely reinforce expectations of a hawkish Fed, potentially leading to higher US interest rates and further strengthening the dollar against the yen. This is the primary scenario supporting the bullish case for USDJPY.
Conversely, any signs of US economic cooling, such as weaker-than-expected jobs numbers or a significant drop in inflation, could lead markets to price in a more dovish Fed, or even anticipate rate cuts sooner than currently expected. This would likely put downward pressure on the US dollar and, consequently, on USDJPY. The market's reaction to such data will be amplified by the current geopolitical climate. The recent news about escalating tensions between Iran and Israel, driving oil prices higher, adds a layer of uncertainty. While a stronger dollar often acts as a safe haven, prolonged geopolitical instability can foster broader risk aversion, potentially impacting currency markets in unpredictable ways. Traders will be watching how the DXY reacts to any geopolitical escalations, as its movement is a key barometer for USDJPY's direction. The interplay between US economic data, Fed policy expectations, and global risk sentiment will be critical in determining whether USDJPY can break through the $159.08 resistance or succumbs to bearish pressures.
The Verdict: A Tightrope Walk Above $159.08
We stand at a critical juncture for USDJPY, with the pair hovering precariously around the $159.08 mark. The daily chart paints a picture of a robust uptrend, supported by strong ADX and RSI levels that suggest further potential upside. The fundamental backdrop, particularly the interest rate differential favoring the US and the general resilience of the US economy, provides a solid foundation for the bulls. However, the immediate technicals on the 1-hour and 4-hour charts are flashing warning signs, with bearish momentum and stochastic oscillators nearing overbought conditions. This creates a high degree of uncertainty and suggests that a decisive breakout above $159.08 might not be immediate. Patience and risk management are paramount here.
Given the conflicting signals, the most probable scenario in the short term is a period of consolidation or a retest of lower levels before any significant upward move can be confirmed. The bulls need to see a clear break and hold above $159.202, ideally on strong volume and with a concurrent strengthening of the DXY, to regain full control. Conversely, a break below the 1-hour support at $159.068 could signal a deeper retracement, potentially towards the 4-hour support levels. The market is currently in a state of flux, influenced by both the persistent strength of the dollar and the potential for geopolitical headwinds to shift risk sentiment. Therefore, while the long-term trend remains bullish, the immediate path forward for USDJPY at $159.08 is likely to be characterized by volatility and requires careful monitoring of both technical levels and macroeconomic developments.
Bearish Scenario: Consolidation or Retracement
65% ProbabilityNeutral Scenario: Range-Bound Trading
25% ProbabilityBullish Scenario: Breakout Confirmation
10% ProbabilityFrequently Asked Questions: USDJPY Analysis
What happens if USDJPY breaks decisively above the $159.08 resistance level?
A sustained break above $159.08, specifically closing above $159.202 on the 1H chart, would invalidate the immediate bearish pressure. This bullish confirmation, especially if accompanied by a rising DXY and positive US economic data, could target the next resistance levels at $159.286 and potentially $159.336.
Should I consider buying USDJPY at current levels near $159.08 given the daily bullish trend?
Buying at current levels carries risk due to bearish signals on shorter timeframes and the critical resistance at $159.08. A more prudent approach, given the stochastic's daily overbought warning, might be to wait for a confirmed breakout above $159.202 or a pullback to a more defined support level like $159.018, where risk/reward could be more favorable.
Is the RSI at 35.94 on the 1H chart a strong sell signal for USDJPY right now?
An RSI of 35.94 on the 1-hour chart does indicate bearish momentum in the short term, suggesting potential for further downside or consolidation. However, it's not an extreme oversold reading, and given the stronger daily bullish trend, it's more indicative of short-term weakness rather than a definitive reversal signal on its own. Confirmation from price action breaking support is needed.
How will upcoming US economic data impact USDJPY around the $159.08 level this week?
Stronger-than-expected US data, such as positive employment or inflation figures, would likely bolster the bullish case for USDJPY by reinforcing Fed hawkishness and dollar strength, potentially pushing the pair above $159.08. Conversely, weaker data could trigger a risk-off move, pressuring USDJPY lower towards immediate support levels.
| Indicator | Value | Signal | Interpretation |
|---|---|---|---|
| RSI (14) | 35.94 | Bearish | Short-term bearish momentum on 1H |
| MACD | - | Bearish | Below signal line on 1H |
| Stochastic | K=10.47, D=23.83 | Bearish | Bearish crossover on 1H |
| ADX | 26.11 | Bullish | Strong downtrend on 1H |
| Bollinger Bands | Middle Band | Bearish | Price below middle band on 1H |
Track markets in real-time
AI-powered analysis, technical indicators and real-time price data.
Join Our Telegram Channel
Breaking market news, AI analysis and trading signals instantly.
Join Channel