AUDUSD Trades Sideways Near $0.70902: Key Levels and Fundamental Drivers
AUDUSD hovers around $0.70902 amid mixed signals. Analysis of key support at $0.70193 and resistance at $0.70871, with a focus on RBA policy and global economic trends.
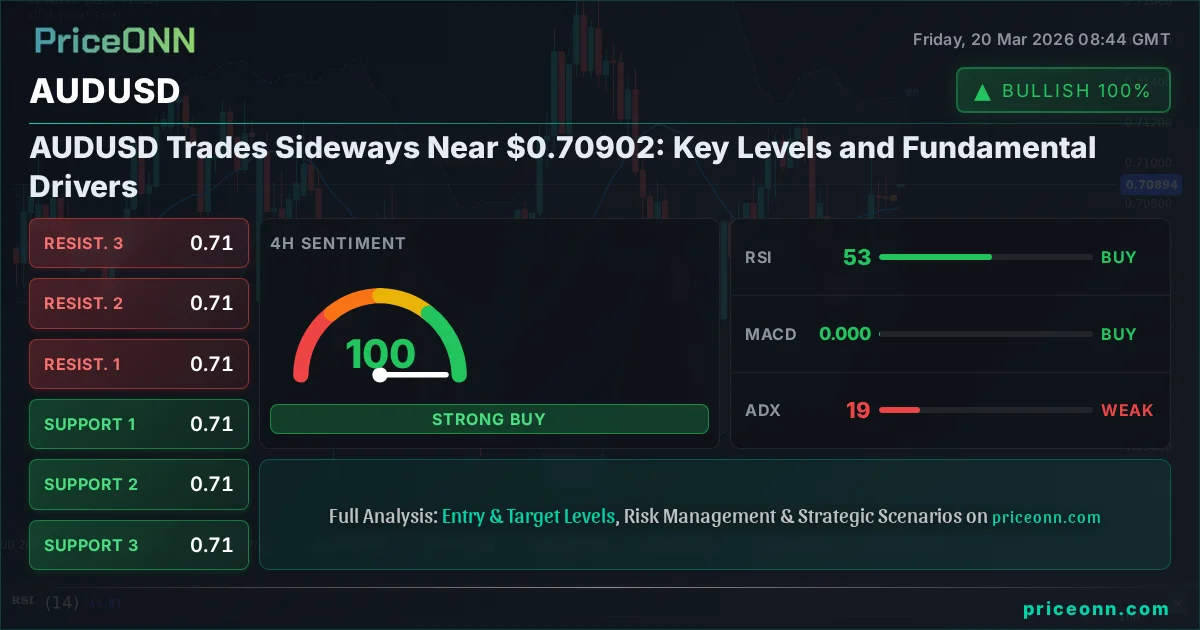
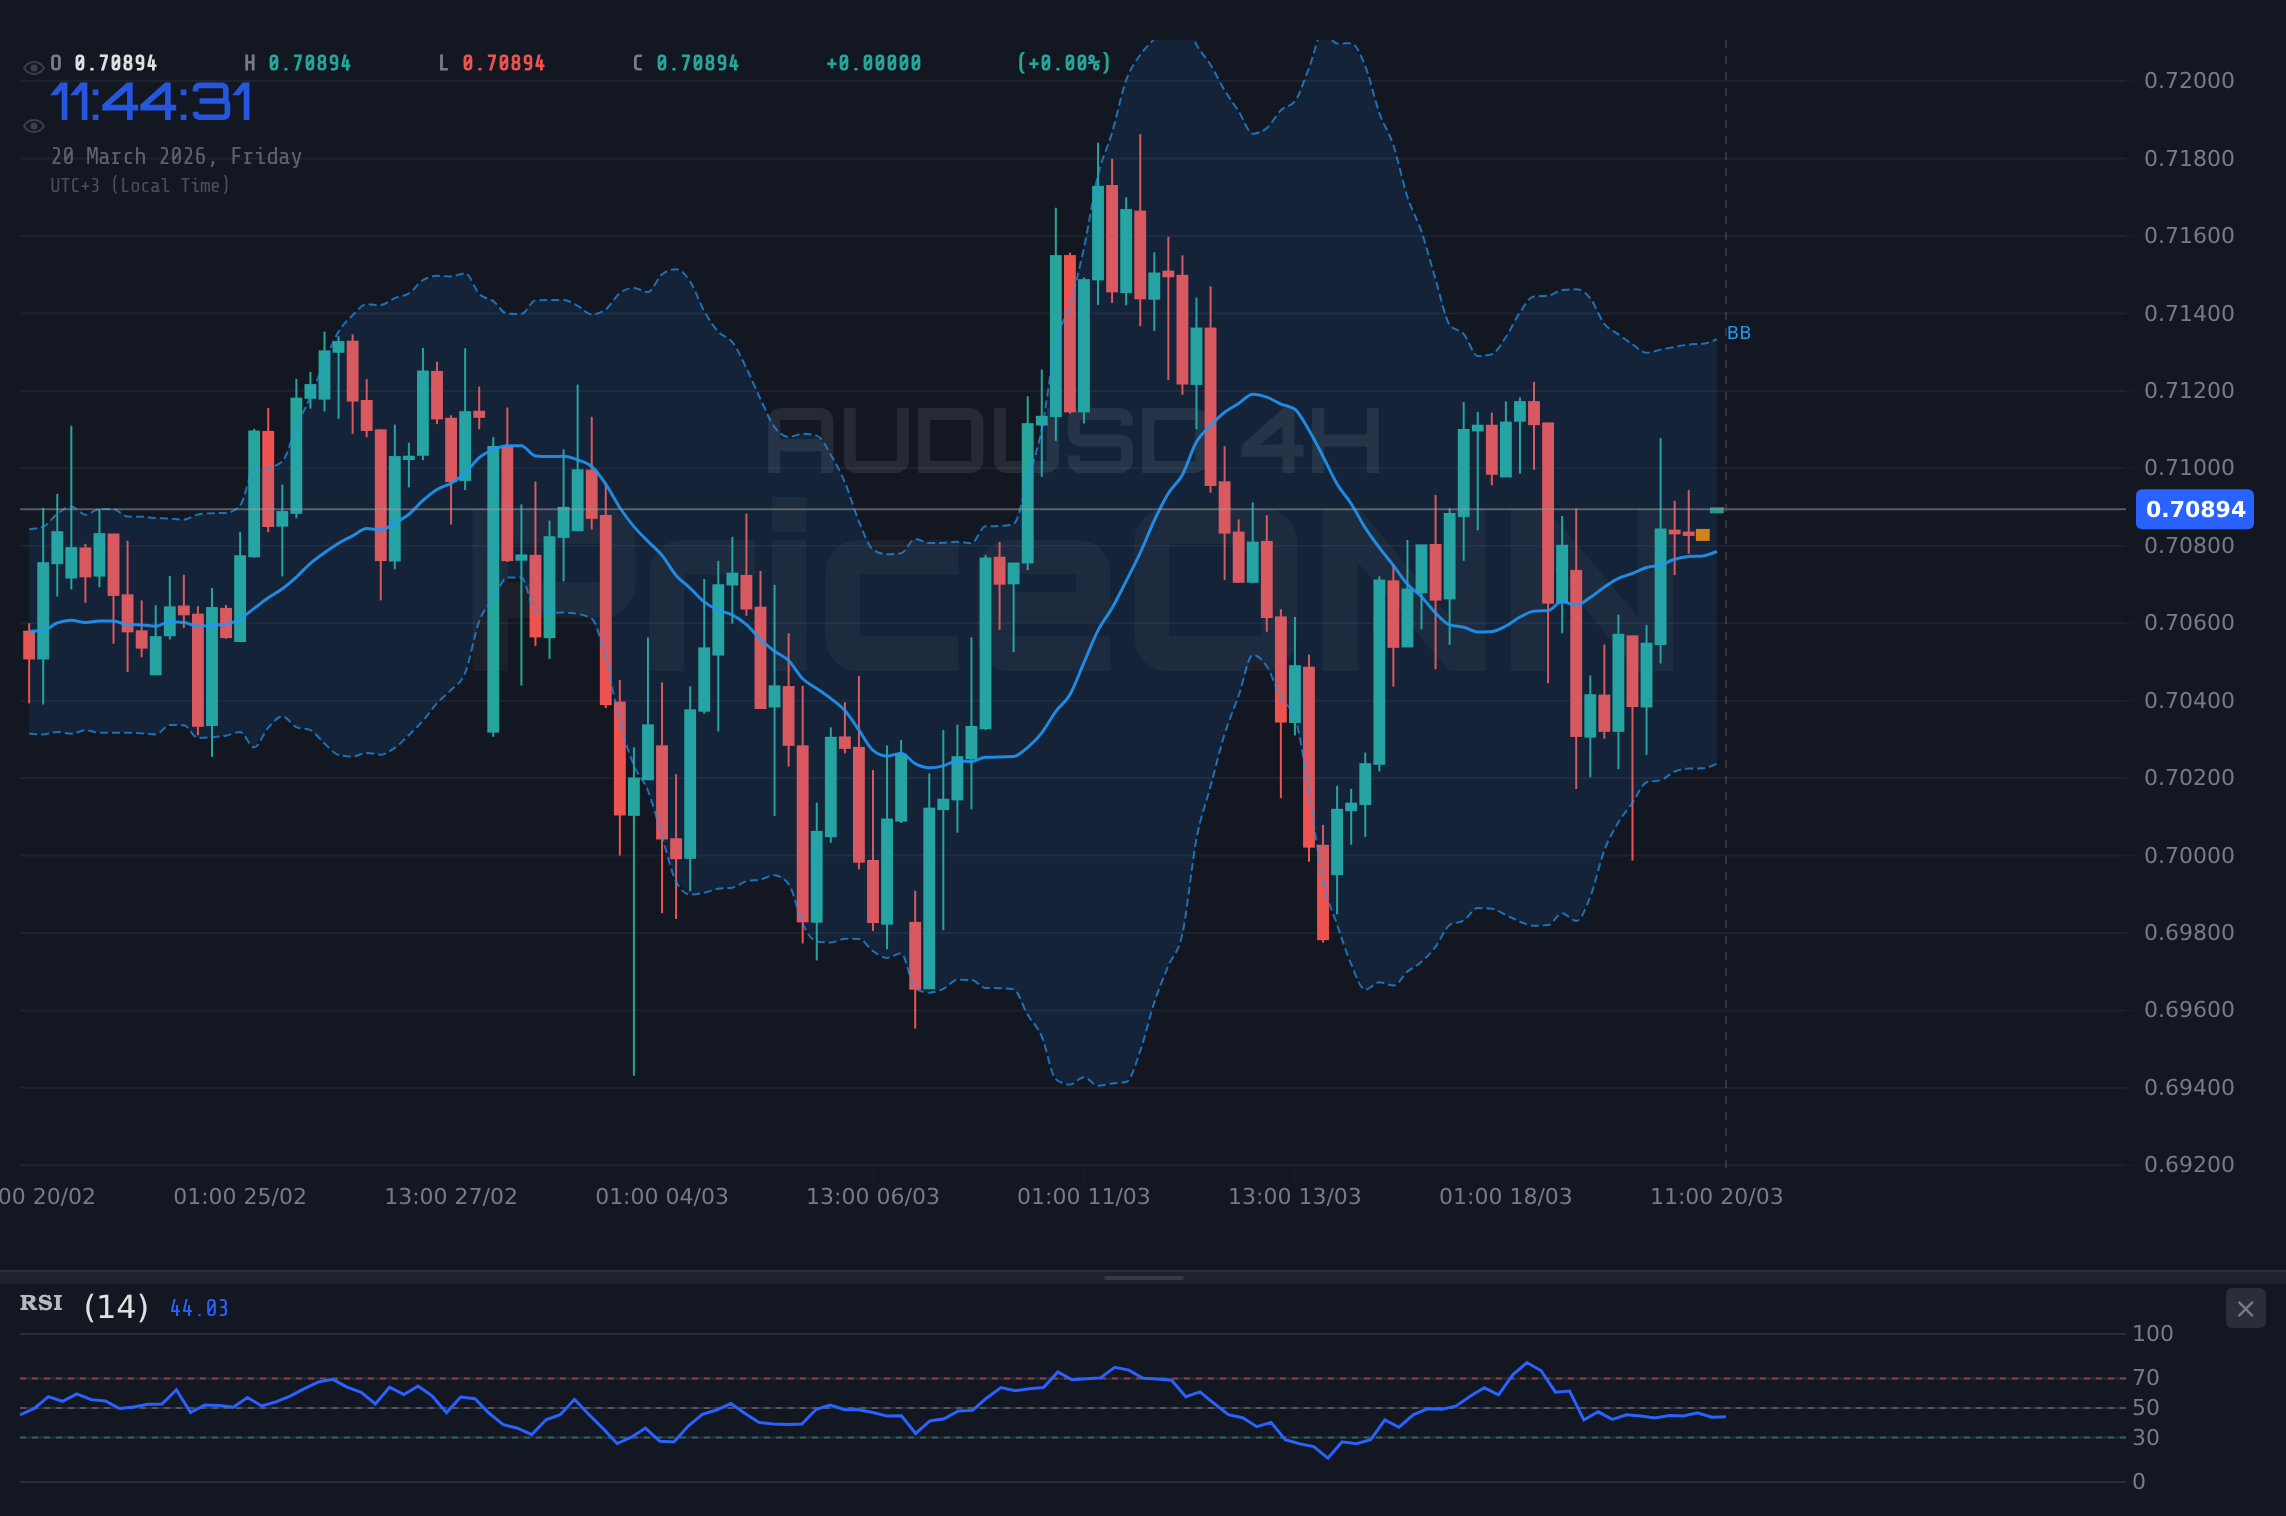
AUDUSD is currently navigating a crucial juncture, trading at approximately $0.70902. This price point places the pair precariously close to a significant resistance level, raising questions about its ability to sustain current gains or if a retreat is imminent. The Australian Dollar’s trajectory is heavily influenced by a complex interplay of domestic economic data, Reserve Bank of Australia (RBA) policy expectations, and broader global macroeconomic sentiment, particularly the strength of the US Dollar and risk appetite in financial markets.
- The Relative Strength Index (RSI) stands at 60.38, indicating positive momentum but approaching overbought territory, suggesting bulls are losing steam.
- Critical support for AUDUSD is firmly established at $0.70193, a level that has been tested multiple times and could signal a significant shift if breached.
- The MACD histogram shows positive momentum, but with the Stochastic %K (49.76) crossing below %D (53.18), a potential bearish signal is emerging.
- Global economic factors, including the DXY's current level of 99.09 and the S&P 500's slight pullback to 6611.6, are creating a mixed backdrop for this currency pair.
The Australian Dollar's current position around the $0.70902 mark presents a fascinating case study in market indecision. With the 1-hour trend showing neutral strength at 50%, and the 4-hour trend also neutral with 50% strength, the immediate path forward appears uncertain. However, the daily timeframe paints a slightly different picture, with a neutral trend but a notable ADX of 20.48 suggesting a lack of strong directional conviction. This indecisiveness often precedes a significant move, making it imperative for traders to closely monitor key technical and fundamental developments. The AUDUSD pair’s correlation with global risk sentiment, as indicated by the S&P 500's current price of 6611.6, means that any shifts in broader market psychology could quickly impact the Aussie.
The Bull's Roadmap: Navigating Towards Higher Ground
For the AUDUSD bulls to seize control, a decisive break above the immediate resistance at $0.70871 is paramount. This level has acted as a ceiling in recent price action, and a sustained push beyond it would signal a bullish intent. The 1-hour technical indicators offer some support for this narrative, with the RSI at 60.38 and MACD showing positive momentum. However, the Stochastic oscillator is flashing a cautionary note, with the %K line (49.76) dipping below the %D line (53.18), suggesting that the upward momentum might be losing steam. A more convincing bullish signal would require the Stochastic to turn upwards and the RSI to move decisively into the overbought territory above 70, but without immediate signs of exhaustion. Furthermore, a strengthening of risk appetite globally, perhaps signaled by a rebound in the S&P 500 above 6633, would likely provide a tailwind for the risk-sensitive Australian Dollar.
The path higher for AUDUSD would likely involve testing and potentially breaking through the subsequent resistance levels. The first significant hurdle beyond $0.70871 would be the 4-hour resistance at $0.70924, followed by $0.71016 and then $0.71116. A successful breach of these levels, particularly sustained closes above them on the hourly or 4-hour charts, would confirm a bullish breakout. This scenario hinges on several factors: continued RBA dovishness being perceived as priced in, or even a slight hawkish surprise in future commentary; a softening US Dollar, perhaps indicated by a decline in the DXY below 99.05; and a general global appetite for risk assets. The strength of the ADX at 23.47 on the 1-hour chart suggests that if a breakout occurs, it could gain traction, but the current low ADX on the daily (20.48) implies any upward move might lack sustained trend strength without further fundamental catalysts.
Where Bears Take Control: The Support Breakdown Scenario
Conversely, the bearish case for AUDUSD gains traction if the pair fails to overcome the immediate resistance and instead falters, succumbing to selling pressure. The critical support level to watch is $0.70193. A decisive break below this point, confirmed by a close on the 1-hour or 4-hour chart, would open the door for a more significant decline. The Stochastic crossover on the 1-hour chart (K=49.76, D=53.18) is an early warning sign for the bulls, and a continued descent would likely see the RSI, currently at 60.38, turn downwards. If the pair breaks below $0.70193, the next logical downside targets would be the 4-hour support levels at $0.70000 (approximately, derived from 0.70000 as a psychological level near 0.70000, though the closest data point is 0.70000), $0.69732, and then $0.69545, derived from the 1D support levels.
Several factors could trigger such a bearish scenario. A surprisingly strong US Non-Farm Payrolls (NFP) report, or hawkish commentary from Federal Reserve officials, could boost the US Dollar, pushing the DXY higher towards 99.18 or even 99.72. Similarly, a sharp downturn in global risk sentiment, evidenced by a significant drop in the S&P 500 below 6590.9, would likely lead to a flight to safety, benefiting the greenback at the expense of the Australian Dollar. Domestically, any signs of weakness in Australian inflation data or a more dovish-than-expected stance from the RBA could also weigh on AUDUSD. The current strong ADX on the 4-hour timeframe (56.57 for XAGUSD, indicating a strong downtrend in silver, but relevant for broader commodity sentiment) and the daily timeframe (62.64 for XAGUSD) suggests that when trends do take hold, they can be powerful, implying that a breakdown could be swift and severe if the fundamental conditions align.
The Waiting Game: Consolidation Near $0.70900
It is entirely plausible that AUDUSD will remain range-bound in the near term, consolidating its recent moves around the $0.70900 level. This neutral scenario typically occurs when conflicting signals from technical indicators and mixed fundamental drivers create a stalemate. In such a situation, the pair might oscillate between the defined support at $0.70193 and resistance at $0.70871, or even a tighter range defined by intraday levels. The neutral trend strength across multiple timeframes (50% on 1H and 4H) supports this possibility. Traders might adopt a 'wait-and-see' approach, holding off on major positions until clearer directional signals emerge from upcoming economic data releases or geopolitical events.
During a consolidation phase, volume tends to dry up, and price action can become choppy. This environment can be frustrating for trend followers but might offer opportunities for range traders who can capitalize on the oscillations between support and resistance. Key economic events scheduled for the coming week will be crucial in breaking this potential stalemate. For instance, upcoming inflation data from Australia or the US, or any significant policy shifts hinted at by central bank officials, could provide the necessary impetus for a breakout. Until then, the AUDUSD might continue to trade within its established range, with the $0.70902 mark acting as a pivot point. The correlation with the DXY, currently at 99.09, suggests that any stabilization or slight pullback in the dollar could provide temporary support to AUDUSD, while a resurgence in dollar strength would cap any upside attempts.
The Most Likely Scenario and What to Watch
Considering the current technical picture and the broader macroeconomic context, the most likely scenario for AUDUSD in the immediate short term appears to be a **neutral to slightly bearish bias, with a high probability of consolidation around the $0.70900 level.** The confluence of resistance near the current price, mixed signals from oscillators like Stochastic, and the dominant trend on the daily charts suggesting underlying weakness contribute to this outlook. The probability of a sustained bullish breakout above $0.71116 in the absence of a significant fundamental catalyst is relatively low, perhaps around 25%. Conversely, a bearish breakdown below $0.70193 carries a moderate probability, estimated at 45%, especially if global risk aversion increases or US yields firm up significantly. The most probable outcome, therefore, is continued range-bound trading, with a slight lean towards downside pressure, estimated at 30% probability for a neutral outcome with a bearish undertone.
What I'll be watching closely this week are several key triggers. Firstly, the ability of AUDUSD to decisively break above the $0.70871 resistance. A sustained move above this level, ideally with increasing volume and supported by a weakening DXY (below 99.05), would invalidate the bearish lean and open the door for a move towards $0.71116. Secondly, the crucial support at $0.70193 remains the linchpin for the bearish scenario. A clear break below this level, particularly on the 4-hour chart, would confirm downside potential, targeting $0.69732 and potentially lower. Thirdly, upcoming economic data releases are critical. Any surprises in Australian inflation figures or RBA commentary could shift the balance, as could key US data like the upcoming Non-Farm Payrolls report, which has the potential to significantly influence the DXY and, by extension, AUDUSD. The market sentiment, as reflected by the S&P 500’s trading near 6611.6, will also be a vital barometer; a sustained move below 6590.9 would signal increasing caution.
Key Levels and Economic Calendar Watch
The technical landscape for AUDUSD is clearly defined by key support and resistance levels. On the downside, the primary support is situated at $0.70193. A break below this level would likely trigger a move towards the secondary support at $0.69545, with the tertiary support at $0.69102 providing a more distant floor. On the upside, immediate resistance stands at $0.70871. Overcoming this hurdle would pave the way for testing the 4-hour resistance at $0.70924, followed by $0.71016 and the more significant $0.71116. These levels will act as critical battlegrounds for bulls and bears in the coming days.
From an economic calendar perspective, the upcoming week holds several data points that could influence AUDUSD. Investors will be closely watching Australian inflation figures, particularly the Consumer Price Index (CPI) and Producer Price Index (PPI), for any signs of persistent price pressures or a slowdown. These releases will be crucial in shaping expectations for future RBA policy. On the US side, the Non-Farm Payrolls (NFP) report, along with Average Hourly Earnings and the Unemployment Rate, will be paramount. Stronger-than-expected US employment data could reinforce the Federal Reserve's hawkish stance, strengthening the dollar and potentially pressuring AUDUSD lower. Conversely, weaker data might fuel speculation of a Fed pivot, offering support to the Aussie. Traders should also keep an eye on any commentary from RBA and Federal Reserve officials for forward guidance on monetary policy. The current DXY at 99.09 indicates the dollar is holding firm, but significant shifts in US economic data could alter this dynamic.
Frequently Asked Questions: AUDUSD Analysis
What happens if AUDUSD breaks decisively above the $0.70871 resistance level?
A sustained move above $0.70871, confirmed by hourly or 4-hour closes, would invalidate the near-term bearish bias. This would likely trigger further upside towards the next resistance at $0.70924, potentially extending to $0.71016 if market sentiment remains supportive and the DXY weakens below 99.05.
Should I consider buying AUDUSD at current levels around $0.70902 given the mixed technical signals?
Buying at current levels carries risk due to the proximity of resistance at $0.70871 and conflicting signals from oscillators like Stochastic. A more prudent approach would be to wait for confirmation: either a clear break above resistance with supportive global sentiment, or a confirmed rejection and test of support near $0.70193. Patience is key here.
Is the RSI at 60.38 a sign of overbought conditions for AUDUSD?
An RSI of 60.38 is in the upper half of the neutral zone but not yet considered strictly overbought (typically above 70). While it indicates positive momentum, it suggests that bulls are losing some steam. It warrants caution rather than an immediate sell signal, especially if the trend continues to show underlying strength.
How will upcoming US Non-Farm Payrolls data potentially impact AUDUSD this week?
Stronger-than-expected NFP data could reinforce the Fed's hawkish outlook, strengthening the USD and pushing AUDUSD towards support at $0.70193. Conversely, weaker-than-expected data might fuel Fed pivot speculation, weakening the USD and potentially supporting a move towards resistance near $0.70871.
Bearish Scenario: Support Breakdown
45% ProbabilityNeutral Scenario: Range Consolidation
30% ProbabilityBullish Scenario: Resistance Breakout
25% ProbabilityThe AUDUSD pair currently sits at a critical juncture, reflecting a broader market indecision shaped by mixed technical signals and an uncertain fundamental outlook. While the immediate price action hovers near $0.70902, the underlying dynamics suggest that a period of consolidation or a potential shift in momentum is likely. The key support at $0.70193 and resistance at $0.70871 will be the focal points for traders. The upcoming economic data, particularly from the US and Australia, alongside central bank commentary, will be pivotal in dictating the next significant move. For now, managing risk and waiting for clearer signals remains the most prudent strategy, allowing the market to reveal its hand before committing capital.
Track markets in real-time
AI-powered analysis, technical indicators and real-time price data.
Join Our Telegram Channel
Breaking market news, AI analysis and trading signals instantly.
Join Channel