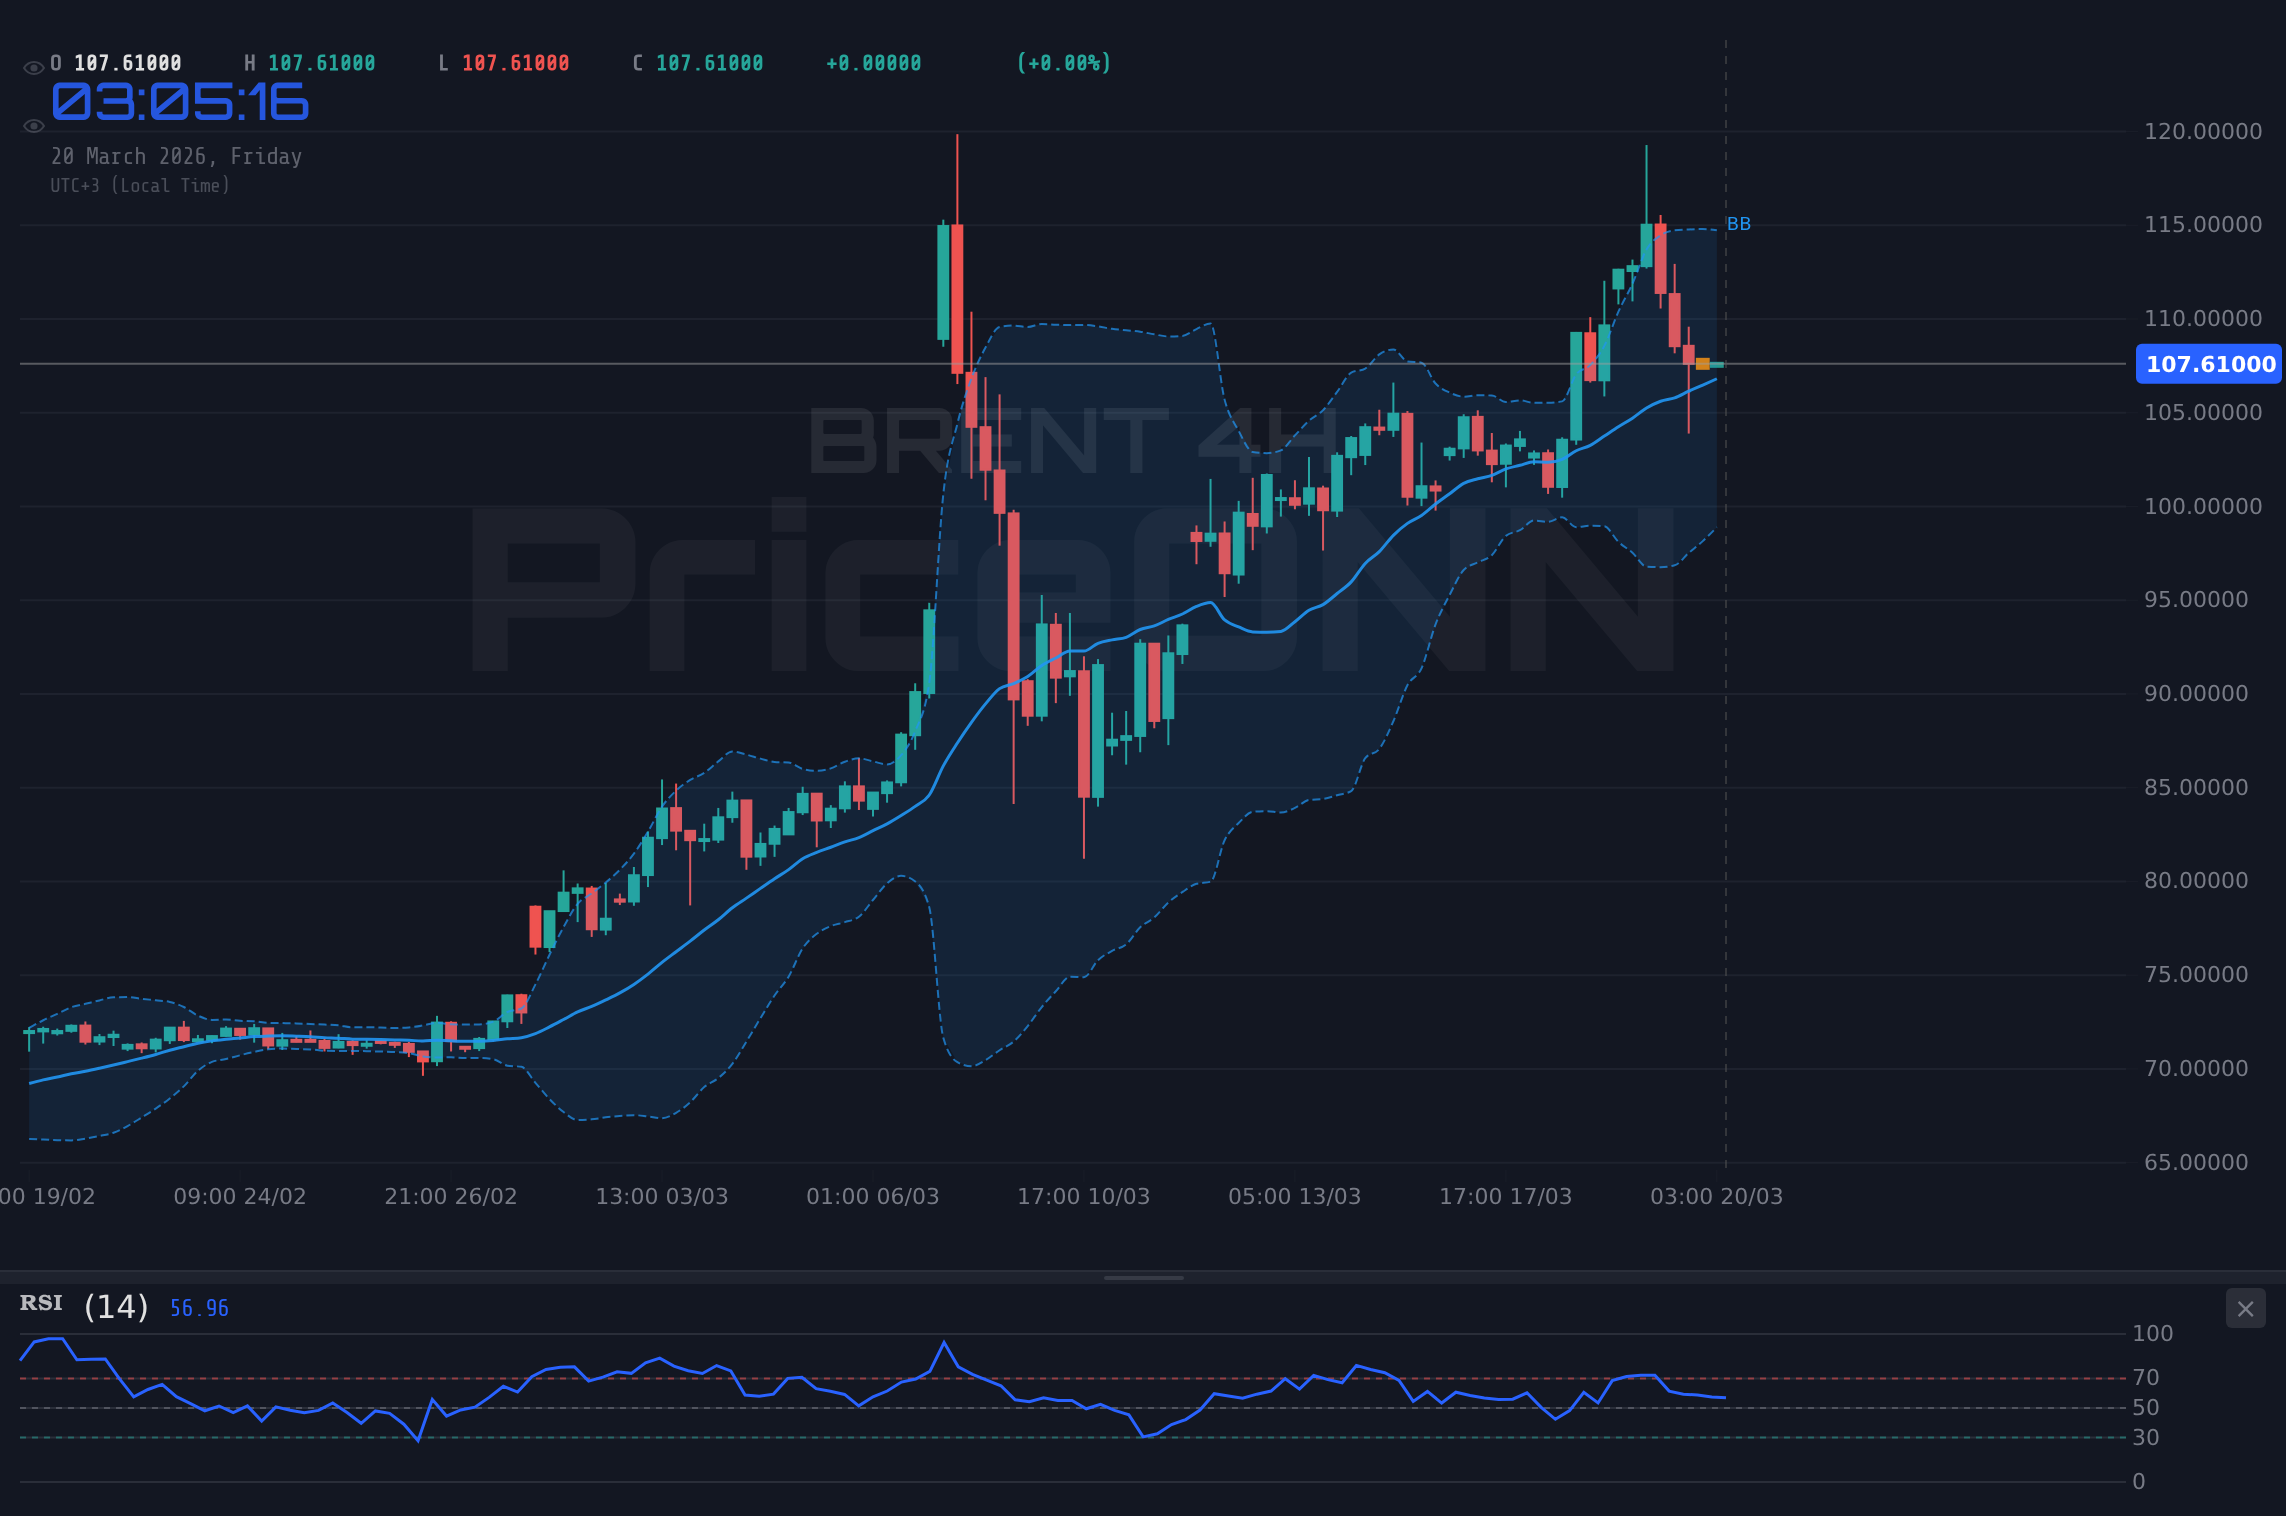
Brent Crude Tests $107.81: Will $114.31 Resistance Be Next?
Brent Crude is trading at $107.81, showing mixed signals. With key resistance at $114.31 and support at $102.74, the market is poised for a potential move.
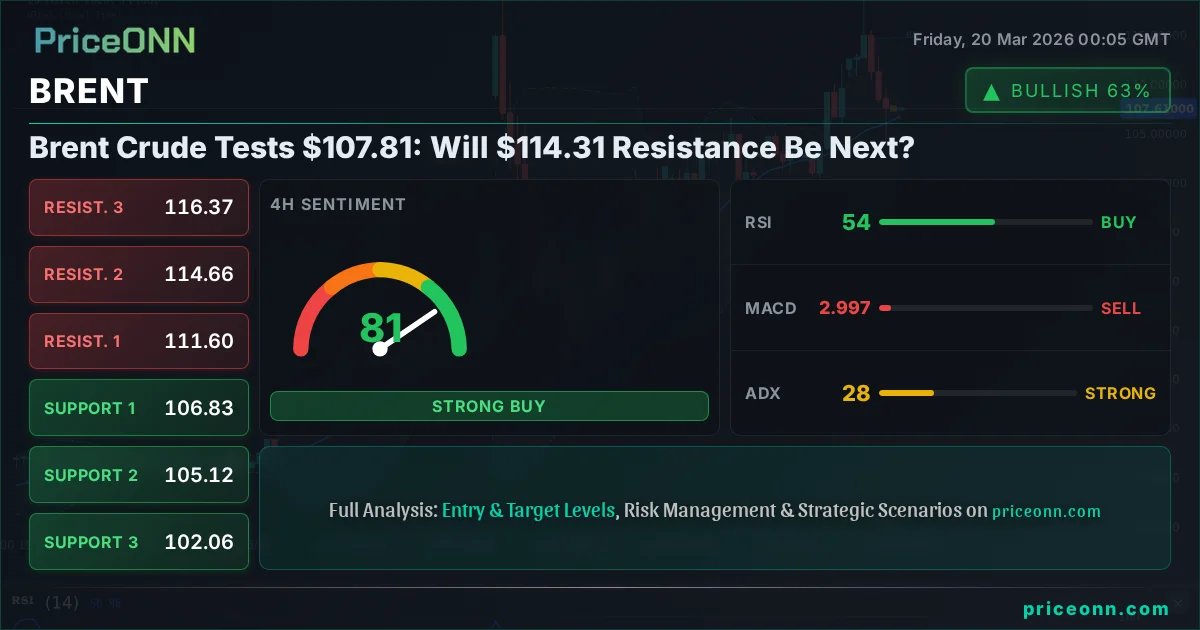
Brent Crude is currently navigating a critical juncture, trading at $107.81. The market is caught between conflicting technical signals and fundamental pressures, leaving traders and analysts to decipher the next likely move. With significant resistance levels looming above and crucial support zones below, the question on everyone's mind is whether the recent pullback signals a deeper correction or a temporary pause before a renewed push towards higher targets, potentially even the significant $114.31 mark. This analysis delves into the intricate dance of supply and demand, geopolitical undercurrents, and macroeconomic forces shaping Brent's immediate future.
- RSI at 39.8 on the 1H chart signals bearish pressure, while the 1D RSI at 80.31 indicates overbought conditions, suggesting potential for a reversal or consolidation.
- Critical support sits at $102.74, tested during the recent pullback, while the key resistance level to watch is $114.31.
- The MACD histogram on the 1H chart shows negative momentum, but the 1D chart displays positive momentum, indicating conflicting trends across timeframes.
- Geopolitical tensions in the Middle East and central bank policies are key drivers influencing Brent's correlation with the DXY, currently at 99.08.
The Battle for $107.81: A Tale of Two Trends
Brent Crude's current price action at $107.81 paints a complex picture, reflecting a tug-of-war between bullish momentum and bearish pressures. On the 1-hour timeframe, the trend is neutral with a power score of 50%, supported by a strong bearish ADX of 32.95. This suggests that while short-term fluctuations might occur, the underlying bearish sentiment is substantial. The MACD is painting a negative momentum, and the RSI at 39.8 indicates traders are not yet willing to push prices higher, leaning towards a cautious approach. However, this short-term picture is contrasted by the daily chart's strong bullish trend (100% power score). Here, the RSI at a lofty 80.31 screams 'overbought,' a condition that historically precedes significant pullbacks or consolidations. This divergence across timeframes is precisely what makes the $107.81 level so pivotal. It's a battleground where the short-term bearish leanings clash with the longer-term bullish conviction, creating an environment ripe for volatility.
The 4-hour chart adds another layer to this complexity. It registers a strong bullish trend (94% power score) with an RSI of 54.39, suggesting that the medium-term outlook is still leaning positive. However, the MACD is currently showing negative momentum, and the Stochastic oscillator is giving a bearish signal (%K < %D), hinting at a potential short-term reversal within this bullish trend. This nuanced view highlights the importance of watching for confirmations. A break below the immediate support at $105.03 on the 1H chart, for instance, could signal a deeper correction, while a sustained move above the 1H resistance at $109.06 might reignite bullish sentiment. The market is essentially waiting for a clearer signal, and any catalyst could tip the scales.
Fundamentally, the oil market remains highly sensitive to geopolitical developments and central bank policies. Recent news of escalating Middle East tensions and concerns about Cuba's power grid following a US oil blockade injects significant risk premium into crude prices. Simultaneously, the Federal Reserve's hawkish commentary, dampening rate cut hopes for 2026, coupled with anticipated rate holds from the SNB, BoE, and ECB, creates a complex global macroeconomic backdrop. The strengthening DXY, currently at 99.08, further complicates the picture, typically exerting downward pressure on dollar-denominated commodities like Brent. This interplay of factors underscores why Brent's price action at $107.81 is so closely watched; it's a confluence point where global macro trends meet specific market mechanics.
The Bull's Roadmap: Targeting $114.31 and Beyond
For the bulls to regain firm control and push Brent Crude towards the significant resistance level of $114.31, several conditions must be met. Firstly, price action needs to decisively break and hold above the immediate 1-hour resistance at $109.06. This level has acted as a cap in recent trading sessions, and a clear breach would signal a shift in short-term momentum. Crucially, this breakout needs to be accompanied by increasing trading volumes, confirming institutional conviction. On the daily chart, the RSI at 80.31 is a significant hurdle; bulls need to see this indicator cool slightly or, at the very least, not push into extreme overbought territory above 85, which could signal an unsustainable rally.
Furthermore, the fundamental backdrop needs to align. Any de-escalation in geopolitical tensions would typically weigh on oil prices, so a sustained or worsening conflict scenario in the Middle East would be a necessary catalyst for a bullish move. From a macroeconomic perspective, a dovish shift in central bank rhetoric, or data suggesting inflation is cooling faster than expected, could weaken the DXY (currently at 99.08) and provide additional support for Brent. The ADX on the daily chart, while strong at 63.48, indicates a powerful trend is already in place; bulls are essentially looking to extend this trend rather than initiate a new one. A break above $109.06, followed by consolidation above this level, would then open the door for a test of the next resistance at $110.50, and subsequently the psychologically important $114.31. If this bullish scenario plays out, we could see Brent re-test its recent highs.
The 4-hour trend, which is currently bullish, would need to remain intact, with the Stochastic oscillator moving out of its overbought territory and confirming upward momentum. The key is confirmation across multiple timeframes. A bullish close above $109.06 on the 1-hour chart, coupled with a daily candle that doesn't show extreme overextension, would be a strong signal. Traders would be looking for follow-through buying interest in the subsequent sessions, aiming for the $110.50 and $114.31 levels. This roadmap requires a confluence of technical strength and supportive fundamental drivers. Anything less might result in a short-lived rally that fails to break the longer-term bearish sentiment reflected in some of the shorter-term indicators.
Where Bears Take Control: The Risk of a Drop to $102.74
The bearish case for Brent Crude hinges on the confluence of short-term technical weakness and potential shifts in the fundamental landscape. The 1-hour chart already shows a bearish trend with a strong ADX (32.95) and negative MACD momentum. A break below the immediate 1-hour support at $105.03 would be the first clear sign that the bears are gaining the upper hand. This would likely trigger a cascade of selling as short-term traders exit positions and potentially attract further bearish entries aiming for lower targets.
The daily chart's extremely overbought RSI (80.31) is a significant vulnerability. A reversal from this level, especially if accompanied by negative news flow or a de-escalation of geopolitical tensions, could accelerate downward price action. The crucial support level to watch in this scenario is $102.74. A decisive break below $105.03 would likely see prices rapidly testing this next key support zone. Below $102.74, the next significant level is $95.82, which would represent a substantial correction from current levels.
From a fundamental perspective, any unexpected de-escalation in the Middle East, coupled with a stronger-than-expected US Dollar (DXY at 99.08), could provide the catalyst for a bearish move. Furthermore, if upcoming economic data, such as inflation reports or central bank communications, signal a more aggressive stance on inflation control, it could dampen demand expectations for oil. The strong daily trend (100% power score) means that a reversal would need significant impetus, but the overbought RSI is a clear warning sign. If the bears manage to push price below $105.03, the path of least resistance could lead quickly towards $102.74, and potentially lower if broader market sentiment turns risk-averse.
The 4-hour chart, despite its bullish trend signal, also shows signs of potential weakness. The Stochastic oscillator's bearish signal (%K < %D) and the MACD's negative momentum suggest that even within the medium-term uptrend, a pullback is plausible. A break below the 4-hour support at $106.83 would further validate the bearish short-term outlook. The key for bears is to break the established upward structure and capitalize on the stretched daily RSI. If these conditions materialize, the $102.74 support level becomes a very realistic target within the next few trading sessions.
The Waiting Game: Consolidation Around $107.81
While a decisive move in either direction is possible, there's also a scenario where Brent Crude consolidates around the current $107.81 level. This typically occurs when conflicting technical signals and equally balanced fundamental drivers create market indecision. On the 1-hour chart, the neutral trend and the ADX reading of 32.95 (indicating a strong trend, but not necessarily the direction) could support a range-bound environment if neither the bulls nor the bears can establish dominance.
For consolidation to persist, price action would likely remain capped by the 1-hour resistance at $109.06 and supported by the 1-hour support at $105.03. Within this range, the daily overbought RSI (80.31) would gradually cool, reducing the immediate risk of a sharp reversal, while the short-term bearish indicators would also fail to gain significant traction. This 'waiting game' could continue until a significant catalyst emerges, such as a major geopolitical development, a surprise central bank announcement, or a key economic data release that shifts the market's overall risk appetite.
The ADX on the daily timeframe, while strong, needs to be interpreted carefully. A strong ADX can persist even in a sideways market if the volatility is high but lacks a clear directional bias. However, the current readings suggest a directional bias is present, making prolonged consolidation less likely unless opposing forces perfectly counteract each other. If Brent remains stuck between $105.03 and $109.06, traders might look for intraday opportunities within the range, but the overall market sentiment would likely remain cautious, awaiting a clearer signal for a sustained trend.
Probability Assessment: The Bearish Lean
Evaluating the current technical and fundamental landscape, the most probable scenario for Brent Crude in the short to medium term appears to be a bearish continuation or significant consolidation, leaning towards a test of lower levels. The 1-hour and 4-hour charts exhibit bearish characteristics or conflicting signals that suggest the recent upward momentum is faltering. The strong bearish ADX on the 1-hour chart (32.95) and the negative MACD momentum are significant indicators of short-term weakness. While the daily chart shows a strong bullish trend, the RSI at 80.31 is a glaring warning sign of an overextended market, making it highly susceptible to a pullback.
The probability of a bearish scenario playing out is estimated at around 60%. This is primarily driven by the daily overbought condition and the conflicting signals on shorter timeframes, which often precede a correction. The immediate trigger would be a break below the $105.03 support level. If this occurs, the target towards $102.74 becomes highly probable. The invalidation of this bearish thesis would be a decisive close above the $109.06 resistance, suggesting the bulls have managed to overcome the short-term headwinds.
The neutral consolidation scenario is assigned a 30% probability. This outcome is plausible if geopolitical tensions remain elevated, providing a floor for prices, while macroeconomic headwinds and a strong dollar prevent a significant rally. Price action would likely oscillate between the $105.03 support and $109.06 resistance. The bullish scenario, targeting $114.31, is considered the least probable at 10% in the immediate term, primarily due to the daily overbought RSI and the current conflicting signals on shorter timeframes. For a bullish breakout to occur, a significant shift in market sentiment, coupled with a clear fundamental catalyst, would be required.
Bearish Scenario: The Pullback Intensifies
60% ProbabilityNeutral Scenario: The Waiting Game
30% ProbabilityBullish Scenario: Resistance Breakthrough
10% ProbabilityWhat I'm Watching This Week
As traders navigate the current market environment, several key catalysts will be crucial in determining Brent Crude's direction. Firstly, I'll be closely monitoring any further developments in the Middle East. Escalating tensions could provide a significant boost to oil prices, validating the bullish scenario, while de-escalation could trigger the bearish breakdown. News regarding OPEC+ production decisions or commentary from member states will also be critical.
Secondly, the macroeconomic data calendar is packed with potential volatility drivers. Upcoming inflation reports (CPI, PCE) and employment figures (NFP) in major economies will heavily influence central bank policy expectations. If these reports suggest persistent inflation or a tight labor market, it could lead to a stronger DXY (currently 99.08) and put further pressure on Brent. Conversely, signs of cooling inflation could weaken the dollar and support oil prices. Pay close attention to commentary from the Federal Reserve and other major central banks; any hints of a policy shift could dramatically alter the market's outlook.
Finally, technical price action around the key levels of $105.03 (support) and $109.06 (resistance) will be paramount. A decisive break of either level, especially on increased volume, will likely dictate the short-to-medium term trend. Observing how the daily RSI (currently 80.31) behaves as it approaches potential resistance or pullbacks will also be vital for gauging the sustainability of any move. Patience and risk management remain key as the market seeks direction.
Frequently Asked Questions: BRENT Analysis
What happens if BRENT breaks below $105.03 support?
A break below the $105.03 support level on the 1-hour chart would likely trigger further selling pressure, potentially targeting the key support zone at $102.74. This would invalidate the bullish short-term outlook and lean towards the bearish scenario.
Should I consider buying BRENT at current levels of $107.81 given the daily RSI is 80.31?
Buying at $107.81 with the daily RSI at 80.31 carries significant risk, as it signals an overbought condition. While a short-term pullback might occur, a confirmed break above $109.06 resistance would be needed to signal a potentially sustainable bullish continuation.
Is the MACD negative momentum on the 1-hour chart a sell signal for BRENT?
The negative MACD momentum on the 1-hour chart suggests short-term bearish pressure. However, it should be considered alongside other indicators and the strong bullish trend on the daily chart. A confirmed break below $105.03 would strengthen this sell signal.
How will the DXY at 99.08 and Middle East tensions affect BRENT this week?
The DXY at 99.08 exerts downward pressure on BRENT. However, escalating Middle East tensions could override this, potentially driving prices higher due to risk premiums. The market is balancing these opposing forces, making directional clarity crucial.
Technical Outlook Summary
| Indicator | Value | Signal | Interpretation |
|---|---|---|---|
| RSI (14) | 39.8 / 80.31 | Bearish / Overbought | 1H shows bearish pressure; 1D is extremely overbought. |
| MACD | Negative / Positive | Bearish / Bullish | Conflicting momentum across timeframes. |
| Stochastic | 25.36 / 66.77 | Bullish / Bullish | 1H shows potential reversal up; 1D shows upward momentum. |
| ADX | 32.95 / 63.48 | Strong Trend / Very Strong Trend | Indicates strong directional movement, but needs price confirmation. |
| Bollinger | Mid Band Below / Above | Bearish / Bullish | 1H below mid band, 1D above mid band. |
Key Levels
Support Levels
Resistance Levels
Track markets in real-time
AI-powered analysis, technical indicators and real-time price data.
Join Our Telegram Channel
Breaking market news, AI analysis and trading signals instantly.
Join Channel