NZDUSD Tests $0.58055 Support Amidst Shifting Market Sentiment
NZDUSD is trading at $0.58756, testing critical support at $0.58055. Bears are pressing as the 1D trend weakens, while 1H and 4H indicators offer mixed signals.
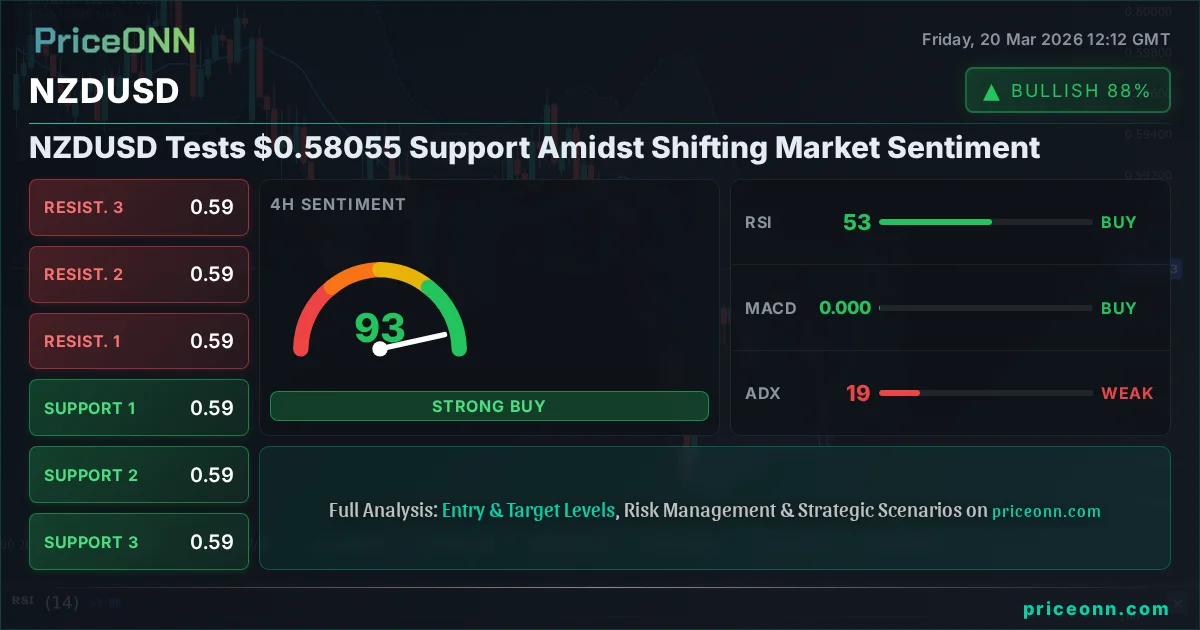
The New Zealand Dollar against the US Dollar, or NZDUSD, finds itself at a crucial juncture, currently trading at $0.58756. This level is being closely watched as the pair tests the significant support zone around $0.58055. The daily chart reveals a weakening trend, a stark contrast to the mixed signals observed across shorter timeframes, painting a complex picture for traders navigating this currency pair. Understanding the interplay of technical indicators and broader market sentiment is paramount for deciphering NZDUSD's next move.
- RSI on the 1D chart is at 46.92, indicating a bearish trend with room for further downside before reaching oversold territory.
- The critical support level to watch is $0.58055, the lowest daily support provided, which has historically acted as a floor.
- On the 1H timeframe, ADX at 30.93 suggests a strong trend is in play, though conflicting signals from Stochastic and MACD warrant caution.
- The strengthening US Dollar Index (DXY), currently at 99.12, is exerting downward pressure on NZDUSD, a correlation that bears watching closely.
Navigating the Bearish Tide on the Daily Chart
Daily Trend Weakens as Bears Eye $0.58055
The daily chart for NZDUSD presents a predominantly bearish outlook, with the trend strength currently assessed at 89%. The current price of $0.58756 is hovering above the first daily support level at $0.58055, but the downward momentum is palpable. The Relative Strength Index (RSI) on the daily timeframe sits at 46.92, a level that, while not yet oversold, clearly indicates a bearish inclination. This suggests that sellers have the upper hand, and further declines are possible before any significant buying pressure emerges. The Moving Average Convergence Divergence (MACD) also paints a negative picture, with the MACD line below its signal line, reinforcing the bearish sentiment. The Bollinger Bands are positioned below the middle band, indicating a downward price channel and suggesting that the current price action is following a bearish trajectory. The Average Directional Index (ADX) at 28.29 confirms a strong downtrend, signaling that significant momentum is behind the move. This confluence of indicators on the daily chart suggests that the path of least resistance for NZDUSD is downwards, making the $0.58055 support level a critical battleground.
Shorter Timeframes Offer Mixed Signals
1-Hour Chart: A Flicker of Hope or False Signal?
Switching to the 1-hour timeframe, the picture becomes more nuanced, offering a potential counterpoint to the daily bearishness. Here, the trend is classified as 'Neutral' with 50% strength, suggesting a potential pause or consolidation in the immediate short term. The current price of $0.58756 is navigating between immediate support at $0.58543 and resistance at $0.58650. The RSI is at 55.14, indicating a slight bullish bias, suggesting that buyers are attempting to push back. However, the MACD is showing negative momentum, and the Stochastic oscillator (%K at 25.33, %D at 44.14) is giving a bearish signal, with the %K line crossing below the %D line. The ADX at 30.93, however, points to a strong trend, which contradicts the neutral trend classification. This divergence in signals - a neutral trend classification but strong ADX, coupled with conflicting oscillator readings - creates a degree of uncertainty. It suggests that while a strong trend might be present, its direction is not clearly defined across all indicators on this very short timeframe.
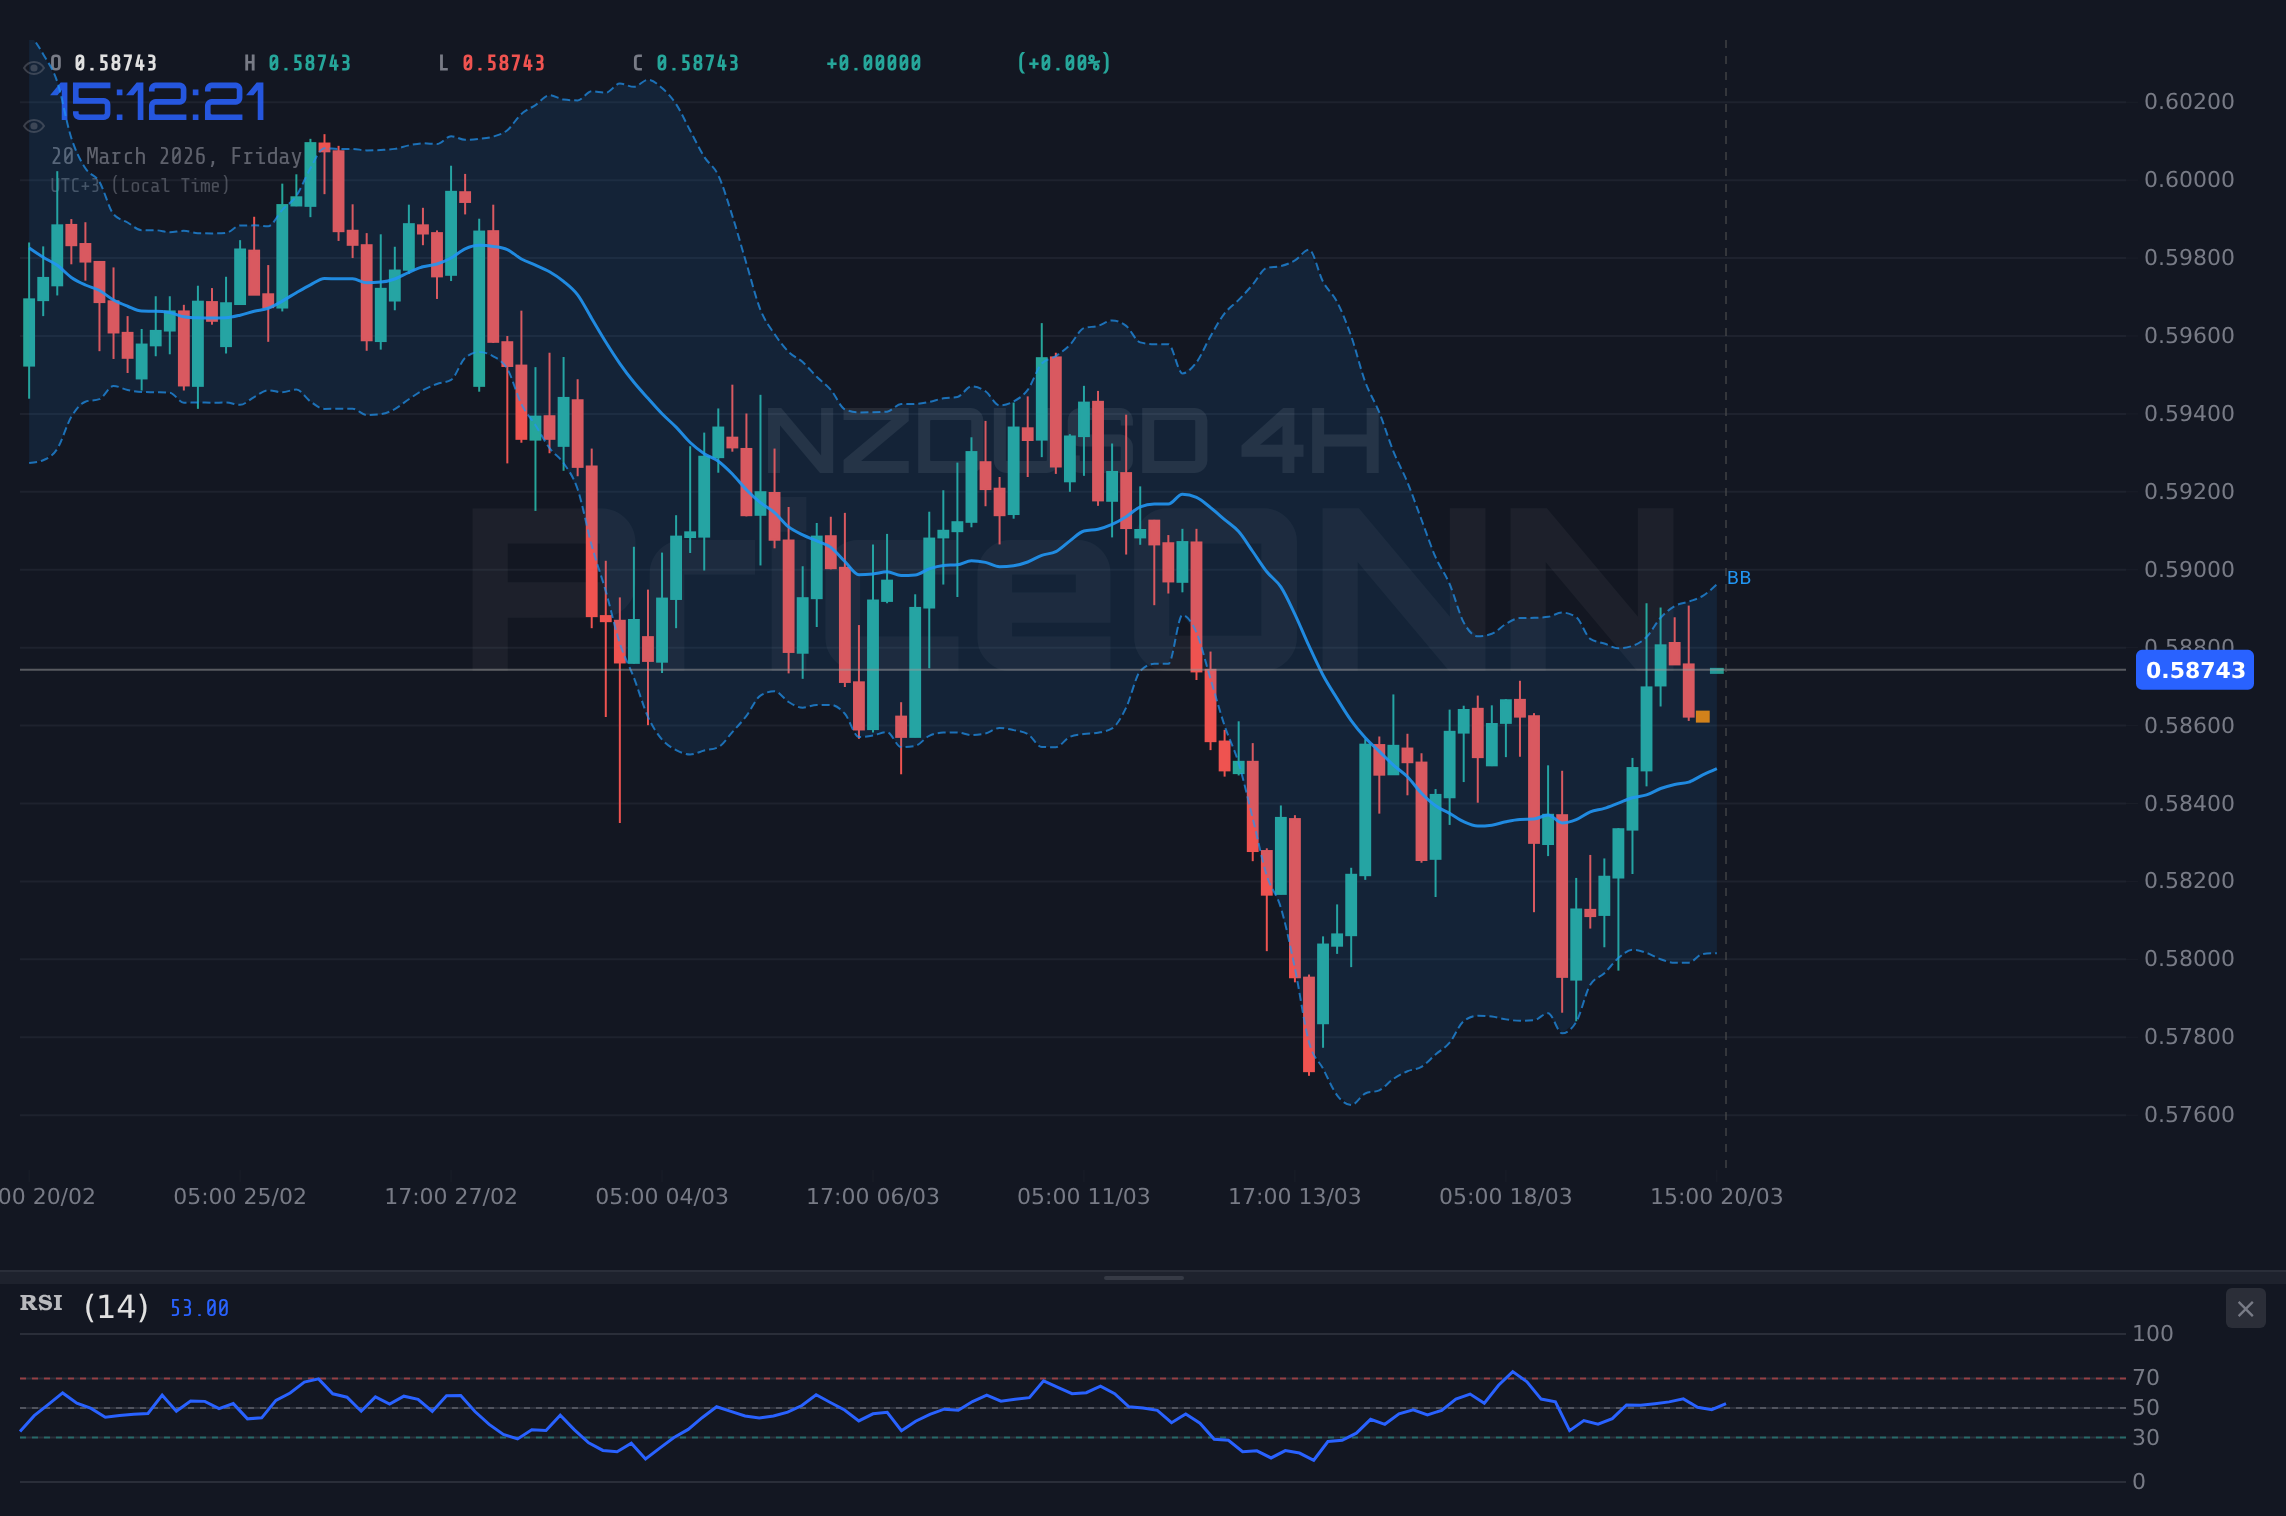
4-Hour Chart: A Tentative Rebound Attempt
The 4-hour chart presents another layer of complexity. Here, the trend is also neutral, with 50% strength, but the RSI at 48.66 leans slightly bearish, indicating that sellers are still in play. Yet, the MACD is showing positive momentum, with the MACD line above its signal line, a sign that buying pressure might be building. The Stochastic oscillator (%K at 71.43, %D at 55.34) is in overbought territory and showing a bullish signal, with %K crossing above %D. This is a strong buy signal from the Stochastic, often preceding a price increase. However, the Bollinger Bands are below the middle band, suggesting a bearish inclination, and the ADX at 18.47 indicates a weak trend, which means any upward movement might lack sustained power. This mixed bag of signals - a bearish RSI but a bullish Stochastic and positive MACD, all within a weak trend environment - highlights the choppiness often seen in intraday trading. It implies that while there might be short-term upward pressure, the conviction behind it is questionable.
The Dollar's Shadow: DXY's Influence
DXY Strength Pressuring NZDUSD
The broader market context, particularly the performance of the US Dollar Index (DXY), plays a significant role in the NZDUSD's trajectory. The DXY is currently trading at 99.12, showing a 0.21% daily gain. This strengthening dollar acts as a headwind for NZDUSD, as a stronger dollar typically makes the currency pair less attractive. The daily chart for DXY shows a bullish trend with 92% strength, reaching a resistance level around 99.72. This sustained strength in the dollar reinforces the bearish outlook for NZDUSD. When the DXY is on an upward trend, it often correlates with a downward move in pairs like NZDUSD, especially when the New Zealand economy faces its own headwinds or when global risk sentiment shifts away from commodity-linked currencies. The fact that the DXY is pushing higher while NZDUSD tests support underscores the bearish pressure being exerted by the greenback.
Key Levels and Potential Scenarios
The Critical $0.58055 Support Zone
The immediate focus for NZDUSD traders is the support level at $0.58055. This is the lowest support level provided in the daily data, and its holds or breaks will likely dictate the near-term direction. A decisive break below $0.58055 on the daily chart, confirmed by subsequent price action and strong volume, could trigger further downside towards the next support at $0.57411. This would solidify the bearish trend indicated by the daily indicators. Conversely, if $0.58055 holds firm, we could see a bounce. However, the strength of this bounce will be contingent on overcoming immediate resistance levels. The first resistance on the 1-hour chart is at $0.58650, followed by $0.58697 on the 4-hour chart. A sustained move above these levels, particularly above the 4-hour resistance at $0.58725, would be needed to challenge the daily bearish narrative.
Navigating the Conflicting Signals
The conflicting signals between the daily bearish trend and the mixed signals on shorter timeframes create a volatile environment. On the 1-hour chart, the ADX at 30.93 suggests a strong trend, yet the trend classification is neutral. This implies that while there's momentum, its direction is not definitively established across all indicators at this granular level. The 4-hour Stochastic is flashing a strong bullish signal from overbought territory, which could suggest a short-term reversal. However, the daily RSI at 46.92 and the strong DXY mean any upward move might be short-lived, potentially leading to a 'bear trap' scenario if the daily downtrend reasserts itself. Traders will need to look for confirmation: a clear break above daily resistance levels, accompanied by a shift in daily indicators, would be required to signal a significant bullish turn. Until then, the risk remains skewed to the downside.
What the Indicators Are Telling Us
RSI Divergence and Stochastic Signals
The RSI on the daily chart at 46.92, while bearish, is not yet in oversold territory. This leaves room for further decline. However, on the 4-hour chart, the RSI at 48.66 is also in neutral territory but trending upwards, suggesting some buyer interest returning. The Stochastic oscillator offers more clarity: on the 4-hour chart, it's showing a strong bullish signal from oversold levels (%K at 71.43, %D at 55.34), indicating a potential for a short-term upward move. Conversely, the 1-hour Stochastic is giving a bearish signal (%K at 25.33, %D at 44.14) from a neutral position. This divergence between the 4-hour bullish signal and the 1-hour bearish signal, set against the backdrop of a daily bearish trend, highlights the intraday trading complexity. Confirmation of any bullish move would likely require the 4-hour Stochastic to hold its bullish stance and for price to break key intraday resistance levels.
MACD and ADX: Confirming the Downtrend?
The MACD indicator provides a mixed bag across timeframes. On the 1-hour chart, it shows positive momentum, suggesting some upward pressure. However, on the 4-hour and daily charts, the MACD is firmly in negative territory, with the MACD line below its signal line. This indicates bearish momentum is dominant on the medium to longer terms. The ADX, a measure of trend strength, is particularly telling. On the 1-hour chart, it stands at 30.93, suggesting a strong trend. On the 4-hour, it's at 18.47, indicating a weak trend. The daily ADX at 28.29 points to a strong downtrend. This conflicting ADX reading between the 4-hour and other timeframes is significant. While the daily and 1-hour ADX suggest a strong trend, the 4-hour's weakness might imply that the current downtrend is facing headwinds or is in a phase of consolidation. Traders will be watching if the ADX on the 4-hour chart starts to climb, which would then align with the stronger trend signals seen elsewhere.
Fundamental Context and Future Outlook
Economic Calendar and Central Bank Influence
Looking ahead, upcoming economic data releases will be crucial for NZDUSD. While specific upcoming events for NZDUSD aren't detailed here, general market drivers remain paramount. The Reserve Bank of New Zealand (RBNZ) and the US Federal Reserve's monetary policies are key fundamental drivers. Any hawkish signals from the Fed, such as stronger economic data from the US (like upcoming employment figures or inflation reports) that could prompt further interest rate hikes or delay cuts, would likely strengthen the USD and put further downward pressure on NZDUSD. Conversely, softer US data or any indication of a dovish shift from the Fed could provide relief. Similarly, any dovish commentary or data from New Zealand would exacerbate the downward pressure. The correlation with the DXY at 99.12 is a constant reminder that US monetary policy expectations are a primary influence.
Geopolitical Ripples and Risk Sentiment
Geopolitical tensions, while not directly detailed for NZDUSD in the provided data, always cast a long shadow over currency markets, especially for commodity-linked currencies like the New Zealand Dollar. Events such as the ongoing Middle East tensions, which have sent oil prices soaring and created supply chain concerns, can impact global risk sentiment. In times of heightened geopolitical risk, investors often flock to safe-haven assets like the US Dollar, further strengthening the DXY and pressuring NZDUSD. If global risk appetite deteriorates, the Kiwi's performance, often seen as a riskier currency, could suffer more significantly. Conversely, a de-escalation of tensions and a return to risk-on sentiment could provide some support to NZDUSD, but this would need to overcome the prevailing bearish technicals and the strong dollar.
Trading Scenarios for NZDUSD
Bearish Scenario: Testing the Depths
65% ProbabilityNeutral Scenario: Consolidation Phase
25% ProbabilityBullish Scenario: A Reversal Attempt
10% ProbabilityFrequently Asked Questions: NZDUSD Analysis
What happens if NZDUSD breaks below the critical $0.58055 support level?
A daily close below $0.58055 would invalidate the current neutral stance and strongly confirm the bearish trend. This could trigger a rapid move towards the next support at $0.57411, as indicated by the daily technical outlook.
Is the RSI at 46.92 a sell signal for NZDUSD right now?
The daily RSI at 46.92 is in bearish territory but not yet oversold, suggesting further downside potential rather than an immediate buy signal. A sustained move below 50 indicates bearish momentum is building.
How will the strengthening DXY at 99.12 affect NZDUSD's price forecast?
The DXY's current strength at 99.12, with a bullish daily trend, typically exerts downward pressure on NZDUSD. This correlation suggests that a stronger dollar could push NZDUSD towards its support levels unless other factors intervene.
Should traders consider buying NZDUSD if it bounces from the $0.58055 support?
A bounce from $0.58055 could offer a short-term trading opportunity, but caution is advised given the daily bearish trend. Confirmation would be needed, such as a break above immediate resistance levels like $0.58650, and positive shifts in daily indicators before considering a sustained bullish position.
| Indicator | Value | Signal | Interpretation |
|---|---|---|---|
| RSI (14) [1H] | 55.14 | Neutral | Slightly bullish bias, but watch for reversals |
| RSI (14) [4H] | 48.66 | Bearish | Below 50, indicating seller pressure |
| RSI (14) [1D] | 46.92 | Bearish | In bearish territory, room to fall |
| MACD [1H] | +0.0003 | Bullish | Positive momentum building |
| MACD [4H] | -0.0004 | Bearish | Negative momentum dominant |
| MACD [1D] | -0.0011 | Bearish | Strong bearish momentum |
| Stochastic [1H] | K:25.33 D:44.14 | Bearish | %K below %D, bearish signal |
| Stochastic [4H] | K:71.43 D:55.34 | Bullish | %K above %D in overbought, potential reversal |
| Stochastic [1D] | K:39.41 D:28.78 | Bullish | %K above %D, potential bounce |
| ADX [1H] | 30.93 | Strong Trend | High ADX indicates strong trend presence |
| ADX [4H] | 18.47 | Weak Trend | Low ADX suggests consolidation or lack of conviction |
| ADX [1D] | 28.29 | Strong Trend | High ADX confirms strong downtrend |
Track markets in real-time
AI-powered analysis, technical indicators and real-time price data.
Join Our Telegram Channel
Breaking market news, AI analysis and trading signals instantly.
Join Channel