USDJPY Approaches $158.62 Resistance: A Critical Juncture
USDJPY hovers near $158.62 resistance. With mixed signals and strong ADX readings, traders eye upcoming events for direction.
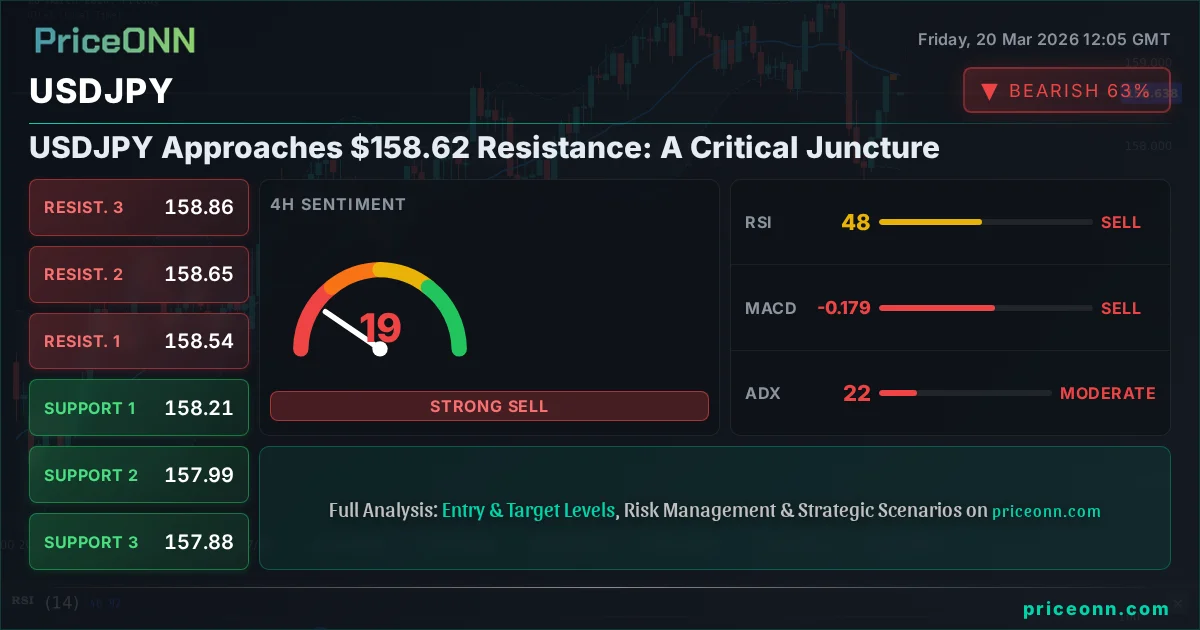
The USDJPY currency pair is currently trading at $158.62, finding itself at a critical juncture as it approaches a significant resistance level. This strategic position, occurring amidst a complex interplay of technical indicators and fundamental drivers, demands a nuanced understanding for traders aiming to navigate the pair's potential future movements. The recent price action and the underlying economic currents suggest a period of heightened volatility and decision-making may be on the horizon.
- USDJPY is trading at $158.62, testing resistance levels around $158.845.
- The 1-hour chart shows a neutral trend with a strong ADX of 37.07, while the 1-day chart signals a strong downtrend (ADX: 37.37).
- Mixed signals from RSI and Stochastic across timeframes highlight indecision, with the 1-day RSI at 56.88 and the 4-hour at 47.45.
- Upcoming economic events, particularly from the US, will be crucial in determining the next direction, especially given the correlation with DXY's strength.
The current price of $158.62 places USDJPY precariously close to the $158.845 resistance mark on the 1-hour chart. This proximity is not merely a numerical observation; it represents a battleground where the forces of supply and demand are poised to determine the short-term trajectory of the pair. While the 1-hour timeframe presents a somewhat neutral picture with a strong ADX of 37.07 suggesting a committed trend, the daily chart paints a different story, indicating a strong downtrend with an ADX of 37.37. This divergence in trend strength across different timeframes underscores the complexity of the current market environment and the need for careful analysis.
Examining the technical indicators reveals a mosaic of conflicting signals. On the 1-hour chart, the RSI(14) stands at 54.16, indicating a slight upward bias within the neutral zone, suggesting some buying momentum might be building. However, the Stochastic oscillator shows %K at 77.53 and %D at 90.26, a bearish signal as %K is below %D and nearing overbought territory, hinting at potential selling pressure. The MACD is in positive momentum, with the MACD line above the signal line, which typically supports a bullish outlook, yet this is counterbalanced by the Stochastic's bearish leanings and the overall strong ADX reading.
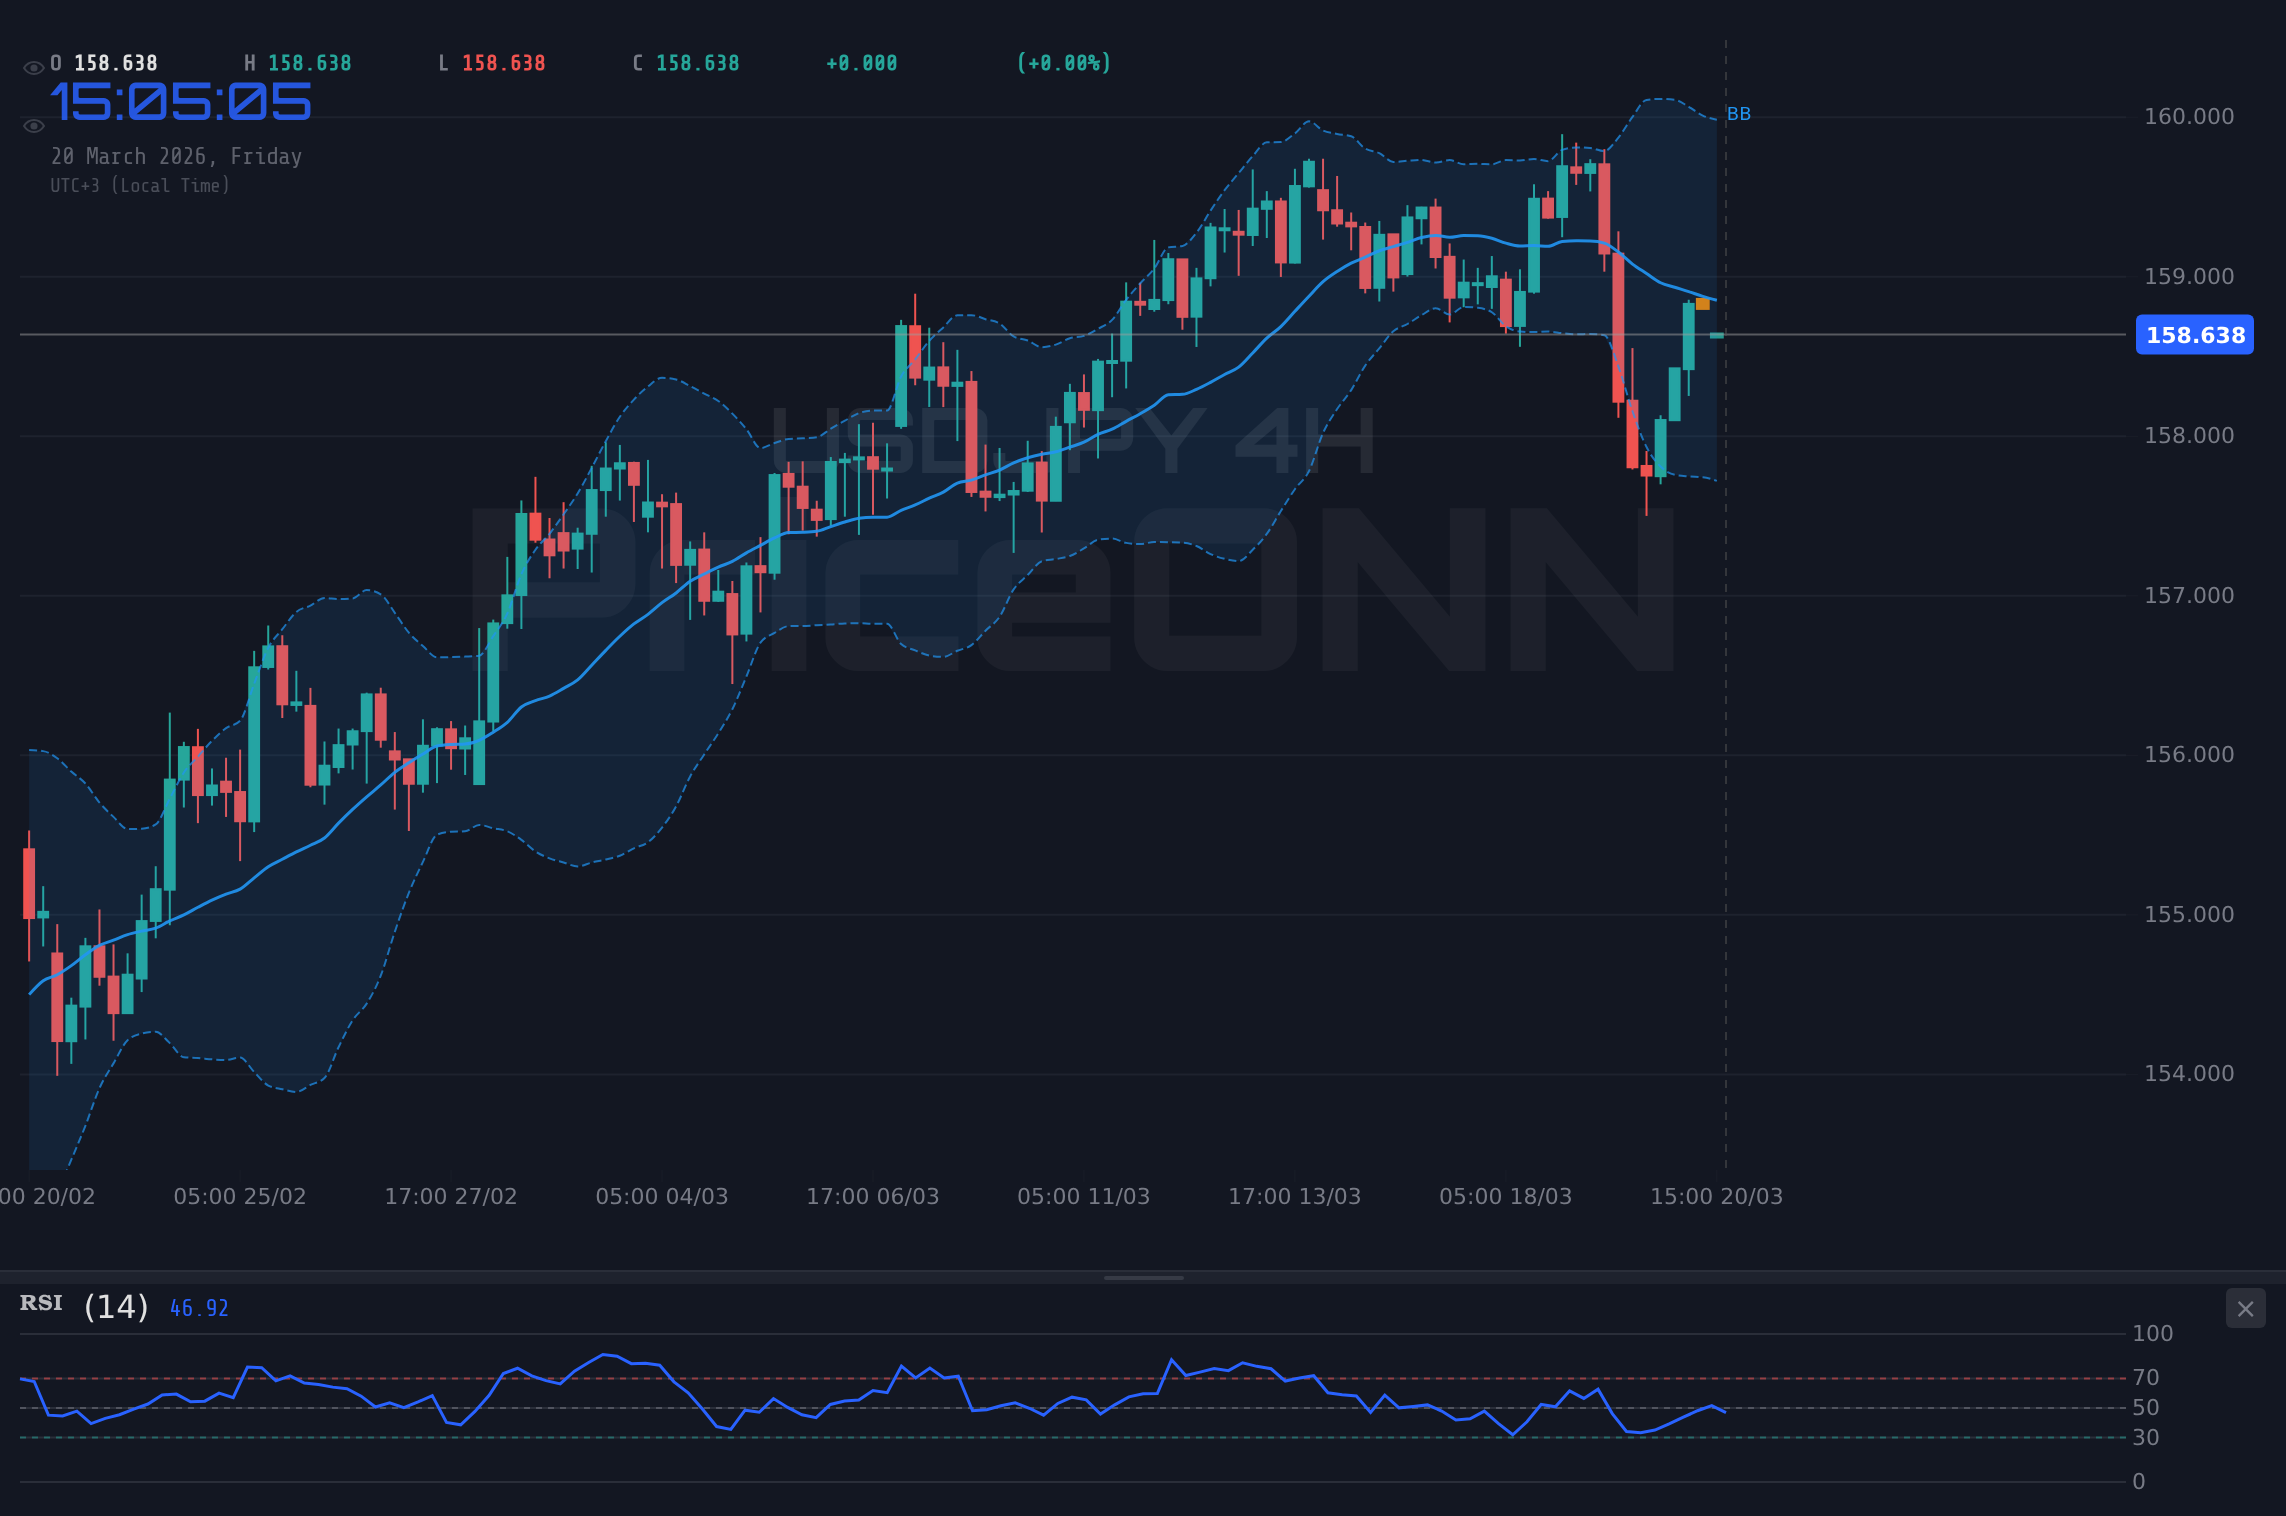
Moving to the 4-hour timeframe, the picture becomes even more intricate. The RSI(14) is at 47.45, leaning towards a bearish sentiment, suggesting a potential pullback. Conversely, the Stochastic oscillator's %K is at 37.25 and %D at 23.62, presenting a bullish signal with %K crossing above %D and moving out of oversold territory. The MACD here is in negative momentum, below its signal line, reinforcing a bearish bias. The ADX at 21.92 indicates a moderate trend, less committed than the 1-hour chart, adding another layer of ambiguity. This conflicting data across hourly and 4-hourly charts necessitates a cautious approach, as neither a clear bullish nor bearish conviction emerges.
The daily timeframe provides a broader perspective, and here, the trend is predominantly seen as neutral, although the ADX at 37.37 points to a strong trend, which is somewhat contradictory to the 'neutral' trend classification. The RSI(14) is at 56.88, firmly in the neutral zone and showing a slight upward bias, suggesting room for further appreciation before entering overbought territory. The MACD is displaying positive momentum, with the MACD line above the signal line, which aligns with a potential bullish development. However, the Stochastic oscillator's %K at 54.15 and %D at 78.57 presents a bearish signal, with %K falling below %D and indicating a potential downward correction. This mixed bag of daily signals - bullish MACD and RSI versus bearish Stochastic - highlights the critical resistance level around $158.845 as a significant hurdle.
The Dollar Index (DXY) currently stands at 99.18, showing a daily increase of 0.28%. A strengthening dollar typically exerts downward pressure on currency pairs like USDJPY, especially when the Bank of Japan maintains its accommodative monetary policy. The DXY's current upward momentum, supported by a strong daily trend (ADX: 34.64), suggests that the dollar might continue to find strength, which could act as a headwind for USDJPY's ascent towards higher resistance levels. Investors are closely watching the DXY's ability to break above its daily resistance at 99.72, as a decisive move there could amplify selling pressure on USDJPY.
The correlation between USDJPY and the DXY is a crucial element for traders to monitor. When the DXY strengthens, it often implies increased demand for the US dollar, which, in turn, can lead to USDJPY climbing higher, assuming the Japanese Yen remains weaker. However, the presence of the Bank of Japan's intervention threat, aimed at curbing excessive Yen weakness, adds a layer of complexity. The market remains sensitive to any hints of direct intervention or policy shifts from the BoJ, which could dramatically alter USDJPY's correlation with the dollar's broader movements.
From a fundamental perspective, the divergence in monetary policy between the US Federal Reserve and the Bank of Japan remains a primary driver for USDJPY. While the Fed has been navigating a path of policy tightening or maintaining higher rates to combat inflation, the BoJ has largely maintained its ultra-loose monetary stance. This policy differential fuels carry trades and supports a higher USDJPY, but the persistent threat of Japanese intervention to support the Yen introduces significant volatility and uncertainty. Any subtle shift in rhetoric or data from either central bank could trigger substantial price action.
Looking at upcoming economic events, the market will be keenly focused on US economic data releases. Key indicators such as Non-Farm Payrolls (NFP), Consumer Price Index (CPI), and Producer Price Index (PPI) reports, alongside Federal Reserve statements, will play a pivotal role in shaping Fed rate expectations. Higher-than-expected inflation or employment figures could reinforce the Fed's hawkish stance, potentially strengthening the dollar and pushing USDJPY higher, provided the BoJ remains on its current path. Conversely, weaker data might lead to a reassessment of Fed policy, potentially weakening the dollar and creating an opportunity for Yen strength.
The Japanese side will also be under scrutiny. While the Bank of Japan has signaled a potential exit from negative interest rates, the pace and timing of any policy normalization remain uncertain. Any indication of a more hawkish shift from the BoJ, such as further hints at rate hikes or adjustments to yield curve control, could lead to a significant strengthening of the Yen, putting downward pressure on USDJPY. The market's interpretation of inflation data and wage growth in Japan will be critical in gauging the likelihood and magnitude of any such policy changes.
The current technical setup, with USDJPY testing resistance near $158.62, suggests a potential for a short-term pullback or consolidation. The strong ADX readings across multiple timeframes indicate that a trend is present, but the conflicting signals from RSI and Stochastic across different charts create a high degree of uncertainty regarding the trend's direction. A sustained break above the $158.845 resistance, coupled with confirmation from bullish momentum indicators and a favorable fundamental backdrop, could signal a continuation of the uptrend. However, failure to break higher could lead to a retracement towards support levels, particularly the $158.629 mark on the 1-hour chart.
The recent news regarding the Yen's strength on Thursday, causing USD/JPY to fall over 1.25% to near 157.80, serves as a stark reminder of the pair's volatility and the potential for sharp reversals. This event highlights the sensitivity of USDJPY to shifts in market sentiment and intervention fears. Traders must remain vigilant, as such rapid moves can quickly invalidate established technical patterns and necessitate a rapid reassessment of market conditions. The current price action around $158.62 must be viewed within the context of this recent volatility.
The energy sector's performance, particularly Brent Crude oil testing $110, also plays an indirect role. Rising energy costs can fuel inflation concerns, potentially influencing central bank policies. While not a direct driver for USDJPY, persistent inflation in major economies could keep interest rate differentials wide, supporting USD strength. However, geopolitical tensions, such as a blockade at the Strait of Hormuz, could lead to risk-off sentiment, potentially benefiting the Yen as a safe-haven asset, thereby creating opposing forces on USDJPY.
Considering the confluence of factors - mixed technical signals, strong ADX readings indicating trend, a strengthening DXY, and the ever-present threat of BoJ intervention - USDJPY appears to be in a delicate balance. The immediate future likely hinges on key economic data releases and central bank commentary. A decisive move above $158.845 resistance, supported by fundamental catalysts, could open the door for further gains. Conversely, failure to overcome this resistance, coupled with any signs of Yen strength or intervention, could lead to a retracement towards the $158.629 support level.
The path forward for USDJPY is fraught with uncertainty, but clarity may emerge from key upcoming economic releases. Traders should maintain a close watch on US inflation and employment data, as well as any forward guidance from the Federal Reserve. Simultaneously, any communication from the Bank of Japan regarding its monetary policy stance will be critical. The current price of $158.62 represents a pivotal point, and the market's reaction to these upcoming events will likely dictate the pair's direction in the short to medium term. Patience and risk management will be paramount as the market seeks a clear directional bias.
Bearish Scenario: Yen Strength Prevails
55% ProbabilityNeutral Scenario: Consolidation Around Resistance
30% ProbabilityBullish Scenario: Dollar Dominance Continues
15% ProbabilityFrequently Asked Questions: USDJPY Analysis
What happens if USDJPY breaks above the $158.845 resistance level?
A sustained break above $158.845, particularly if supported by strong US economic data and hawkish Fed commentary, could signal a continuation of the uptrend. In such a scenario, the next targets would likely be around $158.977 and $159.061 on the hourly chart, indicating further dollar strength against the Yen.
Should I consider selling USDJPY at current levels near $158.62 given the mixed signals?
Selling at current levels carries risk due to the conflicting technical indicators and the strong ADX suggesting trend potential. A more prudent approach might be to wait for a clear break of support at $158.545 or a confirmed bearish signal on higher timeframes, especially if intervention fears or BoJ policy shifts emerge, which could trigger a move towards $157.80.
Is the RSI at 56.88 on the daily chart a buy signal for USDJPY?
An RSI of 56.88 on the daily chart is in the neutral zone, suggesting a slight upward bias but not a definitive buy signal. While it indicates room for potential appreciation before reaching overbought territory, it must be considered alongside other indicators. The bearish Stochastic signal and the strong daily ADX suggest caution is warranted, and confirmation from other indicators or a clear break of resistance would be needed.
How will upcoming US inflation data impact USDJPY's move near $158.62 resistance?
Higher-than-expected US inflation figures could reinforce the Federal Reserve's hawkish stance, potentially strengthening the dollar and pushing USDJPY towards resistance at $158.845 and beyond. Conversely, inflation coming in softer than anticipated might lead to a reassessment of Fed policy, weakening the dollar and potentially causing USDJPY to retreat towards support levels like $158.545.
Track markets in real-time
AI-powered analysis, technical indicators and real-time price data.
Join Our Telegram Channel
Breaking market news, AI analysis and trading signals instantly.
Join Channel