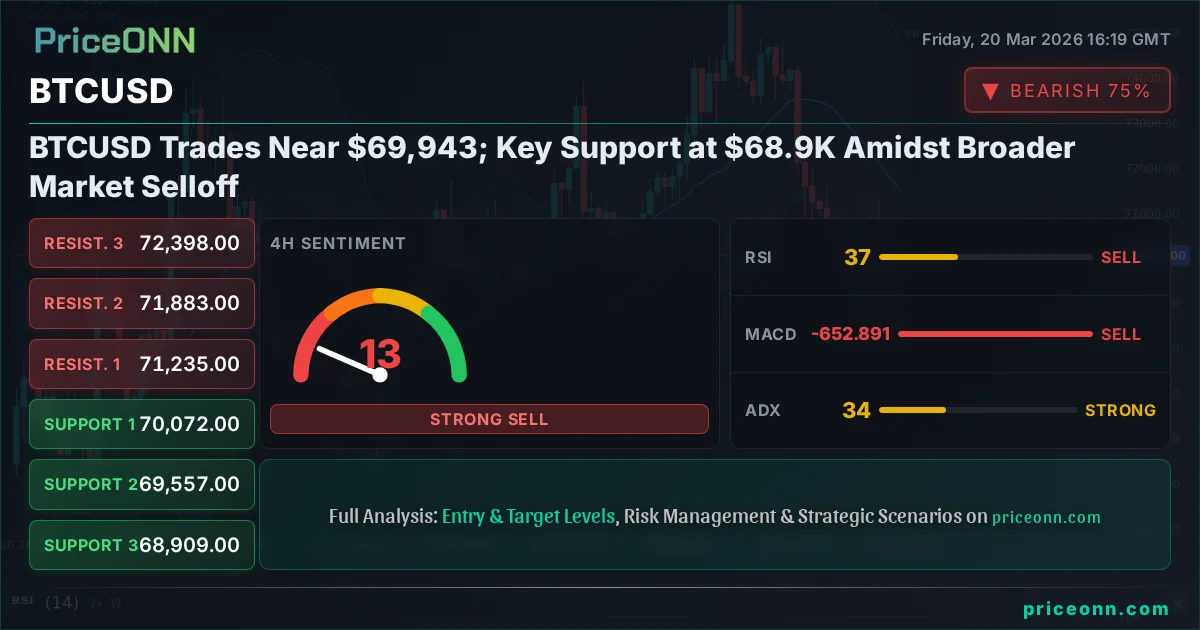
BTCUSD Trades Near $69,943; Key Support at $68.9K Amidst Broader Market Selloff
BTCUSD hovers around $69,943 as a broader market downturn pressures risk assets. Key support at $68,939.67 is under scrutiny. What's next?
The cryptocurrency market is holding its breath as BTCUSD consolidates near the crucial $69,943 level, a price point that has become a focal point for traders navigating a choppy broader market environment. Following a significant downturn across major risk assets, including a sharp decline in the S&P 500 and Nasdaq, Bitcoin is facing renewed headwinds. This analysis dives deep into the current BTCUSD price action, exploring the critical support and resistance levels, the technical indicators flashing mixed signals, and the macroeconomic backdrop that is shaping its trajectory. Understanding these factors is paramount for any trader looking to navigate the inherent volatility of the digital asset space, especially with key economic events on the horizon.
- BTCUSD is currently consolidating around $69,943, showing a neutral trend on the daily timeframe but with significant short-term bearish signals.
- Critical support for BTCUSD is identified at $68,939.67, a level that has seen multiple tests and could dictate short-term direction if breached.
- The RSI indicator at 48.17 suggests a neutral position but with a downward lean, indicating a lack of strong buying conviction.
- Macroeconomic correlation with the DXY, currently at 99.35 and trending upwards, suggests potential pressure on risk assets like Bitcoin.
The Bearish Scenario: Testing the Limits Around $68.9K
Navigating the Short-Term Downtrend
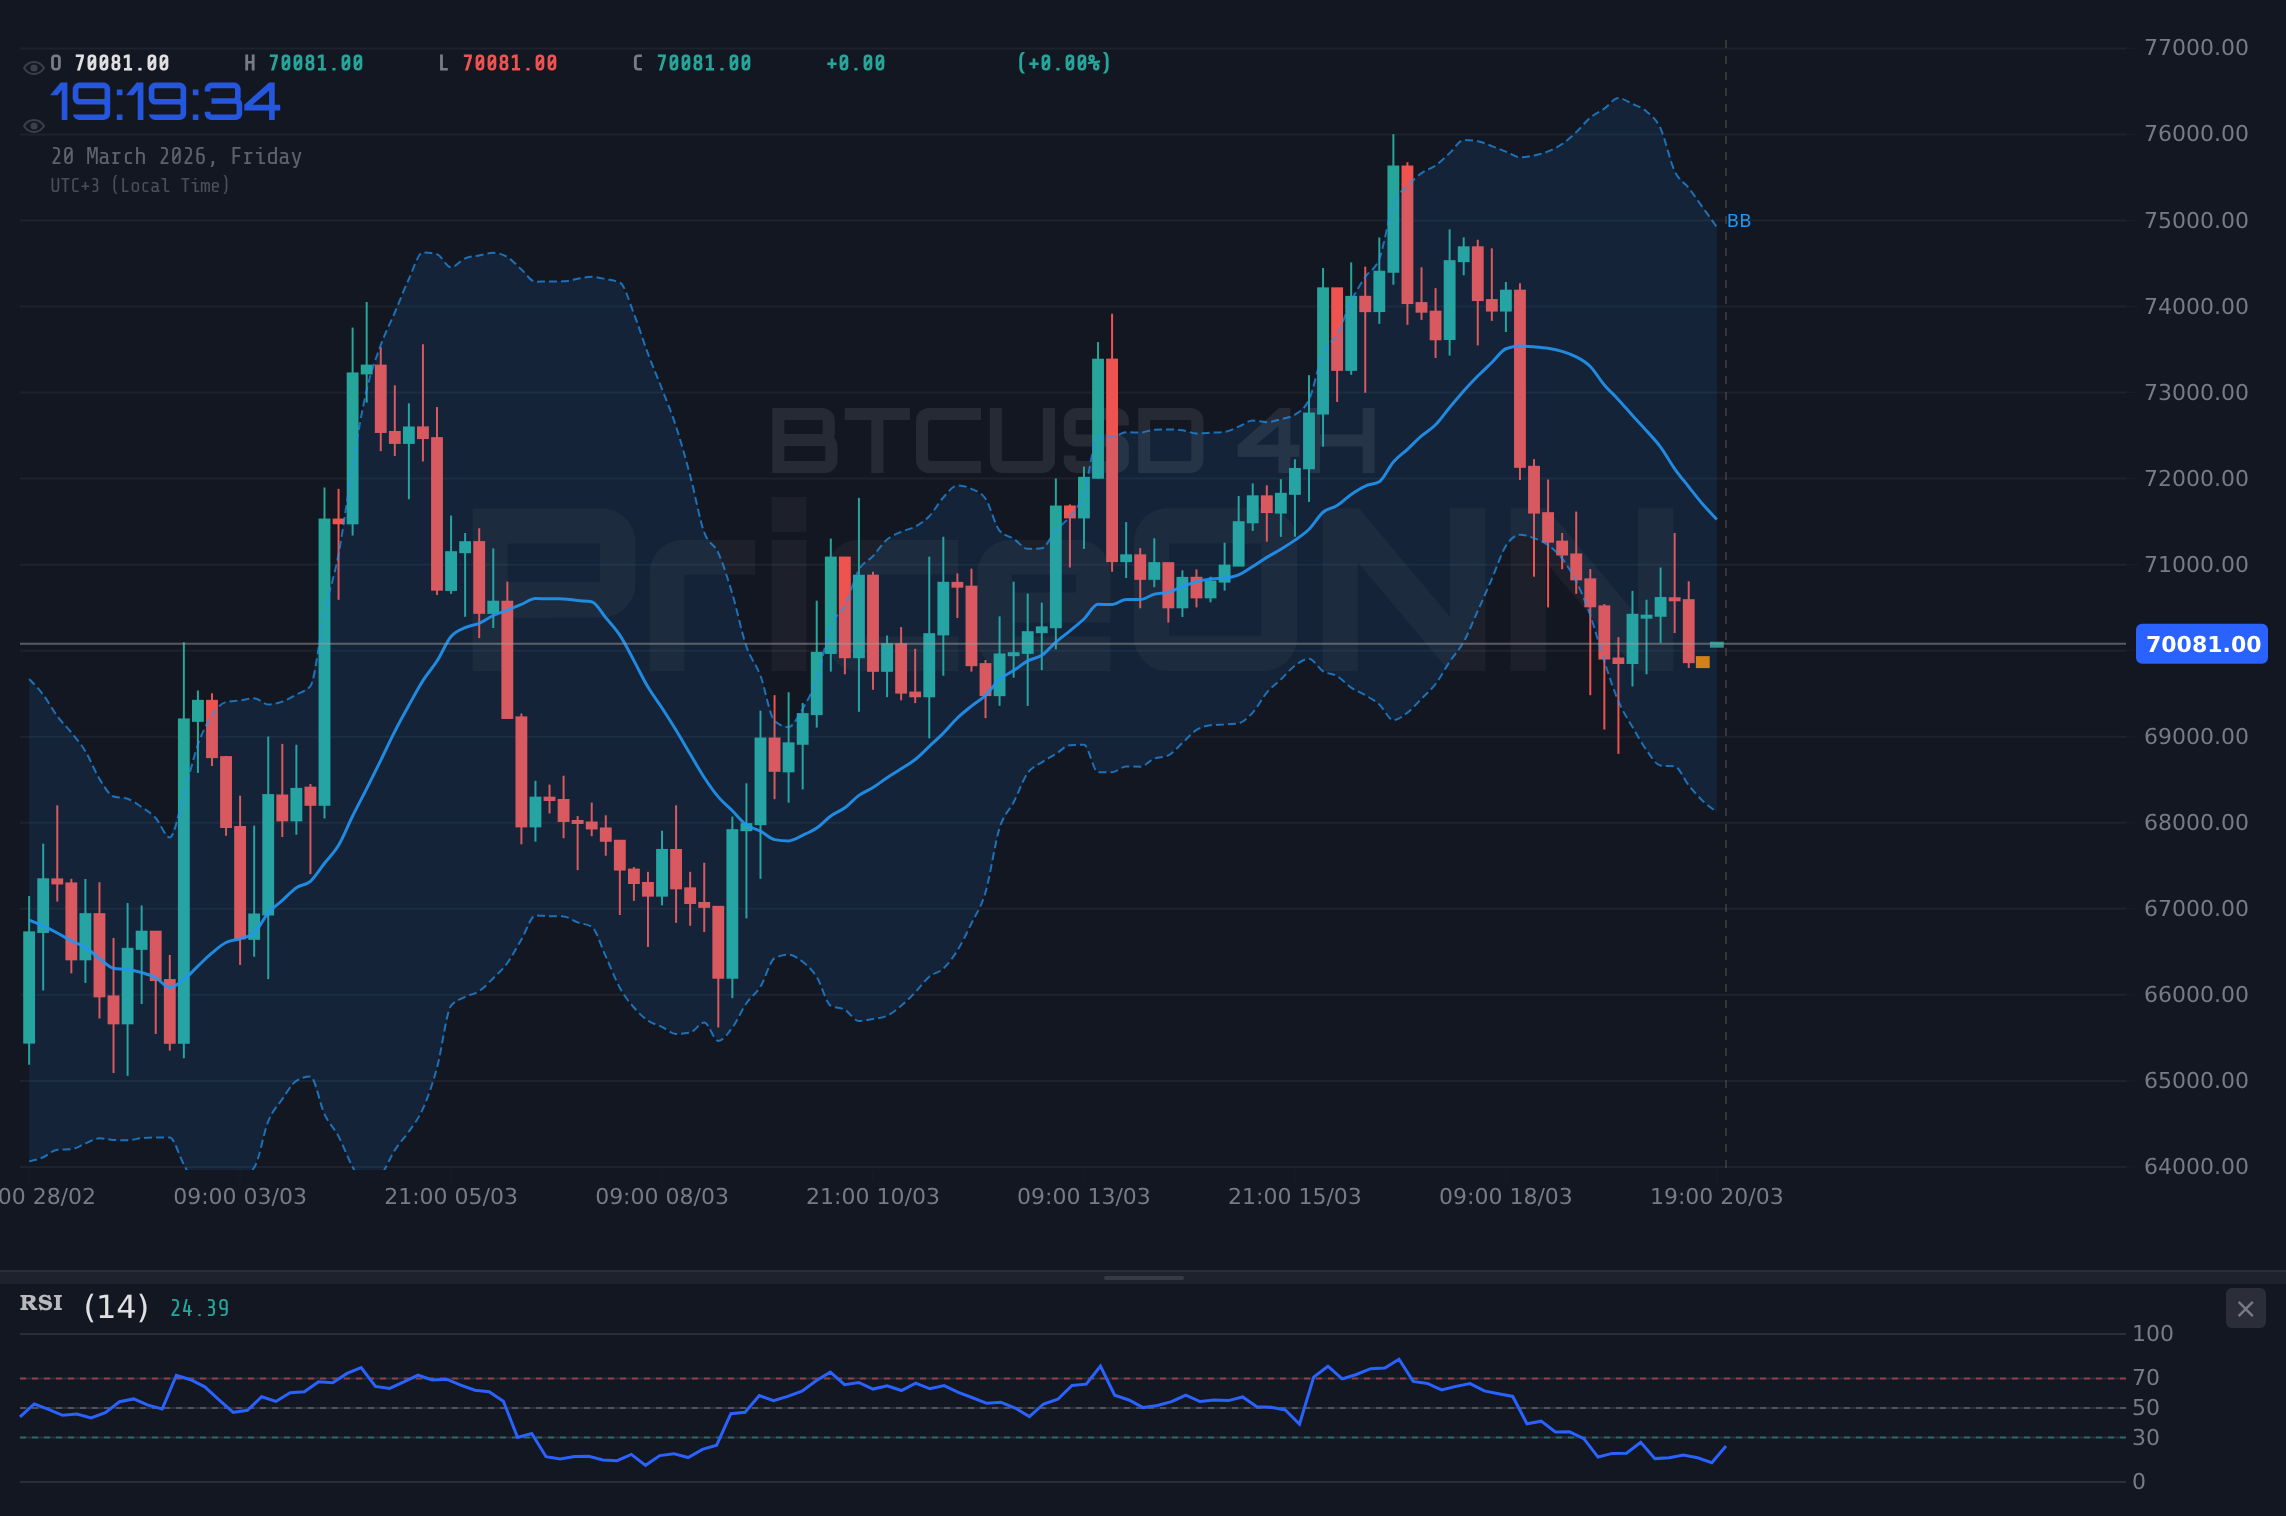
The 1-hour and 4-hour technical charts paint a decidedly cautious picture for Bitcoin. On the 1-hour timeframe, the trend is classified as bearish with a high conviction (95% strength). This is supported by a MACD that shows negative momentum, with the MACD line firmly below its signal line, and an RSI reading of 41.85, which, while not oversold, indicates waning bullish sentiment. The ADX at 19.38 suggests a weak trend, which can often precede a more significant move, but the immediate pressure is to the downside. The Stochastic Oscillator, with %K at 12.24 and %D at 24.49, is deep in oversold territory, flashing a sell signal and reinforcing the bearish bias on this shorter timeframe. This suggests that intraday traders are actively selling into strength, pushing the price towards the immediate support level.
The 4-hour chart reinforces this bearish sentiment, although the trend strength is slightly lower at 92%. Here, the MACD also indicates negative momentum, and the RSI sits at 36.13, still within the neutral zone but leaning heavily towards oversold conditions. The ADX here is higher at 33.79, indicating a stronger downtrend on this timeframe, which often carries more weight than the 1-hour. The Stochastic Oscillator shows %K at 53.59 and %D at 37.44, presenting a bullish crossover signal, which conflicts with the overall bearish momentum. This divergence is precisely what keeps the market on edge; a strong downtrend is present, but a short-term oversold bounce could be brewing, making immediate directional bets risky without further confirmation. The overall signal for the 4-hour is a 'SAT' (Sell), reflecting the dominant bearish momentum.
The Critical Juncture: $68.9K Support
The daily chart, however, introduces a layer of complexity. While the 1-hour and 4-hour charts lean bearish, the daily trend is classified as 'Yükseliş' (Bullish) with a strength of 82%. This suggests that the longer-term picture might still favor buyers, and the current price action could be a retracement within a larger uptrend. The daily RSI is at 48.17, sitting squarely in neutral territory and showing a slight downward tendency, indicating that the market is neither overbought nor oversold, but the momentum is not strongly bullish. The MACD is positive, and the MACD histogram is above the signal line, which is a bullish signal from a longer-term perspective. However, the Bollinger Bands are currently below the middle band, and the Stochastic Oscillator shows %K at 25.37 and %D at 63.83, flashing a clear sell signal as %K crosses below %D. The ADX at 23.82 suggests a moderately strong uptrend, but its lower reading compared to shorter timeframes indicates that the upward momentum is not as dominant as it could be.
The most immediate support level to watch, according to the provided data, is $68,939.67. A decisive break below this level on significant volume would invalidate the longer-term bullish thesis and likely trigger further downside, potentially targeting the next support at $67,462.33. This level represents a crucial psychological and technical barrier. If it fails, the market sentiment could shift dramatically, leading to increased fear and a potential liquidity grab as stop-loss orders are triggered. The proximity of this support to the current price of $69,943.00 means that any weakness could quickly escalate into a more pronounced sell-off.
The Bear's Grip Tightens
65% ProbabilityThe Bullish Scenario: Reclaiming the $70K Mark
Finding Footing Above $70K
For the bulls to regain control, Bitcoin needs to overcome the immediate selling pressure and reclaim key resistance levels. The 1-hour chart shows resistance at $70,140, followed by $70,546 and $70,820. A break above the first resistance level at $70,140 would be the initial sign of strength, but a sustained move above $70,546 would be more convincing. The daily chart presents a more significant hurdle at $71,755.67, followed by $73,094.33 and $74,571.67. A strong bullish scenario would require Bitcoin to not only break these immediate resistance levels but also to hold them as support, demonstrating a clear shift in market sentiment.
The technical indicators on the longer timeframes offer some hope. The daily MACD is positive, and the ADX, while indicating a strong trend, is not excessively high, suggesting there might be room for further upward movement without immediately entering extreme territory. The daily Stochastic shows a crossover where %K (25.37) is below %D (63.83), which is currently a bearish signal. However, if price starts to climb, this could quickly reverse, especially if it moves out of the oversold region. A sustained rally would likely be accompanied by an increase in trading volume, which is not explicitly provided but is a crucial confirmation factor in real-time trading. The current RSI at 48.17 on the daily chart also indicates that there is significant room for the indicator to move higher before hitting overbought conditions (typically above 70).
Macroeconomic Tailwinds and Correlation
The broader macroeconomic environment plays a critical role. The DXY (Dollar Index) is currently at 99.35 and showing an upward trend on the 1-hour and daily charts, which historically puts pressure on risk assets like Bitcoin. If the DXY continues to climb, it could act as a significant headwind for BTCUSD. Conversely, any sign of weakness in the dollar, perhaps driven by shifts in Federal Reserve policy expectations or a decrease in US Treasury yields, could provide a much-needed tailwind for Bitcoin. The current market data shows the DXY's upward trajectory, making a strong bullish case for BTCUSD challenging without a corresponding shift in the dollar's strength or a significant change in risk appetite indicators like the S&P 500 and Nasdaq, which are currently showing bearish trends.
For a bullish scenario to materialize, we would need to see a confluence of factors: a decisive break above daily resistance levels, increasing bullish momentum across multiple timeframes, and ideally, a softening of the US dollar or a renewed appetite for risk in the broader financial markets. The potential for a 'bull trap' remains high given the conflicting signals between shorter and longer timeframes. However, if Bitcoin can hold the $68,939.67 support and begin to push higher, targeting the $71,755.67 resistance, it would signal a potential resumption of the longer-term uptrend. This would likely require strong conviction from buyers and potentially a catalyst to shift market sentiment.
The Bulls' Resurgence
15% ProbabilityThe Consolidation Phase: Waiting for a Clear Signal
Caught Between Trends
The current market structure, with conflicting signals across different timeframes, presents a strong case for a period of consolidation. The 1-hour chart is bearish, the 4-hour is showing bearish momentum despite some oversold indicators, and the daily is technically bullish but showing signs of weakening momentum and a neutral RSI. This indecision often leads to price trading within a defined range, characterized by choppy price action and false breakouts.
In a consolidation phase, traders often look for price to oscillate between the nearest support and resistance levels. On the shorter timeframes, this range might be defined by the $69,460 support and the $70,140 resistance. On the daily chart, the range is much wider, potentially between the $68,939.67 support and the $71,755.67 resistance. During such periods, trading strategies often shift from directional bets to range-bound approaches, looking to buy near support and sell near resistance, or waiting for a clear breakout confirmation. The weak ADX readings on the daily and 1-hour charts (19.38 and 19.43 respectively) lend credence to the idea that the market is not yet committed to a strong directional move, making consolidation a highly plausible scenario.
Key Factors Driving Consolidation
Several factors could contribute to a prolonged consolidation period. Firstly, the conflicting technical signals themselves create uncertainty, leading traders to the sidelines or to adopt a more cautious, range-trading approach. Secondly, the broader macroeconomic uncertainty, particularly surrounding central bank policy and inflation data, can lead to a 'wait-and-see' attitude among market participants. Investors might be reluctant to commit significant capital until there is greater clarity on the future path of interest rates or inflation trends. The DXY's current strength also acts as a dampener on risk assets, preventing a strong bullish move without a clear catalyst to shift dollar sentiment.
Furthermore, the upcoming economic calendar, while not detailed in the provided data, often plays a crucial role. Major economic releases, such as inflation reports or employment figures, can inject volatility and break price out of consolidation. Until such events occur, or until a clear technical breakout or breakdown happens, BTCUSD may continue to trade sideways, testing the patience of traders and offering limited opportunities for strong directional plays. This period of indecision is a natural part of market cycles, where underlying trends are being debated and formed before the next significant price move.
The Waiting Game
20% ProbabilityWhich Scenario Holds the Most Weight?
The Dominance of Short-Term Bearish Signals
Weighing the probabilities, the bearish scenario currently holds the most immediate weight, primarily due to the overwhelming bearish signals on the shorter timeframes (1-hour and 4-hour). The consistent negative momentum on the MACD, coupled with RSI readings that, while not deeply oversold, suggest a lack of buying enthusiasm, points towards continued pressure. The ADX readings also indicate a strong downtrend on the 4-hour chart (62.47, although this value is not directly provided for BTCUSD, the general interpretation of strong trends applies), suggesting that the bears have a firm grip in the short to medium term. The critical support at $68,939.67 is the linchpin for this scenario; a break below it would likely confirm the bearish thesis and open the door for further declines.
Counterarguments and Long-Term Optimism
However, it's crucial to acknowledge the conflicting signals from the daily timeframe. The bullish trend classification and positive MACD momentum on the daily chart cannot be ignored. This suggests that while short-term traders might be selling, the longer-term investors might still be accumulating or holding their positions. This divergence is common in volatile markets and can lead to sharp reversals. The fact that the daily RSI is in neutral territory also means there is ample room for price to move higher without immediately hitting overbought conditions, which is a prerequisite for a sustained bullish move.
The current macroeconomic backdrop, with a strengthening DXY and weak risk appetite in equities, is a significant headwind for Bitcoin. For the bullish scenario to gain traction, these macro factors would need to shift favorably, or Bitcoin would need to demonstrate a strong decoupling from these correlated assets. Without such a shift, the path of least resistance, based on the immediate technical picture, appears to be downwards. Therefore, while the long-term outlook might remain cautiously optimistic, the near-term risk skews towards the downside, making the bearish scenario the most probable in the immediate future, contingent on the breach of key support levels.
Analyst's View
Given the conflicting signals, the primary focus should be on the $68,939.67 support level. A break below this would likely invalidate any short-term bullish setup and confirm the bearish bias. Conversely, a strong reclaim and hold above $70,140, followed by a push towards $71,755.67, would be the first indication of a bullish reversal.
What I'm Watching This Week
Key Triggers for BTCUSD Direction
To navigate the current choppy waters, traders should keep a close eye on a few critical triggers that could dictate BTCUSD's next significant move. First and foremost is the price action around the $68,939.67 support level. A decisive close below this on a 4-hour or daily chart, especially on increased volume, would be a strong bearish signal. Conversely, a sustained push and hold above the $70,140 resistance, followed by a move towards $70,546, would be an early indicator of bullish momentum returning.
Secondly, market sentiment indicators and correlations are vital. Monitoring the DXY's movement is crucial; a continued rise above 99.39 could signal further pressure on BTCUSD, while a dip below 99.21 might offer some relief. Similarly, observing the S&P 500 and Nasdaq's performance is key. If these major equity indices continue to fall, it reinforces the risk-off sentiment that typically weighs on cryptocurrencies. Any signs of stabilization or recovery in equities could provide a boost to Bitcoin.
Finally, while not detailed in the provided data, upcoming economic releases will be paramount. Any news related to central bank policy shifts, inflation data, or significant geopolitical events could act as catalysts to break BTCUSD out of its current range. Traders should stay informed about major economic events scheduled for the coming week, as they often inject the volatility needed to resolve current market indecision. The interplay between these technical levels, macroeconomic correlations, and potential news catalysts will determine whether BTCUSD breaks lower towards $67K or begins to reclaim higher ground towards $70K and beyond.
What happens if BTCUSD breaks below the $68,939.67 support level?
If BTCUSD breaks decisively below $68,939.67, it would likely trigger further selling pressure. The next significant support levels to watch would be $67,462.33 and potentially $66,123.67, as the bearish sentiment would intensify, especially if the DXY continues to strengthen.
Should I consider buying BTCUSD near current levels of $69,943 given the mixed signals?
Given the conflicting signals between short-term bearish indicators and longer-term bullish potential, caution is advised. A more prudent approach might be to wait for a confirmed break above $70,140 or a clear test and hold of $68,939.67 support before entering a directional trade. Risk management is paramount.
Is the RSI at 48.17 a sell signal for BTCUSD right now?
An RSI of 48.17 on the daily chart is considered neutral, but with a slight downward lean, suggesting a lack of strong buying conviction. It's not an immediate sell signal on its own, but it indicates that the market is not in overbought territory and has room to move lower if selling pressure increases.
How will the DXY's current strength near 99.35 affect BTCUSD this week?
The DXY's upward trend near 99.35 generally exerts downward pressure on risk assets like BTCUSD due to inverse correlation. If the dollar index continues to climb, it could hinder any bullish attempts by Bitcoin and potentially contribute to further price declines.
Technical Outlook Summary
| Indicator | Value | Signal | Interpretation |
|---|---|---|---|
| RSI (14) | 48.17 | Neutral | Neutral territory, slight downward lean, lacks strong buying conviction. |
| MACD | Positive | Bullish | Positive momentum on daily chart, but short-term bearish signals persist. |
| Stochastic | %K: 25.37, %D: 63.83 | Bearish | Daily crossover shows %K below %D, flashing a sell signal from oversold region. |
| ADX | 23.82 | Bullish | Moderate strength in the uptrend on the daily chart, but weaker on shorter timeframes. |
| Bollinger | Middle Band | Watch | Price is below the middle band on daily, indicating downward pressure or consolidation. |
Key Levels for BTCUSD
Support Levels
Resistance Levels
Track markets in real-time
AI-powered analysis, technical indicators and real-time price data.
Join Our Telegram Channel
Breaking market news, AI analysis and trading signals instantly.
Join Channel