DowJones30 Holds $45,801 Amidst Bearish Week; What's Next?
The Dow Jones Industrial Average finished the week at $45,801.00 after a significant downturn. Geopolitical fears and central bank policy concerns weigh heavily.
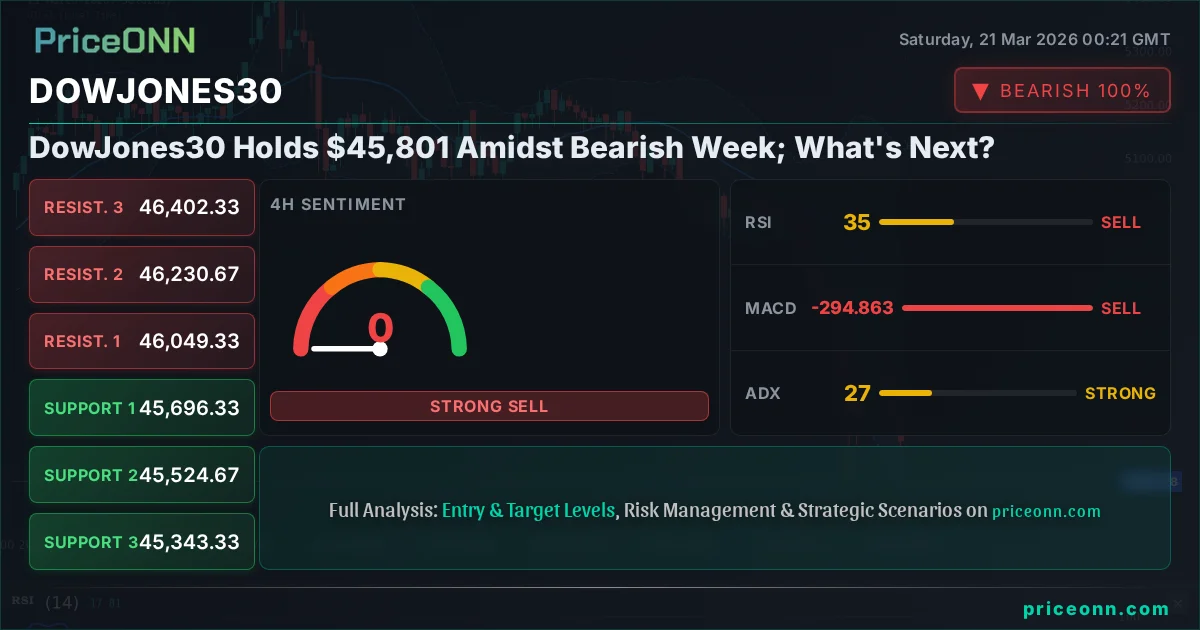
The Dow Jones Industrial Average, currently standing at $45,801.00, has endured a challenging week, flirting with its fourth consecutive weekly loss. This period has been marked by a palpable increase in geopolitical tensions and a re-evaluation of central bank policy expectations, creating a volatile environment for risk assets. While the index managed to hold its ground above critical support levels during the intraday trading sessions, the overarching sentiment leans bearish as we head into the weekend. This analysis delves into the key events that shaped the past week for the DJIA, examines the technical landscape, and explores potential scenarios for the week ahead, focusing on the fundamental drivers that are likely to dictate price action.
- The Dow Jones Industrial Average closed the week at $45,801.00, reflecting a significant bearish slide.
- Geopolitical tensions and expectations around central bank interest rate policies continue to drive market sentiment.
- The 1H chart shows a strong downtrend (94% strength) with RSI at 37.5, indicating bearish momentum.
- Key support for the DJIA is identified at $45,343.33, while resistance looms at $46,402.33.
- Upcoming economic data and central bank commentary will be crucial in determining the next directional move.
Navigating the Storm: Last Week's Key Developments
The past trading week presented a turbulent landscape for the Dow Jones Industrial Average (DJIA), with the index closing the week at $45,801.00. This level represents a significant downturn from recent highs, underscoring the growing bearish sentiment that has gripped the market. Several intertwined factors contributed to this challenging week, painting a complex picture for investors and traders alike. The escalating geopolitical climate, particularly concerning events in the Middle East, cast a long shadow over global markets, dampening risk appetite. This uncertainty often leads investors to seek refuge in safer assets, putting pressure on equity indices like the Dow.
Furthermore, shifting expectations regarding central bank monetary policy played a pivotal role. As inflation data remained stubbornly high in key economies, the narrative around interest rate cuts began to pivot. What was once a consensus for aggressive easing is now being tempered by a more cautious outlook, with some central banks signaling a potential 'higher for longer' interest rate environment. This recalibration of monetary policy expectations directly impacts borrowing costs, corporate profitability, and overall economic growth prospects, all of which are critical for the performance of a price-weighted index like the Dow Jones.
The correlation between the US Dollar Index (DXY) and risk assets also deserves attention. A strengthening dollar, driven by higher interest rate expectations and safe-haven flows, often acts as a headwind for equities. The DXY's upward trajectory observed over the week amplified this pressure, making it more expensive for international investors to hold US assets and increasing the cost of imports, potentially impacting corporate earnings. This intricate web of geopolitical risk, monetary policy recalibration, and currency strength created a challenging backdrop, leading to the substantial price declines seen across the Dow Jones average.
The technical indicators also painted a bearish picture throughout the week. On the 1-hour timeframe, the trend strength was noted at a robust 94% in favor of the downtrend, with the Relative Strength Index (RSI) hovering in overbought territory at 37.5. This suggested that the selling pressure was significant and gaining momentum. Similarly, the MACD indicator remained below its signal line, confirming negative momentum. The Bollinger Bands, a measure of volatility and trend, also showed the price trading below the middle band, indicating a bearish bias. These technical signals, when viewed in conjunction with the fundamental backdrop, reinforced the prevailing bearish sentiment. The ADX at 37.97 further solidified the notion of a strong downtrend, suggesting that the market was in a significant bearish phase.
Geopolitical Ripples and Central Bank Puzzles
The geopolitical landscape has become an increasingly dominant force in shaping market sentiment, and the past week was no exception for the Dow Jones Industrial Average. Escalating tensions in the Middle East, coupled with ongoing global strategic realignments, have injected a significant dose of uncertainty into financial markets. This heightened geopolitical risk naturally curtails investor confidence, leading to a pronounced 'risk-off' sentiment. When investors become apprehensive about global stability, they tend to divest from riskier assets, such as equities, and flock towards traditional safe-haven assets like gold, US Treasuries, and in some cases, the US Dollar itself. The DXY's climb to 99.39 during the week exemplifies this trend, as it reflects increased demand for the dollar as a safe harbor amidst global uncertainties. This strengthening dollar, in turn, puts downward pressure on US equities, including the Dow Jones, as it makes American goods more expensive for foreign buyers and can signal a global economic slowdown.
Adding another layer of complexity to the market's disposition is the evolving narrative surrounding central bank policies, particularly from the Federal Reserve. While the market had initially priced in a series of aggressive interest rate cuts for the year, persistent inflation readings have forced a reassessment. Recent economic data, though mixed, has leaned towards a stickier inflation profile than anticipated. This has led to a recalibration of expectations, with the possibility of fewer rate cuts, or even a prolonged period of higher interest rates, gaining traction. The Federal Reserve's communication, including statements from its officials, has become a focal point. Any hints of a more hawkish stance - that is, a greater emphasis on controlling inflation even at the expense of short-term growth - can significantly dampen market sentiment and weigh on indices like the Dow Jones. The market is now keenly watching for any signals that might confirm or refute this shift in policy outlook, making upcoming economic releases and central bank speeches critically important.
The interplay between these two forces - geopolitical instability and a potentially tighter monetary policy environment - creates a challenging environment for equity markets. A strong dollar, often a byproduct of safe-haven demand and higher rates, can hurt multinational corporations whose earnings are derived from overseas operations. For the Dow Jones, which includes many such companies, this correlation is particularly significant. The risk of a 'stagflationary' environment, where inflation remains elevated while economic growth stagnates, is also a growing concern. This scenario is particularly detrimental to equities, as it erodes purchasing power and corporate margins simultaneously. Therefore, understanding the nuances of these macro-level forces is paramount for interpreting the Dow Jones's price action and anticipating its future movements. The market's reaction to these developments is not always linear, but the underlying pressure from these fundamental factors is undeniable.
The implications of these macro trends extend beyond just the Dow Jones. The correlation with other major indices, such as the S&P 500 and Nasdaq 100, remains high. Both indices also experienced significant downturns, reflecting a broad-based deleveraging in the equity markets. The Nasdaq 100, with its heavy weighting towards technology stocks, is particularly sensitive to interest rate expectations, as higher rates can diminish the present value of future earnings for growth-oriented companies. The SP500, a broader market index, also succumbed to the risk-off sentiment, indicating a widespread risk aversion among market participants. This synchronized decline across major US equity indices underscores the systemic nature of the current market pressures, driven by the confluence of geopolitical anxieties and a recalibration of monetary policy expectations.
Technical Breakdown: Charting the Bearish Course
Examining the Dow Jones Industrial Average (DJIA) through a technical lens reveals a consistent bearish narrative throughout the past week, culminating in its closing price of $45,801.00. The 1-hour chart, in particular, paints a picture of strong downward momentum. The trend strength is unequivocally bearish at 94%, indicating that the bears have firmly taken control of short-term price action. The Relative Strength Index (RSI), a momentum oscillator, sits at 37.5. While not yet in extreme oversold territory (typically below 30), this reading clearly indicates a lack of buying pressure and suggests that any rallies are likely to be met with selling resistance. The MACD (Moving Average Convergence Divergence) further supports this bearish outlook, with its histogram remaining negative and the MACD line trading below the signal line. This configuration points to increasing downward momentum and reinforces the prevailing bearish trend.
The Bollinger Bands on the 1-hour chart also offer crucial insights. The price has been trading below the middle band, which often acts as a dynamic support or resistance level. This placement signifies a bearish bias, suggesting that the price is currently trading in the lower half of its recent range, with a higher probability of further declines. The ADX (Average Directional Index), which measures trend strength, is positioned at 37.97. An ADX value above 25 typically indicates a strong trend, and the current reading confirms that the downtrend is well-established and possesses considerable force. This combination of indicators - bearish trend strength, negative momentum on MACD, price below the middle Bollinger Band, and a high ADX - strongly suggests that the path of least resistance for the DJIA in the short term remains to the downside.
Shifting to the 4-hour timeframe, the bearish conviction strengthens. The trend is still firmly in the downtrend camp with a 94% strength, and the RSI has dipped further into oversold territory, reading 32.29. This deeper oversold condition on a higher timeframe could suggest that a short-term bounce is possible, but it does not negate the overall bearish trend. The MACD continues to show negative momentum, and the Bollinger Bands remain below the middle band. The ADX here is slightly lower at 24.88, but still indicates a strong trend. The Stochastic Oscillator, with %K at 10.33 and %D at 26.53, is deeply oversold, further reinforcing the idea that the selling may be approaching exhaustion in the medium term, but the trend remains firmly downward.
On the daily timeframe, the picture becomes even more stark. The trend is unequivocally bearish with 100% strength. The RSI is at 27.02, firmly in the oversold zone, signaling potential exhaustion of the current selling wave. The MACD histogram is deeply negative, and the MACD line is well below its signal line, confirming sustained bearish momentum. The price is trading below the middle Bollinger Band, and the ADX is at a very strong 41.79, indicating a powerful and established downtrend. The Stochastic Oscillator is also in the oversold region, with %K at 10.33 and %D at 16.33. This confluence of bearish signals across multiple timeframes underscores the prevailing downside pressure on the Dow Jones Industrial Average. The key support levels identified on the daily chart at $45,771.67, $45,458.33, and $45,191.67 will be critical to watch for any potential stabilization or reversal.
Key Levels and Price Action Insights
The Dow Jones Industrial Average's journey this past week, concluding at $45,801.00, has been defined by a relentless push lower, punctuated by brief periods of stabilization. Understanding the critical support and resistance levels is paramount for navigating this volatile market. On the 4-hour chart, we observe immediate support at $45,696.33, followed by stronger levels at $45,524.67 and $45,343.33. A break below these levels would signal a continuation of the bearish trend, potentially opening the door for further declines. The strength of the downtrend, as indicated by the ADX at 27.11 on this timeframe, suggests that these support levels will be rigorously tested.
Conversely, resistance levels will act as barriers to any potential upward retracements. On the 4-hour chart, initial resistance is seen at $46,049.33, with more significant hurdles at $46,230.67 and $46,402.33. For the bearish sentiment to abate, the index would need to decisively break and hold above these resistance zones. Currently, the momentum indicators do not strongly suggest such a reversal is imminent. The RSI on the 4-hour chart is at 32.29, still indicative of bearish pressure, and the MACD remains negative. This suggests that any upward moves are likely to be met with profit-taking or renewed selling interest, especially as the price approaches these resistance thresholds.
The daily chart provides a broader perspective on the key levels to monitor. The most immediate support lies at $45,771.67. A decisive breach of this level would likely trigger further selling, targeting the subsequent support at $45,458.33. The ultimate support on this timeframe is identified at $45,191.67. On the upside, the first significant resistance looms at $46,351.67. A sustained move above this level would be required to challenge the prevailing bearish narrative and could signal a potential shift in market sentiment. Further resistance is present at $46,618.33 and $46,931.67. The current RSI of 27.02 on the daily chart suggests that the market is oversold, which could lead to a short-term bounce. However, without confirmation from other indicators or a clear break of resistance, this oversold condition alone is not a sufficient signal for a bullish reversal.
The ADX reading of 41.79 on the daily chart is particularly noteworthy, indicating a very strong downtrend. This suggests that any retracements are likely to be shallow and that the prevailing trend will likely continue until significant fundamental shifts occur or strong confluence of technical signals emerges. The Stochastic Oscillator, deeply oversold at %K=10.33 and %D=16.33, also points to potential exhaustion in selling pressure, but as history often shows, oversold conditions can persist in strong downtrends. Therefore, traders should exercise caution and wait for clear signals of trend exhaustion or reversal before considering long positions.
Fundamental Drivers: The Economic Undercurrents
The recent price action in the Dow Jones Industrial Average, which saw it trade around $45,801.00, cannot be fully understood without a deep dive into the underlying fundamental drivers. The global economic outlook remains a significant concern, primarily shaped by the persistent inflation narrative and the subsequent policy responses from major central banks. The latest inflation reports, while showing some moderation in certain sectors, have generally indicated that price pressures are proving more resilient than initially hoped. This has led to a palpable shift in market expectations regarding interest rate paths. The Federal Reserve, in particular, is navigating a delicate balance: taming inflation without triggering a severe economic downturn. The market is now pricing in a higher probability of fewer rate cuts this year, or at least a later start to any easing cycle, compared to projections made just a few months ago.
This recalibration of interest rate expectations has profound implications for equity markets. Higher-for-longer interest rates increase the cost of capital for businesses, potentially impacting corporate earnings and future growth prospects. For growth-oriented sectors, which often form a significant part of indices like the Nasdaq 100 and, to a lesser extent, the Dow Jones, this can lead to a revaluation of stock prices. Furthermore, higher domestic interest rates tend to strengthen the US Dollar, as seen with the DXY trading near 99.39. A strong dollar can act as a drag on US exports and reduce the repatriated earnings of multinational corporations, which are well-represented in the Dow Jones. This complex interplay between inflation, interest rates, and currency strength creates headwinds for the broader equity market.
Looking ahead, upcoming economic data releases will be crucial. Key indicators such as Non-Farm Payrolls (NFP), Consumer Price Index (CPI), and Purchasing Managers' Index (PMI) reports will provide fresh insights into the health of the US economy and the persistence of inflation. Any readings that suggest a cooling labor market or a significant drop in inflation could rekindle hopes for earlier rate cuts, potentially providing a tailwind for the Dow Jones. Conversely, data indicating continued inflationary pressures or robust economic growth might reinforce the 'higher for longer' rate narrative, extending the current bearish sentiment. The market's reaction to these data points will likely be amplified by the prevailing geopolitical uncertainties, creating a high-volatility environment.
The global economic picture is also clouded by geopolitical risks. The ongoing conflicts and trade disputes, while not always directly impacting the Dow Jones's constituents, contribute to a general increase in market volatility and a reduction in global risk appetite. This 'risk-off' sentiment often leads to capital flight from equities towards safer assets, further pressuring indices like the Dow. Moreover, supply chain disruptions, though perhaps less acute than during the pandemic, can still contribute to inflationary pressures and impact corporate costs. The interconnectedness of the global economy means that events unfolding thousands of miles away can have tangible effects on Wall Street. Therefore, a comprehensive analysis of the Dow Jones's outlook must consider not only domestic economic data and Fed policy but also the broader geopolitical and global economic context.
Correlations and Market Sentiment Analysis
Understanding the Dow Jones Industrial Average's price action at $45,801.00 requires a keen eye on its correlations with other major market indicators. The Dollar Index (DXY) remains a critical barometer. As the DXY climbed to 99.39 this week, it exerted downward pressure on the Dow. Historically, a strengthening dollar often correlates with a weakening stock market, especially for US equities, as it makes American exports more expensive and can signal a tightening of global liquidity. This inverse relationship was clearly visible this past week, with the dollar's ascent coinciding with the equity sell-off.
The performance of broader equity indices like the S&P 500 and Nasdaq 100 also provides essential context. The S&P 500's tumble to 6536.05 and the Nasdaq 100's fall to 23992.13 reflect a general risk aversion across the market. The Dow Jones's movement is often closely tied to these broader indices, and the synchronized downturn suggests that the factors weighing on the market are systemic rather than isolated to specific sectors within the Dow. The fact that the S&P 500 is trading at a year-to-date low further emphasizes the bearish sentiment pervading the equity space.
Commodities, particularly oil, also play a role in shaping market sentiment, often acting as a proxy for inflation expectations and geopolitical risk. The surge in Brent crude oil prices to $112.79 and WTI to $98.50 this week highlights ongoing supply concerns and potentially rising inflation pressures. While higher oil prices can boost energy sector earnings, they also increase operating costs for many businesses and can contribute to consumer inflation, potentially leading central banks to maintain tighter monetary policies. This dynamic adds another layer of complexity, as the market tries to balance the inflationary implications of rising energy costs against the need for economic stability.
The sentiment indicators, such as RSI and MACD, across various timeframes for the Dow Jones, have consistently pointed towards bearish momentum. The 1-hour RSI at 37.5 and the daily RSI at 27.02 indicate that the index is either in a strong downtrend or approaching oversold conditions. While oversold readings can sometimes signal a potential bounce, in the context of a strong downtrend and negative MACD signals, they often indicate that selling pressure is simply being temporarily paused, rather than reversed. The ADX readings across timeframes (37.97 on 1H, 24.88 on 4H, 41.79 on 1D) reinforce the idea of a strong, established downtrend, suggesting that any rallies are likely to be short-lived unless significant fundamental shifts occur.
The Week Ahead: Key Events and Watchlist
As traders and investors look towards the upcoming week, the Dow Jones Industrial Average, currently hovering around $45,801.00, faces a landscape shaped by critical economic data releases and ongoing geopolitical developments. The market's direction will likely hinge on its interpretation of these factors, particularly concerning inflation trends and potential central bank responses. Investors will be closely monitoring key economic events, including inflation reports (CPI, PCE), employment figures (NFP, unemployment rate), and manufacturing data (PMI). Any surprises in these releases - whether stronger or weaker than expected - could trigger significant price swings in the Dow Jones.
For instance, a higher-than-expected inflation reading could reinforce the 'higher for longer' interest rate narrative, potentially leading to further declines in the index as borrowing costs remain elevated and risk appetite wanes. Conversely, signs of cooling inflation or a softening labor market might reignite hopes for earlier interest rate cuts, providing a much-needed boost to equity markets. The market's reaction will also depend on how these data points align with or diverge from current expectations priced into interest rate futures.
Central bank communication will remain a critical focus. Speeches and statements from Federal Reserve officials, as well as minutes from their recent policy meetings, will be scrutinized for any clues about the future direction of monetary policy. Any indication of a shift in tone, whether towards greater hawkishness or a more dovish stance, could significantly influence market sentiment and the Dow Jones's trajectory. The market will be looking for confirmation or contradiction of the recent narrative that suggests fewer rate cuts are on the horizon.
Geopolitical developments will continue to be a background driver of volatility. Any significant escalation or de-escalation of regional conflicts could impact oil prices and overall risk sentiment. The correlation between the DXY and the Dow Jones will remain important to watch; a continued rise in the dollar could present further challenges for the index. Ultimately, the upcoming week presents a critical juncture for the Dow Jones. Traders will need to remain vigilant, focusing on the interplay between economic data, central bank policy, geopolitical events, and the resulting market sentiment. The key levels identified earlier - support at $45,771.67 and resistance at $46,351.67 - will serve as crucial reference points for navigating the potential price action.
Bearish Scenario: Continued Descent
65% ProbabilityConsolidation Scenario: Range-Bound Action
25% ProbabilityBullish Scenario: Short-Term Rebound
10% ProbabilityFrequently Asked Questions: DowJones30 Analysis
What happens if DowJones30 breaks below the $45,771.67 support level?
A decisive break below $45,771.67 on the daily chart would likely confirm the continuation of the bearish trend. This could trigger further downside momentum, targeting the next support level at $45,458.33, as selling pressure is expected to intensify.
Should I buy DowJones30 at current levels of $45,801.00 given the oversold RSI?
Buying solely based on the oversold RSI (currently 27.02 on the daily chart) is not recommended without confirmation. While oversold conditions suggest potential for a bounce, the strong bearish trend (ADX at 41.79) and negative MACD indicate that rallies may be short-lived. A confirmed breakout above $46,351.67 resistance would be a more prudent buy signal.
Is the MACD histogram at -15.20 a strong sell signal for DowJones30?
The negative MACD histogram reading of -15.20, along with the MACD line below its signal line, confirms strong bearish momentum on the daily chart. While it indicates selling pressure, it is part of a broader trend. A sell signal is typically confirmed by price action breaking key support levels, rather than just an indicator reading in isolation.
How will upcoming NFP data affect DowJones30 this week?
Stronger-than-expected Non-Farm Payrolls (NFP) data could reinforce the 'higher for longer' interest rate narrative, potentially pressuring the Dow Jones further as it strengthens the dollar and dampens rate cut hopes. Conversely, weaker NFP figures might spark a short-covering rally if it increases expectations for Fed easing.
| Indicator | Value | Signal | Interpretation |
|---|---|---|---|
| RSI (14) | 27.02 | Bearish | Oversold, but strong trend may persist |
| MACD Histogram | -15.20 | Bearish | Strong negative momentum |
| Stochastic | 10.33 / 16.33 | Bearish | Deeply oversold, potential exhaustion |
| ADX | 41.79 | Bullish Trend | Very strong downtrend confirmed |
| Bollinger | Middle Band | Bearish | Price below middle band |
Track markets in real-time
AI-powered analysis, technical indicators and real-time price data.
Join Our Telegram Channel
Breaking market news, AI analysis and trading signals instantly.
Join Channel