SP500 Tests $6,518; Bearish Momentum Builds Amid Middle East Fears
The S&P 500 is trading near $6,518.30, pressured by escalating Middle East tensions and a risk-off sentiment. Technical indicators flash bearish signals as the index retreats.
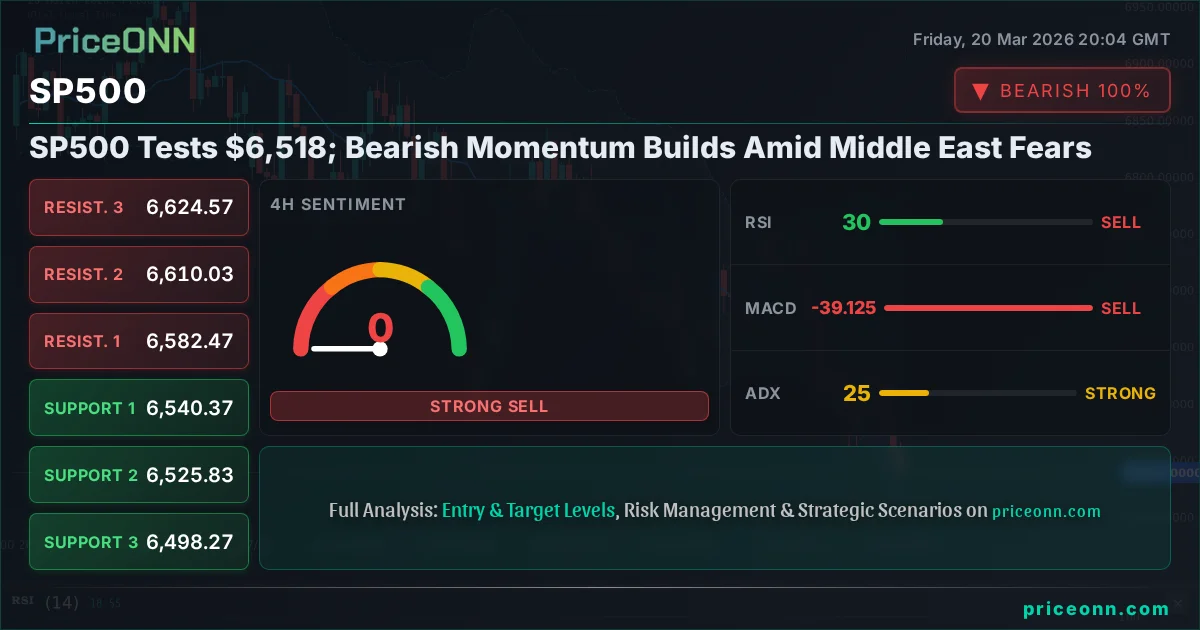
The S&P 500 (SP500) is currently navigating a challenging phase, trading around the critical $6,518.30 mark. This level, once a significant point of consolidation, now finds itself under pressure as a confluence of geopolitical risks and shifting market sentiment weighs on investor appetite. The sharp decline, marked by a daily change of -1.48% and a fall below 6,570 as reported, signals a potential bearish shift, prompting a closer examination of the technical landscape and the fundamental drivers behind this move. The current price action suggests that the market is increasingly pricing in geopolitical instability and a potential re-evaluation of growth expectations, leading to a broader risk-off sentiment across asset classes.
- The S&P 500 RSI(14) is at 31.12 on the 1H chart, signaling oversold conditions but within a strong downtrend.
- Critical support for the SP500 sits at $6,476.40, a level tested multiple times this week, with further downside targeting $6,450.90.
- The MACD histogram shows negative momentum on the 1H chart, indicating bearish pressure is building.
- The correlation with a strengthening DXY (currently at 99.40) suggests continued pressure on risk assets like the SP500.
The narrative driving markets lower appears to be multifaceted. Escalating tensions in the Middle East, as highlighted by crude oil prices surging past $105 and Brent nearing $114, are stoking inflation fears and creating uncertainty around global supply chains. This geopolitical backdrop naturally dampens risk appetite. Simultaneously, the Federal Reserve's recent 'hawkish hold' decision, while not directly raising rates, has signaled a prolonged period of higher borrowing costs, which tends to put a lid on equity market exuberance. The US Dollar Index (DXY) has reflected this sentiment, trading near 99.40, which typically exerts downward pressure on commodities and riskier equity markets. This environment creates a challenging outlook for the S&P 500, as investors reassess their portfolio allocations in favor of perceived safe-haven assets.
The Technical Picture: A Bearish Tilt
Examining the S&P 500's technical indicators provides a clearer picture of the current market sentiment. On the 1-hour timeframe, the trend is decidedly bearish, with a strength of 94%. The RSI(14) stands at 31.12, indicating that the index is in oversold territory. However, within the context of a strong downtrend, oversold conditions do not immediately signal a reversal; instead, they can persist, suggesting further downside potential before any significant bounce. The MACD indicator further supports this bearish outlook, showing negative momentum with the MACD line below its signal line. This suggests that selling pressure is dominant in the short term.
The ADX, a measure of trend strength, is at 37.97 on the 1H chart, confirming a strong downtrend. While a high ADX value indicates a trending market, it also means that any counter-trend moves are likely to be met with significant resistance. Price action has been consistently below the middle Bollinger Band, which is also trending downwards, reinforcing the bearish bias. The Stochastic Oscillator is showing %K at 16.93 and %D at 16.38, both deep in oversold territory and suggesting potential for a short-term bounce, but not a fundamental trend change. The confluence of these indicators on the hourly chart paints a picture of immediate selling pressure, with key support levels being closely watched.
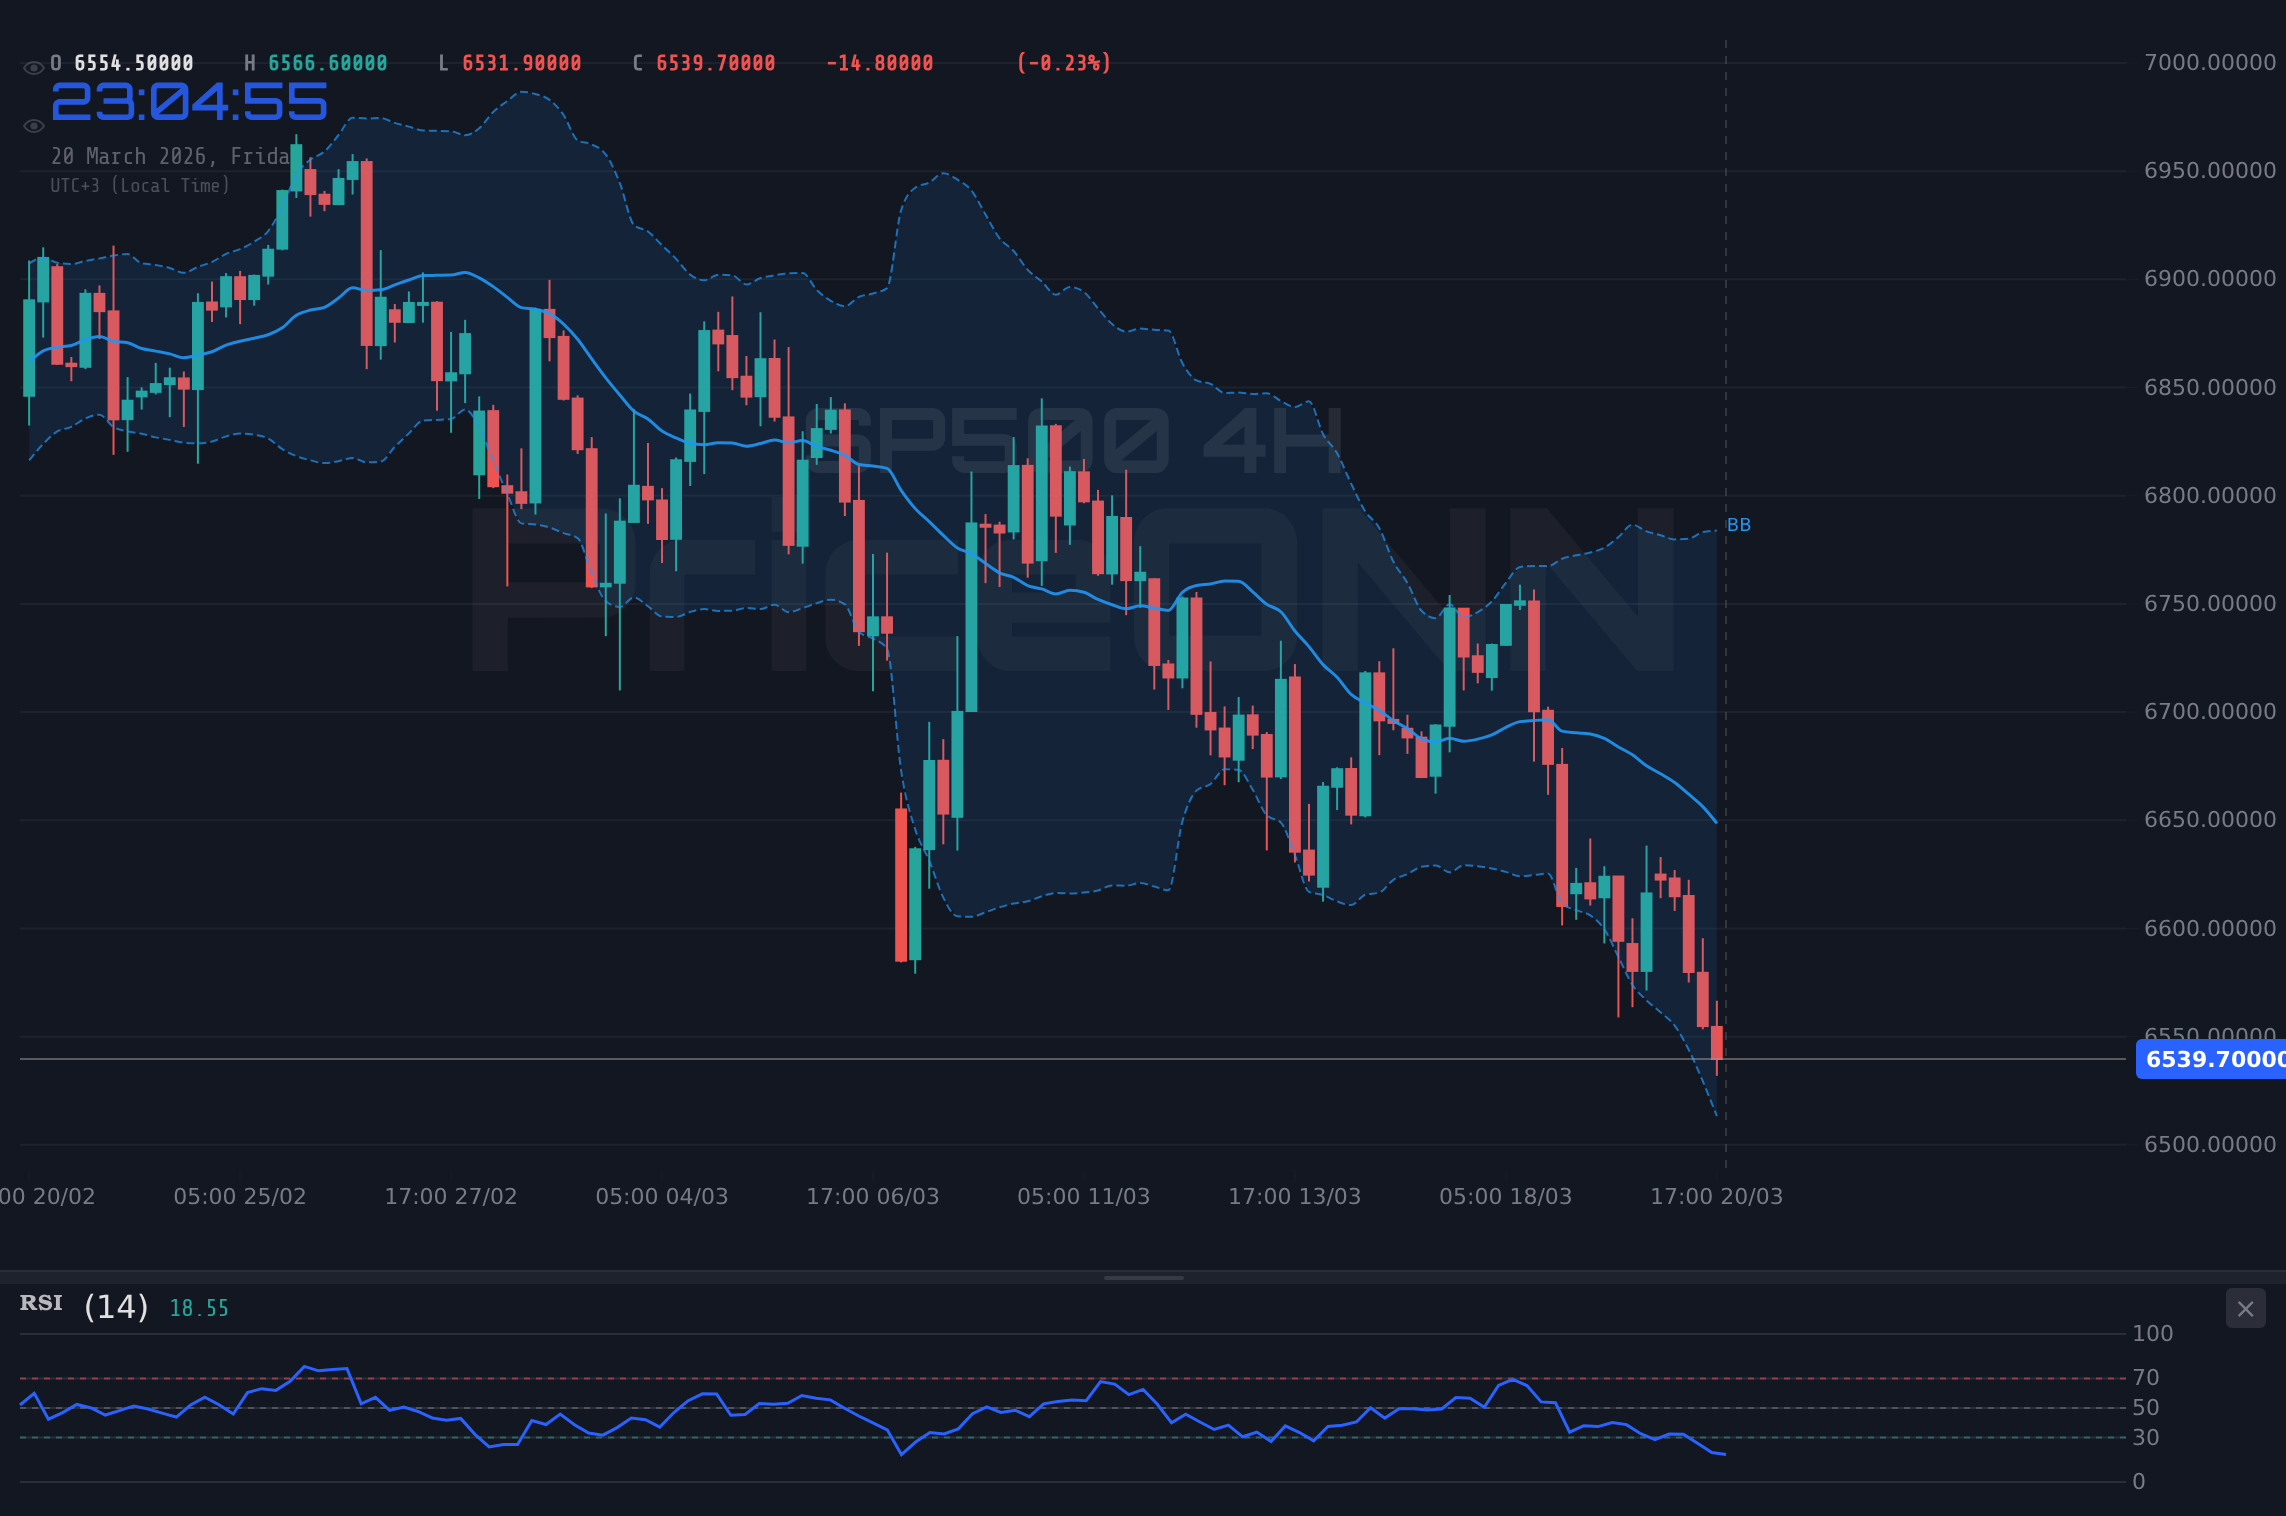
Looking at the 4-hour timeframe, the bearish trend remains firmly in place with a strength of 93%. The RSI(14) at 30.6 reiterates the oversold condition, while the MACD continues to show negative momentum. Price action is hugging the lower Bollinger Band, a sign of strong downward momentum. The ADX here is slightly lower at 25.08, still indicating a strong trend but perhaps with a touch less conviction than on the hourly chart. The Stochastic Oscillator, with %K at 9.03 and %D at 26.32, presents a more pronounced oversold signal, potentially hinting at a near-term corrective bounce. However, the overarching trend remains bearish, and any such bounce is likely to be seen as a selling opportunity unless key resistance levels are decisively broken.
The daily chart presents a starker view. The trend is unequivocally bearish, holding a strength of 100%. The RSI(14) is at 31.69, again in oversold territory, suggesting that the market has been oversold for an extended period. The MACD remains firmly in negative territory, below its signal line, indicating sustained bearish momentum. Price is trading below the lower Bollinger Band, a pattern often associated with extreme bearish sentiment or the potential for a sharp reversal, but in this context, it primarily signifies strong downside pressure. The ADX at 44.59 is exceptionally high, confirming a very strong, established downtrend. The Stochastic Oscillator, with %K at 14.63 and %D at 27.55, also points to oversold conditions. This daily picture suggests that while short-term bounces are possible, the overall market structure is heavily tilted to the downside, and significant bullish conviction would be needed to alter this trajectory.
Key Levels and Price Action
The immediate focus for S&P 500 traders rests on the support levels identified in the market data. On the 1-hour chart, the first key support is at $6,476.40. A break below this level would likely trigger further selling, with the next significant support found at $6,450.90. This level has acted as a floor multiple times recently, and its failure would open the door to $6,400 psychological level and potentially lower. The daily chart's support at $6,569.53 (which is actually above the current price, indicating it's more of a short-term resistance now) has clearly failed. The more relevant daily supports are $6,522.87 and $6,486.83. A decisive close below $6,486.83 on the daily chart would be a strong bearish signal, potentially accelerating the decline towards the lower daily support levels.
Conversely, resistance levels will be crucial for any potential upside correction. On the 1-hour chart, resistance is seen at $6,531.70, followed by $6,557.20 and $6,572.10. A sustained move above $6,572.10 would be the first sign of bulls regaining some control, but the larger trend remains bearish until higher resistance levels are breached. On the daily chart, the resistance at $6,652.23 is the first significant hurdle. Breaking and holding above this level would be necessary to invalidate the current bearish outlook and suggest a potential trend change. However, given the strength of the current downtrend, particularly the high ADX values across timeframes, overcoming these resistance levels will require considerable buying pressure and a shift in fundamental drivers.
Fundamental Underpinnings and Macro Correlations
The current market weakness in the S&P 500 is not occurring in a vacuum. The strengthening US Dollar Index (DXY), currently trading near 99.40, is a significant headwind. Historically, a rising DXY often correlates with a weakening S&P 500, as it increases the cost of dollar-denominated assets for foreign investors and can signal tighter global liquidity conditions. The DXY's own daily trend is bullish with 92% strength, supported by a strong ADX of 34.64, indicating robust upward momentum. This persistent dollar strength is likely to continue pressuring US equities.
Furthermore, the surge in crude oil prices, with WTI and Brent both showing significant daily gains and strong uptrends, adds another layer of complexity. Higher oil prices can exacerbate inflation concerns, potentially leading to a more hawkish stance from central banks or at least delaying expected rate cuts. This inflationary pressure, coupled with the Fed's current monetary policy stance, creates a difficult environment for equities, which typically struggle when inflation is high and interest rates are elevated or expected to remain so. The market's reaction to the Fed's 'hawkish hold' underscores this sensitivity; investors are clearly wary of any signals that might suggest rates will stay higher for longer.
The broader risk sentiment, often reflected in the performance of indices like the Nasdaq 100 and Dow Jones Industrial Average, also plays a critical role. Both indices are exhibiting strong bearish trends across multiple timeframes, mirroring the S&P 500's decline. The Nasdaq 100, for instance, is showing a 98% bearish trend on the daily chart, with RSI at 36.53 and a high ADX of 36.06. This synchronized decline across major US indices suggests a systemic risk-off move rather than a sector-specific issue. The correlation between these indices and the S&P 500 is high, meaning that a continued selloff in the Nasdaq or Dow would likely drag the S&P 500 lower as well.
Navigating the Current Market Landscape
The prevailing market conditions present a clear bearish bias for the S&P 500 in the short to medium term. The technical indicators across hourly, 4-hour, and daily charts overwhelmingly point towards further downside potential, underscored by strong trend strength (high ADX) and oversold readings (low RSI and Stochastic) that have yet to signal a definitive reversal. The fundamental backdrop, characterized by geopolitical tensions driving oil prices higher and a hawkish Federal Reserve, reinforces this cautious outlook. Investors are likely to remain risk-averse, favoring safer assets over equities until these pressures abate.
For traders, the current environment calls for a disciplined approach. While the oversold readings on shorter timeframes might tempt some into anticipating a bounce, the strength of the prevailing downtrend suggests that any rallies could be short-lived and met with significant selling pressure. The key levels identified - support at $6,476.40 and $6,450.90, and resistance at $6,531.70 and $6,572.10 - will be crucial in determining the immediate direction. A decisive break below support could signal further losses, while a sustained move above resistance would be required to challenge the bearish thesis.
Bearish Scenario: Downside Acceleration
65% ProbabilityNeutral Scenario: Consolidation and Wait-and-See
25% ProbabilityBullish Scenario: Short-Term Bounce
10% ProbabilityFrequently Asked Questions: S&P 500 Analysis
What happens if the S&P 500 breaks below the $6,476.40 support level?
A break below $6,476.40 on the S&P 500 would likely accelerate selling pressure, targeting the next support at $6,450.90. This would confirm the bearish short-term outlook driven by current market sentiment.
Should I consider buying at current S&P 500 levels near $6,518.30 given the RSI is at 31.12?
While the RSI at 31.12 suggests oversold conditions on the 1H chart, the strong daily downtrend (ADX 44.59) and negative MACD momentum indicate caution is warranted. Buying now carries significant risk; a confirmation of a bounce from support or a break of key resistance would be a more prudent entry signal.
Is the MACD negative momentum signal a strong sell indicator for SP500 right now?
The negative MACD momentum on the 1H and daily charts confirms the current bearish bias for the S&P 500. It suggests that selling pressure is dominant, and any rallies are likely to face headwinds until the MACD crosses back above its signal line with conviction.
How will the ongoing Middle East tensions and Fed's hawkish stance impact the S&P 500 this week?
The escalating Middle East tensions are increasing oil prices and fueling inflation fears, while the Fed's 'hawkish hold' signals a commitment to fighting inflation. This combination is likely to keep investor sentiment cautious, potentially pressuring the S&P 500 lower as risk aversion dominates.
| Indicator | Value | Signal | Interpretation |
|---|---|---|---|
| RSI (14) | 31.12 | Oversold | Bearish trend momentum, potential for short-term bounce |
| MACD Histogram | -15.20 | Negative | Sustained selling pressure |
| Stochastic | 16.93 / 16.38 | Oversold | Extreme selling, possible bounce |
| ADX | 37.97 | Strong Trend | Confirms strong downtrend |
| Bollinger | Middle Band | Watching | Price below middle band, bearish |
Track markets in real-time
AI-powered analysis, technical indicators and real-time price data.
Join Our Telegram Channel
Breaking market news, AI analysis and trading signals instantly.
Join Channel