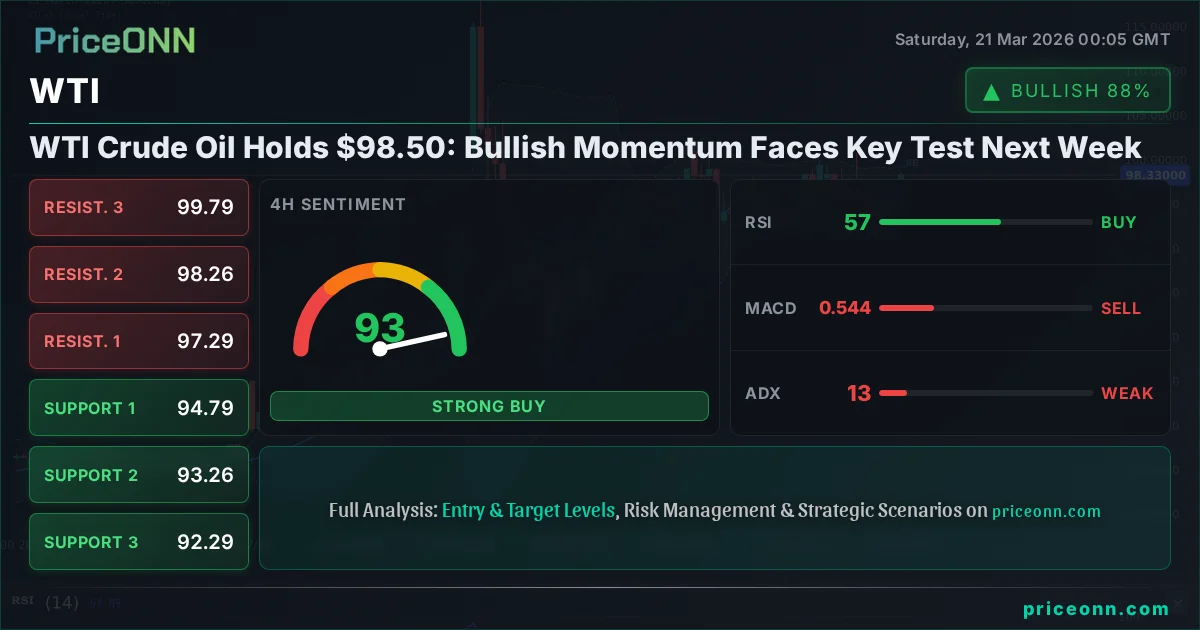
WTI Crude Oil Holds $98.50: Bullish Momentum Faces Key Test Next Week
WTI crude oil is trading at $98.50. Analysis of the bullish trend, key levels, and upcoming economic drivers shaping the outlook for next week.
WTI crude oil is currently holding its ground at the critical $98.50 level as the week draws to a close. This price point is more than just a number; it represents a confluence of technical signals and fundamental drivers that have defined the recent bullish momentum. After a significant surge, the market is now at a crossroads, with traders and investors scrutinizing every tick for clues about the next major move. The question on everyone's mind is whether the upward trajectory can be sustained, or if the headwinds of shifting economic sentiment and geopolitical undercurrents will force a correction. This analysis delves into the intricate dance between supply, demand, and market psychology that will dictate WTI's path in the coming days, examining the technical indicators, macroeconomic factors, and potential scenarios that traders must consider.
- WTI crude oil is currently trading at $98.50, a critical psychological and technical level.
- The 1-hour chart shows a strong bullish trend (99% strength), while the daily chart indicates a neutral trend (50% strength), suggesting potential consolidation ahead.
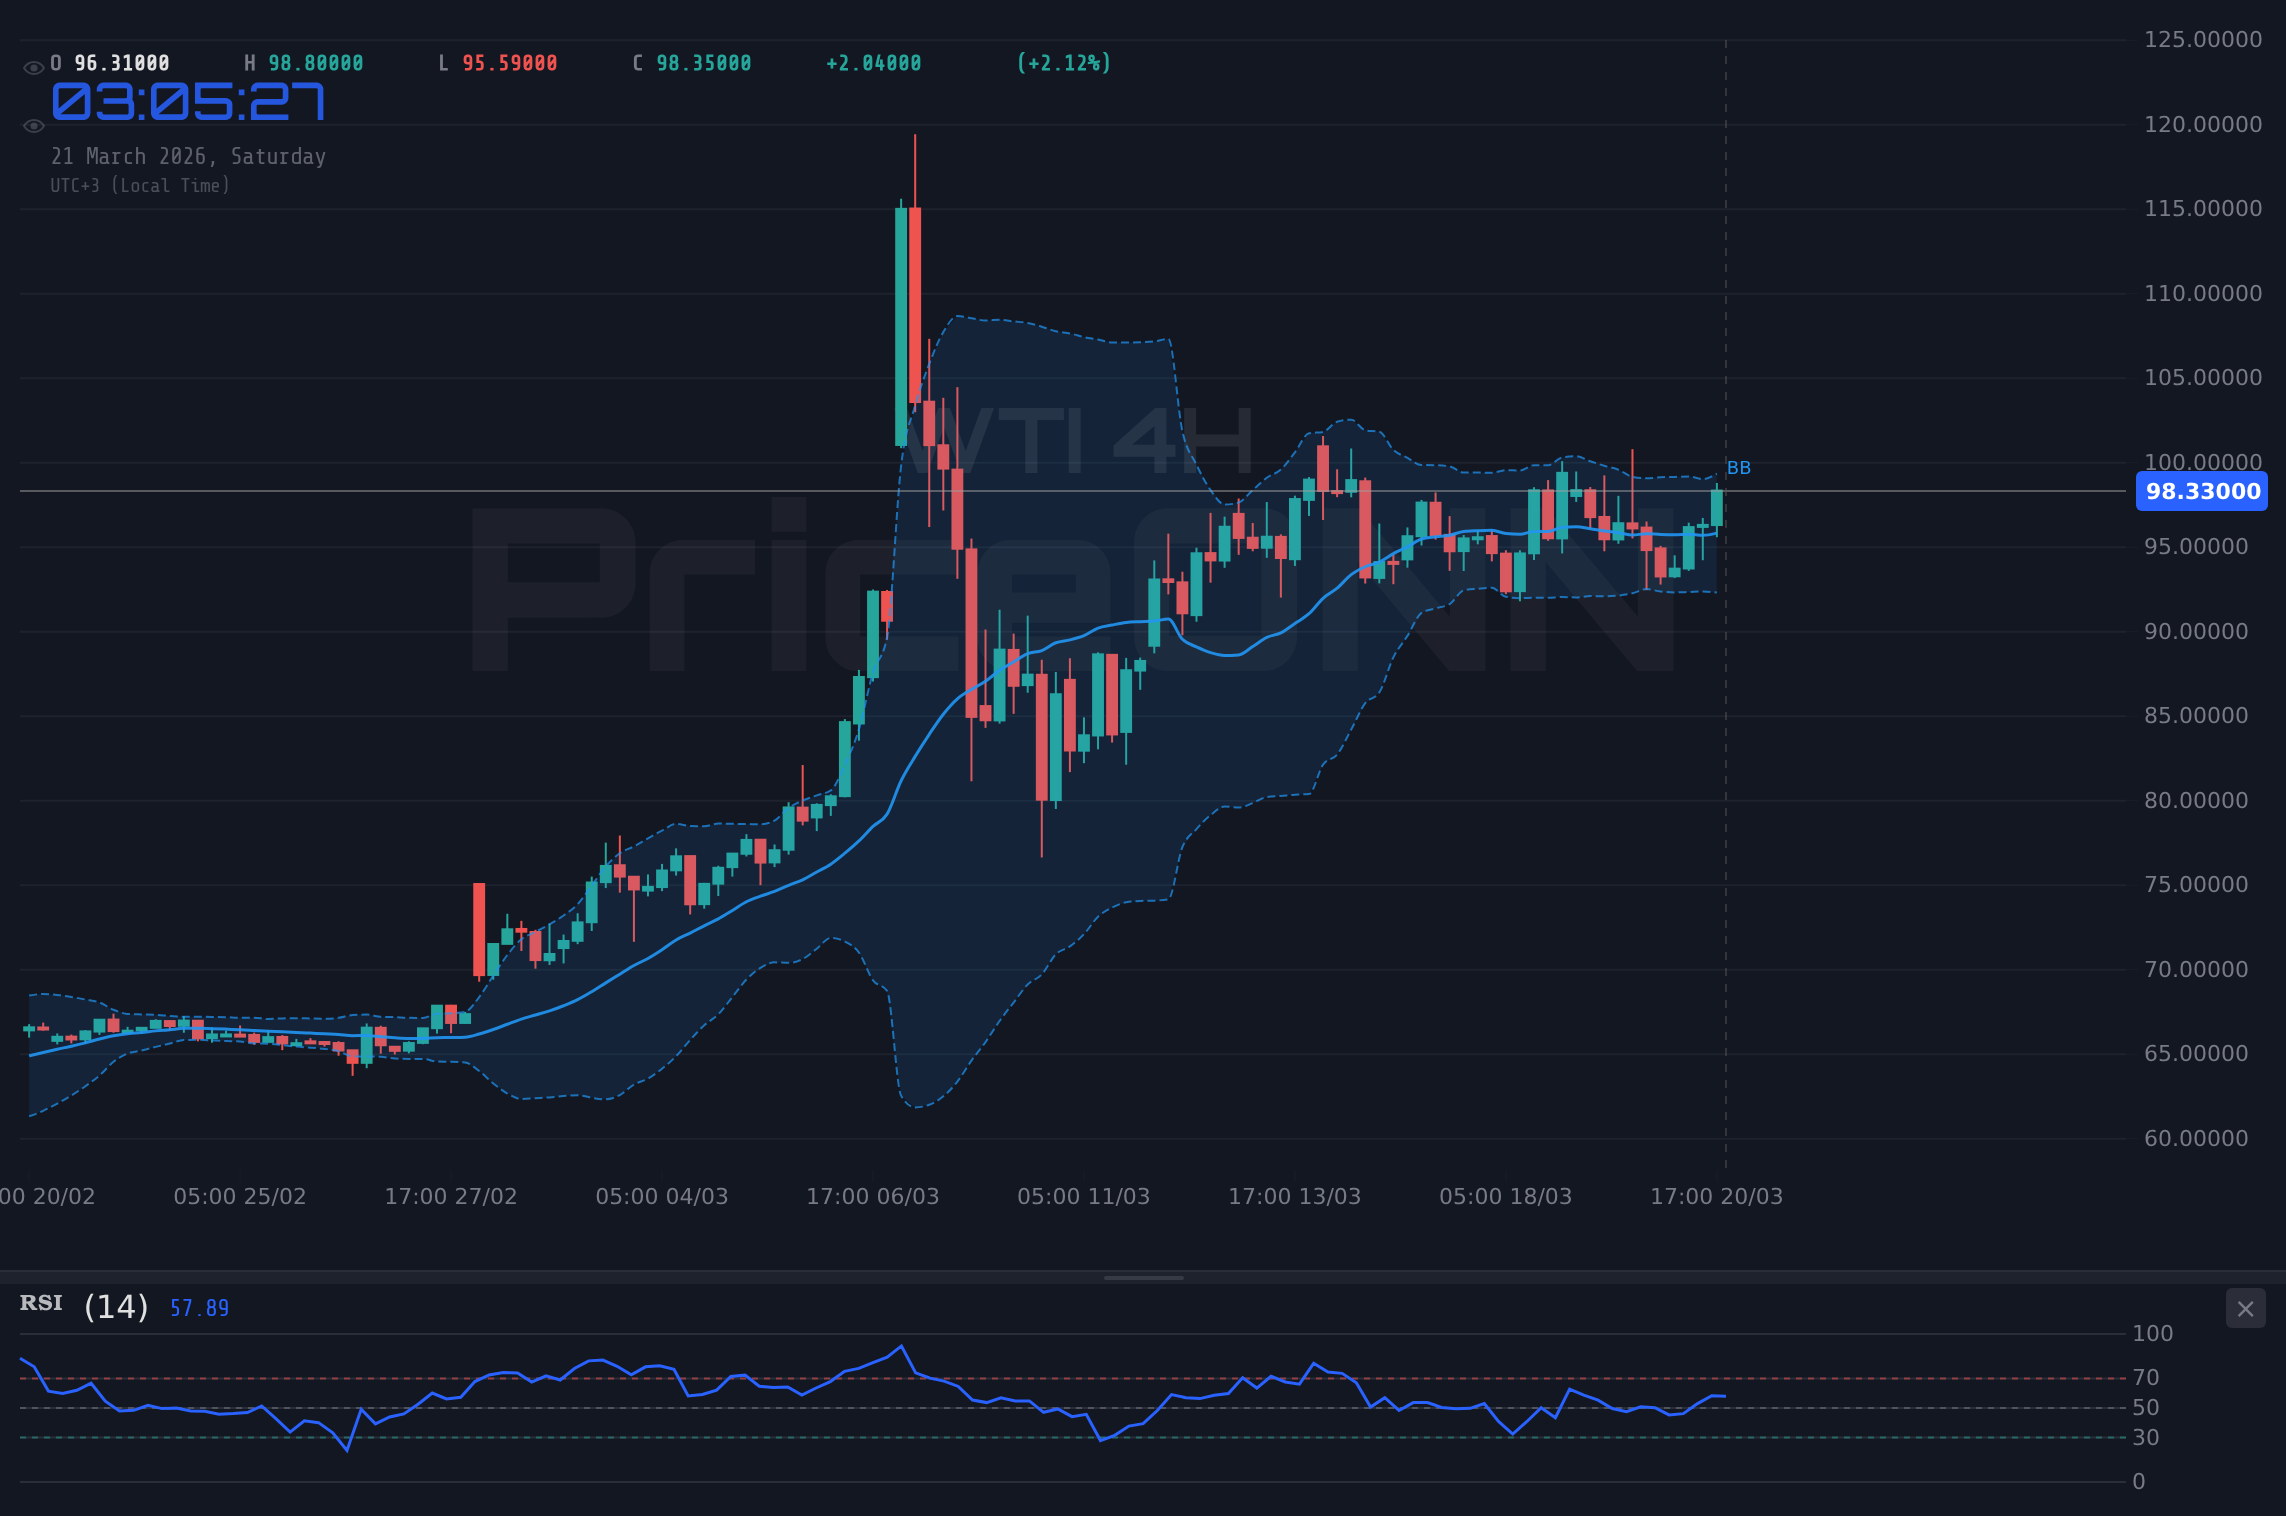
- Key support lies at $97.77, $96.64, and $96.00, while resistance is building at $99.54, $100.18, and $101.31.
- The RSI(14) on the 1-hour chart is at 62.14, indicating strong bullish momentum but nearing overbought territory, while the daily RSI at 70.65 suggests further upside may be limited without a broader market shift.
- Correlation analysis shows strength in Brent Crude ($112.79) and a rising DXY (99.39), creating mixed signals for WTI's next move.
The Bull's Roadmap: Sustaining the Surge Above $98.50
The bullish case for WTI crude oil hinges on its ability to maintain momentum above the $98.50 mark. On the 1-hour timeframe, the technical picture is overwhelmingly positive, with a trend strength of 99% and a generally bullish signal across indicators. The RSI(14) at 62.14 suggests that buyers are in control, pushing the price higher with conviction. Similarly, the Stochastic Oscillator, with %K at 92.01 and %D at 89.49, is deep in overbought territory but still showing upward momentum, often seen in strong trending markets. This suggests that while the immediate buying pressure is intense, it might be nearing a point where profit-taking could emerge. The ADX at 17.29 on this timeframe indicates a weaker trend, which might seem counterintuitive to the strong bullish signals, but it often accompanies sharp, short-term moves rather than sustained, grinding uptrends. This suggests that the current surge might be more of a sharp rally than the start of a long-term trend continuation, especially when viewed against the daily chart's context. The key here is whether this intraday strength can translate into a firm daily close above $98.50, setting the stage for a push towards the immediate resistance at $99.54. If this level is breached decisively, the next target becomes $100.18, a psychologically significant barrier that could ignite further bullish sentiment.
The fundamental drivers underpinning this bullish sentiment cannot be ignored. Geopolitical tensions in the Middle East remain a persistent background factor, providing a floor for oil prices. Any escalation or perceived threat to supply routes can swiftly trigger a risk-on rally in crude. Furthermore, the recent surge in Brent crude, which has outperformed WTI, trading at $112.79, suggests a broader strength in the oil market. This divergence often corrects, implying that WTI might have room to catch up if the underlying bullish factors persist. The widening Brent-WTI spread, hitting an 11-year high according to some reports, indicates specific market dynamics at play, potentially related to regional supply issues or refinery demands. For traders watching the bullish scenario unfold, the focus must be on confirmation: a sustained push above $98.50, followed by a decisive break of $99.54. The 4-hour chart, while showing a rising trend (82% strength), presents a slightly more nuanced picture with a negative MACD momentum and a Stochastic %K below %D, hinting at potential pullbacks. However, the overall bullish signal from this timeframe, coupled with the daily chart's RSI at 70.65, suggests that underlying demand remains robust. The key takeaway for bulls is that while short-term overbought conditions exist, the macro environment and specific oil market factors provide a supportive backdrop for continued upward price action, provided key resistance levels are conquered.
Where Bears Take Control: The Case for a Correction Below $98.50
Conversely, a bearish scenario for WTI crude oil would see the price falter below the crucial $98.50 support level. The technical indicators, particularly on longer timeframes, offer clues about potential downside risks. While the 1-hour chart paints a bullish picture, the daily chart presents a more cautionary stance. The ADX on the daily chart stands at a strong 41.79, indicating a powerful downtrend is in play, even if shorter timeframes show temporary rallies. The RSI(14) at 70.65 on the daily timeframe is firmly in overbought territory, suggesting that the recent rally might be overextended and ripe for a pullback. This is further supported by the Stochastic Oscillator's %K at 61.11 and %D at 51.74, which, despite being in bullish territory, shows a slowing momentum and potential for a bearish crossover. The MACD also exhibits positive momentum, but the Bollinger Bands on the daily chart are pushing towards the upper band, a classic sign that the price may be due for a reversion towards the mean. If WTI fails to hold $98.50, the immediate support at $97.77 becomes the next target. A break below this level could accelerate selling pressure, potentially testing the $96.64 support. The 4-hour chart's ADX of 13.05, indicating a weak trend, could also signal that the upward momentum is losing steam, making a downside reversal more probable if key resistance levels fail to break.
The fundamental landscape also provides reasons for caution. The strengthening US Dollar Index (DXY), currently at 99.39, acts as a headwind for oil prices, as a stronger dollar typically makes commodities priced in dollars more expensive for holders of other currencies, thus dampening demand. While the DXY itself shows mixed signals across timeframes, its upward push on the daily chart (ADX 34.64) cannot be ignored. Furthermore, any de-escalation in Middle East tensions, however unlikely, could remove a significant portion of the geopolitical risk premium currently baked into oil prices. News reports indicating efforts to calm regional conflict, such as those mentioned in the recent market updates, could trigger a swift unwinding of long positions. The S&P 500's tumble to 6536.05, down 1.21%, also signals a broader risk-off sentiment in financial markets. When equity markets decline sharply, investors often reduce their exposure to riskier assets, including oil, leading to selloffs. If this risk-off sentiment intensifies, WTI could face significant selling pressure, pushing it down towards its daily support levels. The bears' primary objective would be to break the $98.50 level decisively, followed by $97.77, aiming for a deeper correction towards the $96.00 psychological mark.
The Waiting Game: Consolidation Around $98.50
A neutral scenario, characterized by consolidation, is also a distinct possibility for WTI crude oil around the $98.50 price point. This often occurs when bullish and bearish forces are in relative equilibrium, or when the market awaits a significant catalyst. On the technical front, the divergence between the strong bullish signals on the 1-hour chart and the more cautious outlook on the daily chart (neutral trend strength of 50%) sets the stage for a potential range-bound trading environment. The RSI on the 1-hour chart is approaching overbought territory (62.14), while the daily RSI is also elevated (70.65), suggesting that neither bulls nor bears have complete control. This could lead to price action oscillating between the immediate support at $97.77 and resistance at $99.54. The weak trend indicated by the ADX on the 1-hour chart (17.29) further supports the idea of a lack of strong directional conviction. In such a scenario, scalpers might find opportunities within this range, while swing traders and longer-term investors would likely adopt a wait-and-see approach, seeking clearer signals or a breakout from the established range. The key levels to watch for consolidation would be the $97.77 support and the $99.54 resistance. Price action confined within this band could persist until a significant economic data release or geopolitical event provides a clear directional impetus.
From a fundamental perspective, consolidation could arise from conflicting economic signals. For instance, strong employment data might support oil demand, while high inflation figures could fuel concerns about aggressive central bank tightening, thus capping oil price gains. Upcoming economic events, such as crucial inflation reports or central bank policy statements, could be the triggers that break this consolidation. If the market is pricing in a certain outcome from these events, and the actual data deviates significantly, it could trigger a sharp move. The correlation with other markets also plays a role. A strengthening DXY (currently 99.39) might put downward pressure on oil, while a falling S&P 500 (6536.05) could signal reduced risk appetite, also weighing on crude. However, strong demand from China or continued supply disruptions in the Middle East could counteract these bearish influences. If WTI remains range-bound, traders might look for confirmation signals from volume analysis or order flow data, which are not provided in the current market context but are crucial for identifying true conviction within a trading range. The absence of a clear directional bias from major market participants or a lack of decisive fundamental news could keep WTI oscillating between its near-term support and resistance levels, creating a period of sideways price action.
Weighing the Scenarios: Which Path for WTI?
Assessing the probabilities for each scenario requires a careful look at the confluence of technical and fundamental factors. The immediate technical picture on the 1-hour chart is strongly bullish, suggesting that short-term traders might favor buying into dips towards $97.77, targeting a move back towards $99.54 and potentially $100.18. The daily RSI at 70.65, however, acts as a significant cautionary flag, indicating that the upside might be limited and a deeper correction is increasingly probable if key resistance fails. Historically, rallies that push daily RSIs into the 70-80 zone without strong fundamental catalysts often result in sharp reversals. The ADX on the daily chart at 41.79 confirms a strong existing downtrend, which means that any bullish moves might be viewed as corrective rallies within a larger bearish structure, rather than the start of a new uptrend. Given this, the bullish scenario, while supported by intraday momentum, appears to have a lower probability of sustained success in the medium term. The probability of a bearish move, targeting support levels below $98.50, seems more likely, especially if geopolitical tensions ease or the DXY continues its upward march.
The neutral consolidation scenario presents a moderate probability, particularly if upcoming economic data fails to provide a clear directional signal or if conflicting news emerges. This scenario often plays out in the lead-up to major economic events like Non-Farm Payrolls or central bank meetings, where markets adopt a cautious stance. However, the current strength in Brent crude and the persistent geopolitical risk premium suggest that a prolonged period of low volatility might be unlikely. Therefore, the most probable scenario, considering the technical indicators on the daily chart and the potential for geopolitical risk to recede or for the DXY to strengthen further, leans towards a bearish correction. The key trigger for this scenario would be a decisive close below $98.50 on the daily chart, followed by a break of the $97.77 support. This would invalidate the short-term bullish setup and open the door for a test of lower levels, potentially towards $96.00 or even lower if market sentiment shifts dramatically. The probability of the bearish scenario unfolding in the next week is estimated at around 55-60%, with consolidation holding a 30-35% chance, and a sustained bullish breakout below $100.18 carrying the remaining 5-10% probability.
What Traders Should Watch This Week
For short-term traders and scalpers, the immediate focus will be on the intraday price action around $98.50. A failure to hold this level could offer a shorting opportunity towards $97.77, with tight stops placed just above the $98.50 mark. Conversely, a strong push above $99.54, backed by increasing volume, might signal a continuation of the rally towards $100.18. These are tactical trades, requiring close monitoring of intraday charts and quick execution.
Swing traders will be looking for more confirmation. For them, a daily close below $98.50 would be a significant bearish signal, potentially initiating a short position targeting $96.64. On the bullish side, a sustained daily close above $100.18 would be required to consider a longer-term upside move, with targets extending towards $101.31 and beyond. They will be closely watching the daily RSI and ADX for signs of trend confirmation or reversal.
Long-term investors and position traders will be more concerned with the broader macroeconomic picture and geopolitical stability. They might view a pullback towards the $96.00 area as a potential buying opportunity if the underlying fundamentals (like sustained demand from China or ongoing supply constraints) remain intact. However, they must also be wary of a significant shift in central bank policy or a de-escalation of geopolitical tensions, which could fundamentally alter the supply-demand balance and lead to a more prolonged downturn. The correlation with the DXY and equity markets will be crucial for this cohort, as sustained dollar strength or a broad market selloff could negate bullish factors in oil.
Crucially, the market will be digesting upcoming economic data. Key releases such as inflation figures (CPI, PCE) and employment reports (NFP) will be vital in shaping expectations for central bank policy. Any deviation from forecasts could trigger significant volatility across all asset classes, including WTI. Furthermore, any significant developments in the Middle East will undoubtedly command immediate attention and could override other technical or fundamental considerations. Traders should also monitor the Brent-WTI spread; a continued widening could signal specific supply issues that might impact WTI's price independently of broader market trends.
The Bear's Playbook: Retreat Below $98.50
60% ProbabilityThe Waiting Game: Range-Bound at $98.50
30% ProbabilityBullish Persistence: Breaking $100.18
10% ProbabilityFrequently Asked Questions: WTI Crude Oil Analysis
What happens if WTI breaks below $98.50 support next week?
A daily close below $98.50 would invalidate the short-term bullish setup and likely trigger a move towards the $97.77 support level. If this gives way, the next target would be $96.64, especially if broader market sentiment turns risk-off or the DXY strengthens significantly.
Should I buy WTI at current levels of $98.50 given the daily RSI at 70.65?
Buying at current levels with the daily RSI at 70.65 is risky, as it suggests the market is nearing overbought conditions. A more prudent approach would be to wait for a pullback towards support levels like $97.77 or confirmation of a breakout above $99.54, ideally with strong volume and fundamental backing.
Is the daily ADX at 41.79 a sell signal for WTI right now?
An ADX of 41.79 on the daily chart indicates a very strong trend, but it doesn't specify the direction. Combined with the elevated RSI, it suggests that the current bullish momentum might be part of a larger, established trend that could reverse. Bears would look for a bearish signal confirmation, while bulls need to see the trend strength sustain higher prices.
How will upcoming inflation data affect WTI crude oil prices this week?
Higher-than-expected inflation could pressure oil prices if it fuels fears of aggressive central bank rate hikes, potentially dampening demand. Conversely, if inflation is seen as transitory or driven by supply-side issues that support oil prices (like geopolitical risks), it might not negatively impact WTI. The market's reaction will depend heavily on the overall economic context and central bank forward guidance.
The interplay between technical signals and fundamental drivers creates a complex trading environment for WTI crude oil. While intraday momentum favors the bulls, the longer-term charts and macroeconomic correlations suggest caution. The $98.50 level is pivotal; a decisive break below it could signal the end of the current rally and initiate a significant correction. Conversely, a sustained hold and subsequent push above $99.54, especially towards $100.18, would signal a continuation of the bullish trend. Traders must remain vigilant, manage risk meticulously, and await clear signals before committing significant capital. Patience and discipline will be key in navigating these choppy waters.
Track markets in real-time
AI-powered analysis, technical indicators and real-time price data.
Join Our Telegram Channel
Breaking market news, AI analysis and trading signals instantly.
Join Channel