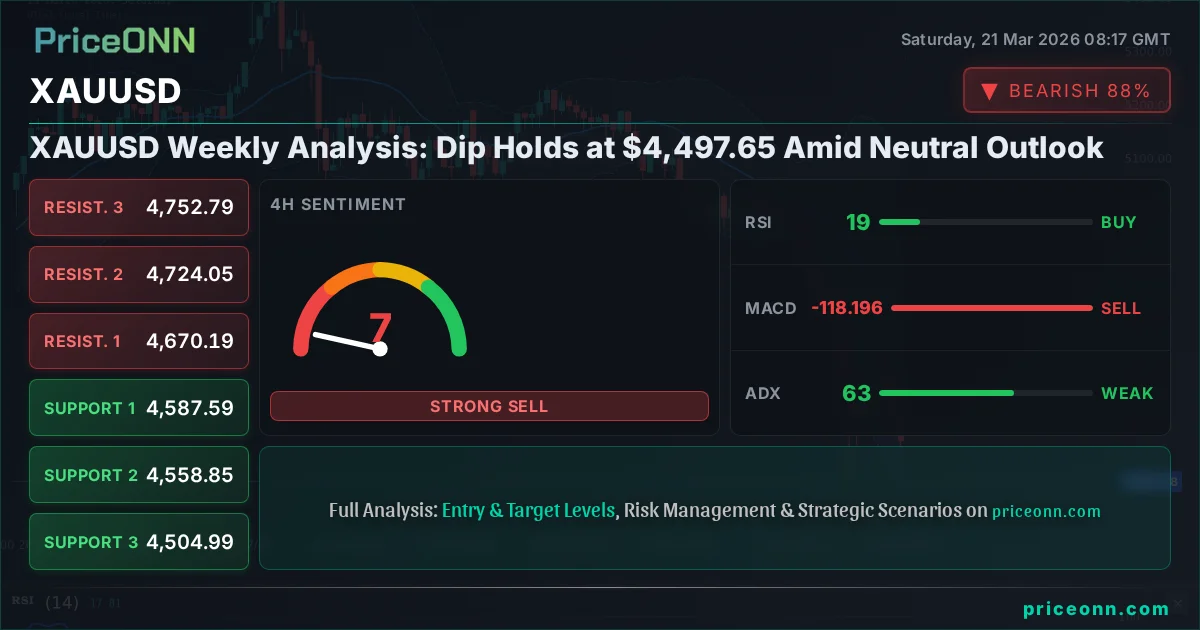
XAUUSD Weekly Analysis: Dip Holds at $4,497.65 Amid Neutral Outlook
Gold (XAUUSD) stabilized around $4,497.65 after a sharp weekly decline. Technical indicators suggest a neutral stance, awaiting clearer direction from macro drivers.
The gold market, closely watched by traders and investors alike, has found a tentative footing around the critical $4,497.65 level following a tumultuous week. After experiencing a significant weekly decline, marked by a 3.28% drop or $152.56, the precious metal is currently navigating a period of consolidation. This price action comes at a time when broader market sentiment is shifting, influenced by a complex interplay of geopolitical tensions, central bank policy expectations, and shifting macroeconomic data. Understanding the nuances of these forces is paramount for deciphering gold's next move. This week’s price action, culminating in a close near $4,497.65, sets the stage for a pivotal period, where the balance between safe-haven demand and the impact of rising yields will likely dictate the short-to-medium term trajectory. The coming days will be crucial for determining whether the current support holds or if further downside pressure will emerge, especially with key economic events on the horizon.
- XAUUSD is currently trading at $4,497.65, following a 3.28% weekly decline.
- The 1-hour RSI at 28.95 signals oversold conditions, suggesting potential short-term buying opportunities.
- Key support is holding at $4,458.67, while resistance looms at $4,559.54 on the 1-hour chart.
- Geopolitical tensions and rising US yields are creating conflicting pressures on gold's safe-haven appeal.
The $4,497.65 Line: A Battleground for Gold's Direction
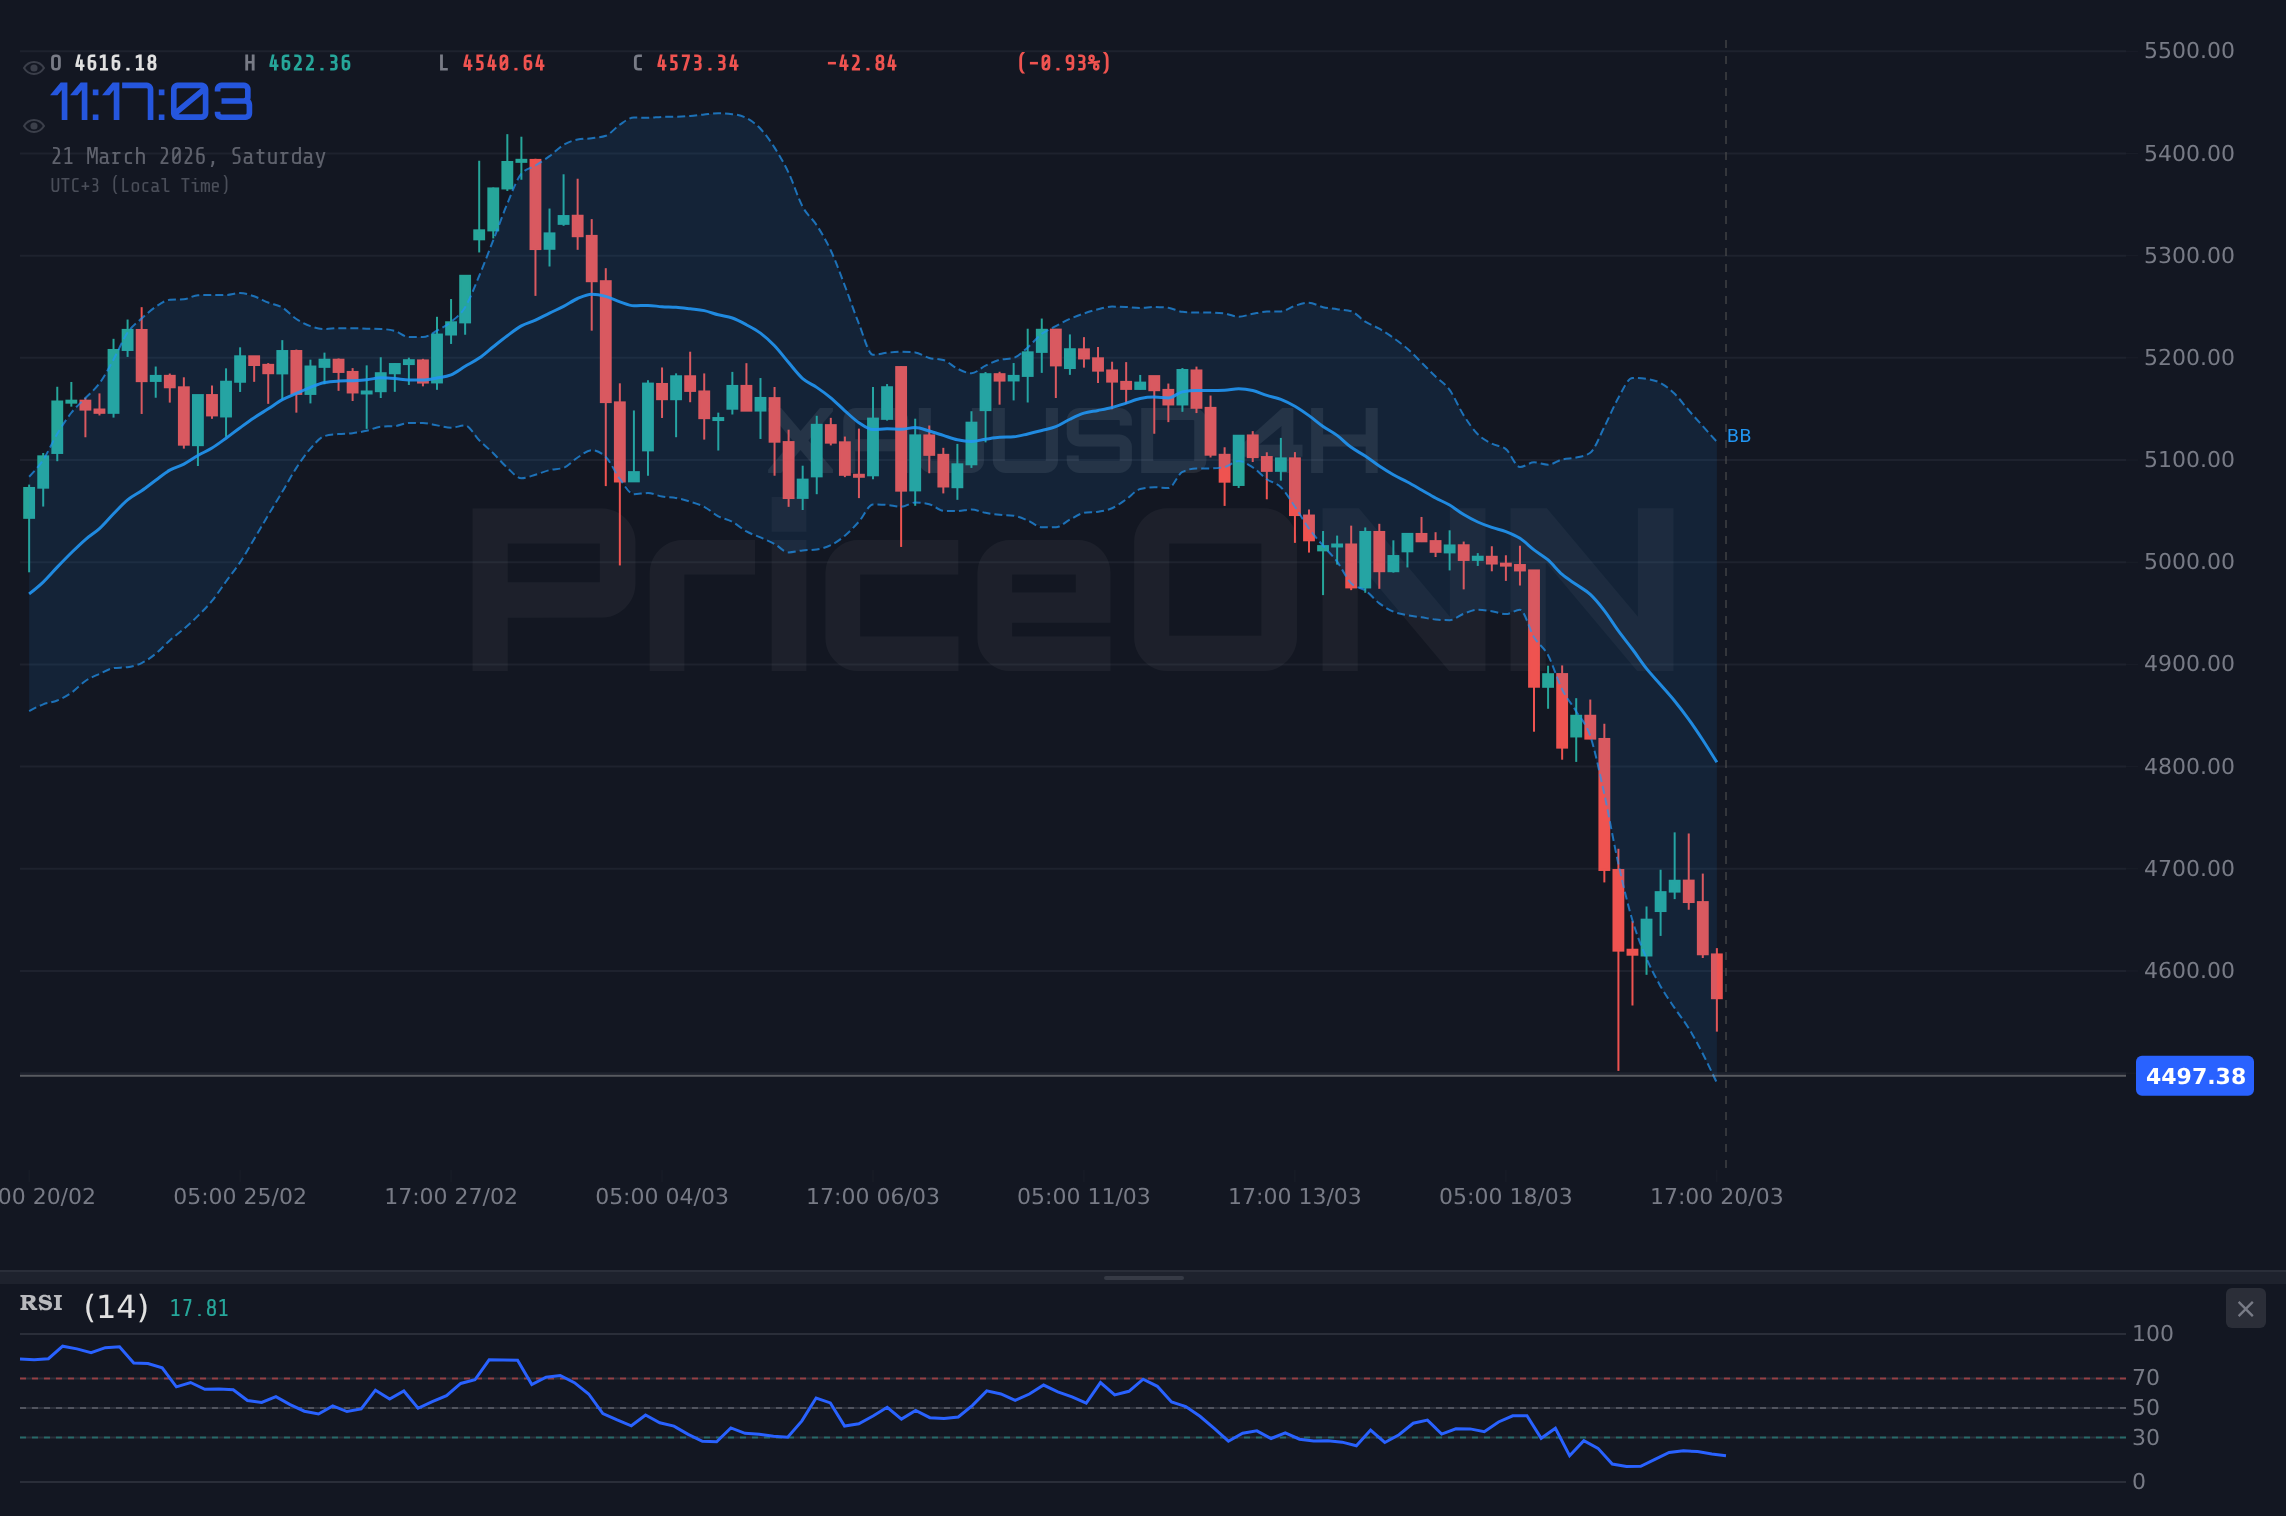
The weekly chart for XAUUSD painted a rather grim picture for gold bulls, culminating in a sharp decline that saw the price tested below $4,500. The current price of $4,497.65 reflects significant selling pressure that emerged over the past few trading sessions. Looking at the 1-hour timeframe, the trend is decidedly bearish with a strength of 91%, indicating that short-term momentum is firmly to the downside. However, the RSI(14) reading of 28.95 on this timeframe is a crucial data point. This sits squarely in oversold territory, a condition that historically can precede a bounce or at least a pause in the selling. The MACD indicator also supports the bearish momentum, remaining below its signal line, but the extremely low RSI suggests that the selling might be overextended in the very short term. The Bollinger Bands are also signaling a break below the lower band, a sign of aggressive selling, but not necessarily a continuation signal on its own without further confirmation.
The 4-hour chart paints an even starker picture, with a 100% bearish trend strength. Here, the RSI(14) plummets to 19.17, an even deeper oversold condition that historically warrants attention. The ADX at 62.9 confirms a very strong downtrend is in place on this timeframe. This suggests that while short-term oversold conditions might offer a reprieve, the dominant trend remains firmly downwards. The General Signal across the 1-hour and 4-hour timeframes is overwhelmingly 'SELL', with only 2 'BUY' signals out of 8 across both. This divergence between the extreme oversold readings and the strong bearish trend signals is where the market's current indecision lies. Traders are weighing the possibility of a technical bounce against the fundamental headwinds that are driving the price down.
On the daily timeframe, the trend is described as 'Neutral' with 50% strength, which is a significant shift from the shorter timeframes. This neutrality on the daily chart, despite the strong bearish signals on hourly and 4-hourly charts, highlights the market's current indecision. The RSI(14) at 29.58 is still in oversold territory, but the ADX at 19.51 indicates a weak trend. This suggests that while the downtrend has been strong on shorter frames, the larger daily picture is consolidating or waiting for a decisive catalyst. The support level at $4,479.29 is critical here. A break below this could signal a continuation of the aggressive downtrend seen on shorter timeframes, while holding above it might allow for a stabilization and potential retest of higher resistance levels around $4,844.03.
The conflict in the Middle East, currently a significant geopolitical driver, has added a layer of complexity. While such tensions traditionally boost gold's appeal as a safe-haven asset, the current market environment sees other factors exerting stronger influence. Rising US Treasury yields, fueled by expectations of persistent inflation and a potentially hawkish stance from the Federal Reserve, are making interest-bearing assets more attractive relative to non-yielding gold. This dynamic is creating a tug-of-war: geopolitical fears push gold higher, while yield differentials pull it lower. The recent news mentioning gold tumbling below $4,500 as rising US yields dim safe-haven appeal perfectly encapsulates this conflict. This is a crucial point for analysts and traders to monitor closely as it directly impacts the underlying demand for gold.
The correlation with the US Dollar Index (DXY) is also a key element to consider. The DXY is currently showing a strengthening trend, particularly on the daily timeframe with an ADX of 34.64. A rising dollar typically exerts downward pressure on gold, as dollar-denominated commodities become more expensive for holders of other currencies. The DXY's current price of 99.39 further reinforces this. When the dollar strengthens significantly, as it has been doing, it often overshadows safe-haven bids for gold driven by geopolitical uncertainty. This inverse relationship is a classic market dynamic, and its current manifestation is a significant headwind for gold prices, contributing to the bearish sentiment observed across shorter timeframes.
Navigating the Conflicting Signals: A Trader's Dilemma
The current technical picture for XAUUSD presents a classic dilemma for traders: extreme oversold conditions on shorter timeframes clashing with a dominant bearish trend on the 4-hour chart and a neutral stance on the daily. On the 1-hour chart, the RSI at 28.95 and Stochastic at K=13.36, D=13.89 are screaming 'oversold'. This suggests that the recent sharp sell-off might have exhausted some of the immediate selling pressure. However, the ADX at 31.58 on this timeframe indicates a strong downtrend is still in play, meaning any bounce could be short-lived. This is a crucial point: oversold does not automatically mean 'buy'. It means the selling may have gone too far, too fast, increasing the probability of a short-term correction or consolidation.
The 4-hour chart amplifies this conflict. With an RSI of 19.17 and an ADX soaring to 62.9, the trend is undeniably bearish and strong. This suggests that the short-term oversold conditions might be mere pauses within a larger, more powerful downward move. The General Signal across both the 1-hour and 4-hour charts is heavily skewed towards 'SELL', with only 2 'BUY' signals out of 16. This overwhelming bearish sentiment on shorter timeframes cannot be ignored. It implies that any attempt at a recovery might face immediate selling pressure as traders look to exit positions or initiate new shorts, especially if the price approaches resistance levels like $4,559.54.
The daily chart offers a glimmer of hope for the bulls, or at least a reason for caution for the bears. A 'Neutral' trend with 50% strength, coupled with an RSI of 29.58 still in oversold territory, suggests that the aggressive selling might be losing steam on the longer timeframe. The ADX at 19.51 indicates a weak trend, which can precede a period of consolidation or a potential trend reversal. However, the critical support at $4,479.29 on the daily chart is the line in the sand. A decisive break below this level would invalidate the neutral outlook and likely trigger further selling, targeting the next support at $4,308.39. Conversely, holding this level could pave the way for a retest of the daily resistance at $4,844.03, though this seems a distant prospect given the current bearish momentum.
The price action this week has been significantly influenced by macroeconomic factors, particularly the ongoing narrative around interest rates and inflation. The news that gold tumbled below $4,500 as rising US yields dim safe-haven appeal is a prime example. This highlights how the market is currently prioritizing the yield differential offered by US Treasuries over the traditional safe-haven status of gold, especially when geopolitical risks are perceived as potentially manageable or already priced in. The Federal Reserve's stance, which appears to be leaning towards maintaining higher rates for longer to combat sticky inflation, is a key driver here. Any indication of a hawkish policy shift from the Fed could further strengthen the dollar and weigh on gold prices, pushing it further away from its recent highs.
Furthermore, the energy markets are playing a crucial role, with Brent crude oil currently trading at $112.79 and WTI at $98.50, both showing strong upward momentum. Rising oil prices have a dual effect: they can fuel inflation expectations, which might typically support gold, but they also increase input costs for businesses and can dampen economic activity, potentially reducing risk appetite and indirectly supporting gold as a safe haven. However, the current correlation seems to be dominated by the impact of rising oil prices on inflation expectations and, consequently, on central bank policy. If sustained high energy prices contribute to persistent inflation, central banks might be forced to maintain or even increase interest rates, creating a strong headwind for gold. The news mentioning why consumers will bear the brunt of the latest energy shock, unlike a decade ago, underscores the potential inflationary impact, which keeps the focus squarely on central bank responses.
The extremely oversold conditions indicated by RSI and Stochastic on shorter timeframes (1H and 4H) do not guarantee a price reversal. The strong bearish trend on the 4-hour chart (ADX 62.9) and the overall negative sentiment suggest that any bounce could be a 'bear market rally' rather than a sustained uptrend. Traders should exercise caution and await clear confirmation signals before initiating long positions.
The $4,497.65 Conundrum: What's Next for Gold?
The current market environment for XAUUSD is characterized by a significant tug-of-war between fundamental pressures and technical signals. On one hand, the aggressive selling that pushed gold down to $4,497.65 has created extreme oversold conditions on shorter timeframes. The RSI readings below 30 on the 1-hour and 4-hour charts are strong indicators that the immediate selling pressure might be waning. This could lead to a short-term technical bounce, potentially targeting the first resistance level at $4,559.54. The daily chart’s neutral trend also suggests that while the bears have been dominant recently, the larger picture hasn’t entirely collapsed, leaving room for a potential stabilization.
However, the fundamental backdrop remains challenging for gold. The strengthening US Dollar Index (DXY), currently at 99.39 and showing a strong daily trend, is a significant headwind. As the dollar gains strength, gold becomes more expensive for holders of other currencies, dampening demand. This is exacerbated by rising US Treasury yields, which offer attractive returns compared to non-yielding gold. The market's focus on persistent inflation and the Federal Reserve's potentially hawkish stance means that higher yields could persist, further pressuring gold. The news highlighting gold's tumble below $4,500 due to rising US yields perfectly illustrates this dynamic. Until these macro pressures abate or shift, any significant upside in gold might be capped.
The geopolitical situation, while typically a bullish catalyst for gold, is currently being overshadowed. While tensions in the Middle East are escalating, the market appears to be pricing in a degree of containment or is prioritizing the economic outlook. This suggests that even if geopolitical risks remain elevated, their impact on gold might be muted unless they directly threaten major supply routes or trigger widespread economic disruption. For gold to regain its safe-haven footing convincingly, a more severe escalation or a clear shift in central bank policy expectations would likely be needed.
From a technical perspective, the $4,479.29 level on the daily chart is a crucial support. A hold above this level could signal a bottoming process, while a break below would signal a continuation of the strong downtrend seen on shorter timeframes, potentially targeting $4,308.39. On the upside, resistance at $4,559.54 on the 1-hour chart and $4,670.19 on the 4-hour chart will be key levels to watch. A sustained move above these resistances, particularly if accompanied by improving market sentiment and easing yield pressures, could signal a more significant recovery. However, given the current conflicting signals and the strong bearish momentum on shorter timeframes, caution is advised.
The overall market sentiment remains cautious. The significant drops in gold, silver, and copper prices this week, wiping billions off mining stocks, suggest a broader risk-off sentiment or a deleveraging across commodities. The news that gold, silver, and copper prices have tumbled significantly, with copper entering a bear market, indicates a rotation away from perceived risk assets or a response to tightening monetary conditions. This broader commodity weakness adds another layer of complexity, suggesting that gold might be trading more as a risk-on asset influenced by liquidity conditions rather than a pure safe haven at this moment. The outlook remains neutral to bearish until clearer signals emerge from either the macroeconomic front or a significant shift in technical momentum.
For short-term traders, the extreme oversold conditions on the 1-hour chart (RSI 28.95) might present a scalp opportunity for a bounce towards $4,559.54. However, the risk of this bounce failing is high, given the strong 4-hour bearish trend (ADX 62.9). A prudent approach would be to wait for confirmation, such as a close above $4,559.54 on the 1-hour chart, or a clear reversal pattern forming on the daily chart. For longer-term investors, the neutral daily trend and the critical support at $4,479.29 present a potential observation point. A hold here could form the basis for a longer-term recovery, but conviction is lacking without a shift in macro drivers.
The Path Forward: What to Watch for XAUUSD
Looking ahead, the trajectory of XAUUSD will likely remain highly sensitive to shifts in macroeconomic expectations and geopolitical developments. The Federal Reserve's policy path is arguably the most significant driver. Should inflation data continue to surprise to the upside, forcing the Fed to signal a more hawkish stance or delay anticipated rate cuts, the upward pressure on US Treasury yields would likely intensify, posing a continued challenge for gold. Conversely, any signs of inflation cooling more rapidly than expected, or a dovish pivot from the Fed, could alleviate this pressure, strengthen gold's safe-haven appeal, and potentially lead to a retest of higher resistance levels.
Geopolitical developments, while currently overshadowed, remain a wildcard. Any significant escalation in the Middle East or unexpected global instability could quickly reignite safe-haven demand for gold, potentially overriding the influence of rising yields. Monitoring news flow from sources like Reuters and Bloomberg regarding the Iran conflict and its potential impact on oil supply and global stability will be crucial. The recent news about the Iran conflict potentially undermining the entire AI stock rally highlights how interconnected these risks are, and how quickly sentiment can shift.
Technically, the key levels remain paramount. The support at $4,479.29 on the daily chart is the immediate line to watch. A failure to hold this level could see gold prices pressured towards the $4,308.39 support. On the upside, clearing the $4,559.54 resistance on the 1-hour chart is the first hurdle. A more significant move would require breaking through the $4,670.19 resistance on the 4-hour chart. Confirmation of a sustained trend change would likely require a break above the daily resistance at $4,844.03, a scenario that seems less probable in the immediate term given the current macro environment.
The broader commodity market sentiment, as indicated by the significant drops in silver and copper prices, also warrants attention. If this risk-off sentiment in commodities continues, it might suggest that gold is currently trading more as a risk asset influenced by liquidity conditions rather than a traditional safe haven. This means that factors like equity market performance and dollar strength might have an outsized impact on gold prices in the near term. The news citing chart data showing billions wiped off mining stocks as gold, silver, and copper prices plummet underscores this broader commodity weakness.
In essence, the outlook for XAUUSD remains neutral to cautiously bearish in the short-to-medium term, heavily dependent on the interplay between interest rate expectations, inflation data, and geopolitical stability. While extreme oversold conditions offer potential for short-term bounces, the fundamental headwinds are significant. Patience and a focus on key technical levels will be crucial for navigating this uncertain period. The market is waiting for a clearer directive, and until then, consolidation or range-bound trading might prevail, punctuated by sharp moves driven by news catalysts.
While the immediate outlook is complex, the current oversold RSI readings (28.95 on 1H, 19.17 on 4H) coupled with the neutral daily trend suggest that a potential short-covering rally could emerge if key resistance levels are breached. Traders looking for opportunities should monitor the $4,559.54 resistance on the 1H chart. A successful break and hold above this level, particularly if supported by positive shifts in US yield expectations or a de-escalation of geopolitical tensions, could signal a short-term bullish reversal. However, risk management remains paramount.
Frequently Asked Questions: XAUUSD Analysis
What happens if XAUUSD breaks below the $4,479.29 support level on the daily chart?
A break below the daily support at $4,479.29 would invalidate the neutral outlook and signal a continuation of the strong bearish trend seen on shorter timeframes. This could trigger further downside pressure, potentially targeting the next significant support level at $4,308.39. Such a move would likely be driven by persistent US yield increases or a significant shift in market risk sentiment.
Should I buy XAUUSD at current levels around $4,497.65 given the oversold RSI?
Buying at current levels around $4,497.65 based solely on oversold RSI (28.95 on 1H) is a high-risk strategy. While a short-term bounce is possible, the dominant 4-hour bearish trend (ADX 62.9) suggests caution. A more prudent approach would be to wait for confirmation, such as a clear break above the $4,559.54 resistance, or a bullish divergence pattern on the daily chart. Risk management is key.
Is the RSI at 28.95 on the 1-hour chart a sell signal for XAUUSD right now?
An RSI reading of 28.95 on the 1-hour chart is considered oversold, not typically a sell signal. It indicates that selling pressure may be exhausted in the short term, potentially leading to a pause or a bounce. However, in the context of a strong downtrend (ADX 31.58 on 1H), an oversold reading alone is not a reason to buy. It suggests that the downward momentum might be decelerating, but confirmation of a trend reversal is needed.
How will rising US yields and geopolitical tensions affect XAUUSD this week?
Rising US yields are currently exerting more pressure on XAUUSD than geopolitical tensions, dimming gold's safe-haven appeal. This dynamic is likely to continue this week unless there's a significant shift in Fed policy expectations or a major geopolitical escalation. If yields continue to climb, expect gold to remain under pressure, potentially testing lower support levels. Conversely, a pause in yield increases or heightened geopolitical fears could provide some support.
Bearish Scenario: Downtrend Continuation
65% ProbabilityNeutral Scenario: Consolidation Around $4,497.65
25% ProbabilityBullish Scenario: Technical Bounce
10% Probability| Indicator | Value | Signal | Interpretation |
|---|---|---|---|
| RSI (14) | 28.95 | Oversold | Potential for short-term bounce, but trend remains key. |
| MACD | -152.56 | Bearish Momentum | MACD histogram below signal line, confirming downward pressure. |
| Stochastic | K=13.36, D=13.89 | Oversold | Extreme readings suggest selling exhaustion, but confirmation needed. |
| ADX | 31.58 | Strong Trend | Indicates a strong bearish trend is in place on the 1H chart. |
| Bollinger Bands | Lower Band Break | Bearish Break | Price trading below the lower band signals aggressive selling. |
The gold market finds itself at a critical juncture, trading at $4,497.65 after a significant weekly sell-off. While extreme oversold conditions on shorter timeframes hint at a potential for a technical bounce, the prevailing macroeconomic headwinds - namely rising US Treasury yields and a strengthening dollar - continue to exert considerable downward pressure. Geopolitical tensions remain a background factor that could quickly shift the narrative, but currently, they are not strong enough to override the bearish impact of yield differentials. The neutral stance on the daily chart suggests that while the recent downtrend has been sharp, the larger picture is still undecided. Traders must remain vigilant, closely monitoring the key support at $4,479.29 and resistance at $4,559.54, as a decisive break in either direction will likely dictate the next significant move for XAUUSD. Patience and disciplined risk management are essential as the market seeks clearer direction.
Track markets in real-time
AI-powered analysis, technical indicators and real-time price data.
Join Our Telegram Channel
Breaking market news, AI analysis and trading signals instantly.
Join Channel