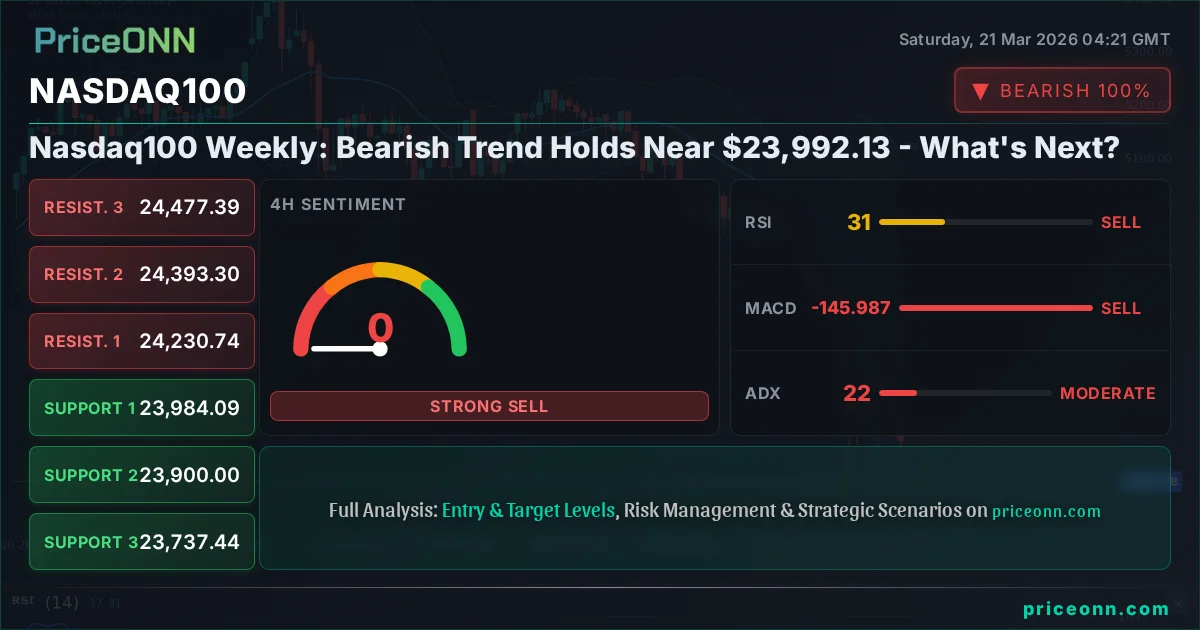
Nasdaq100 Weekly: Bearish Trend Holds Near $23,992.13 - What's Next?
Nasdaq100 struggles below $23,992.13 as bearish trends persist. Key levels and economic data to watch next week for potential shifts.
The Nasdaq100 closed last week hovering precariously near the $23,992.13 mark, a level that has become a focal point for the ongoing tug-of-war between bulls and bears. As we step into a new trading week, the prevailing sentiment leans bearish, with strong technical indicators suggesting the downtrend remains firmly in control. This analysis delves into the critical events of the past week, the technical landscape shaping the Nasdaq100's trajectory, and the crucial economic data and price levels to monitor in the coming days. We aim to dissect the forces at play, understand the implications of current market conditions, and prepare for potential scenarios that could unfold.
- The Nasdaq100 finished the week with a bearish signal, RSI at 37.26 indicating room for further downside.
- Critical support for the index sits at $23,770.36, tested multiple times this past week.
- MACD histogram shows negative momentum, suggesting bearish pressure is building on the 1D chart.
- The correlation with a strengthening DXY at 99.39 is a key factor, potentially pressuring tech stocks.
Last week was a stark reminder of the market's sensitivity to both macroeconomic shifts and geopolitical undercurrents. The Nasdaq100 experienced significant volatility, ultimately succumbing to selling pressure that pushed it towards critical support levels. The daily close on Friday at $23,992.13 reflects a market grappling with persistent inflation concerns and the potential for a more hawkish stance from central banks, despite recent signals of a pause. This environment has dampened risk appetite, leading investors to question the sustainability of previous rallies and to reassess the broader economic outlook. The interplay between rising bond yields, a strengthening dollar, and the tech-heavy Nasdaq has created a challenging backdrop, where every upward move appears to be met with renewed selling pressure.
The closing price of $23,992.13 for the Nasdaq100 at the end of last week underscores the bearish sentiment that has taken hold. The index saw a notable daily decline of 1.65%, closing at $23,992.13. This downward momentum was reflected across major indices, with the S&P 500 falling 1.21% and the Dow Jones Industrial Average dropping 0.62%. This broad-based weakness in the equity markets suggests that the headwinds are not confined to the tech sector alone but are rather systemic, driven by a confluence of factors including persistent inflation data, hawkish central bank rhetoric, and escalating geopolitical tensions, particularly in the Gulf region. The safe-haven appeal of assets like gold, which tumbled significantly, also points to a risk-averse market environment, further pressuring growth-oriented assets like those heavily represented in the Nasdaq.
The Shifting Sands: Economic Data and Central Bank Signals
The economic calendar last week provided crucial, albeit mixed, signals that have directly influenced market sentiment and, consequently, the Nasdaq100's performance. While some indicators suggested resilience in certain sectors, the overarching narrative has been one of persistent inflation and the potential for delayed interest rate cuts. The Federal Reserve's recent communications have been particularly scrutinized. While a pause in rate hikes might have been anticipated, the underlying tone has often hinted at a readiness to maintain higher rates for longer if inflation proves stubborn. This has led to a recalibration of market expectations, with traders now pricing in a lower probability of aggressive rate cuts in the near term. The strengthening US Dollar Index (DXY), which ended the week around 99.39, further complicates the picture for growth assets, as a stronger dollar typically increases the cost of capital and reduces the attractiveness of future earnings for multinational tech companies that dominate the Nasdaq.
The implications of the current monetary policy stance cannot be overstated. As the Federal Reserve navigates the complex terrain of inflation control and economic growth, its decisions directly impact borrowing costs, corporate valuations, and investor sentiment. The market's interpretation of Fed speak, meeting minutes, and economic data releases has become paramount. Last week's data, while showing some pockets of strength, did not provide enough evidence for a decisive dovish pivot. This has kept Treasury yields elevated, making riskier assets like equities less appealing by comparison. The correlation between the Nasdaq100 and the DXY is a critical dynamic to watch. As the dollar index shows strength, often driven by expectations of higher-for-longer interest rates, it tends to exert downward pressure on the Nasdaq, reflecting a global tightening of financial conditions and reduced capital flows into growth sectors.
Navigating the Technical Terrain: Nasdaq100's Chart Patterns
From a technical perspective, the Nasdaq100's chart paints a decidedly bearish picture as we head into the new week, with the price closing near $23,992.13. The daily chart (1D) reveals a weakening trend, despite some short-term fluctuations. The ADX indicator at 36.06 on the daily timeframe signifies a strong downtrend, a far cry from the conditions needed for a sustainable rally. The RSI(14) reading of 32.5 further reinforces this bearish outlook; while it hovers in the neutral zone, it indicates significant room for further decline before reaching oversold territory. The MACD, with its histogram remaining negative and below the signal line, confirms the prevailing bearish momentum. This technical confluence suggests that any short-term bounces are likely to be met with selling pressure, and the path of least resistance appears to be downwards.
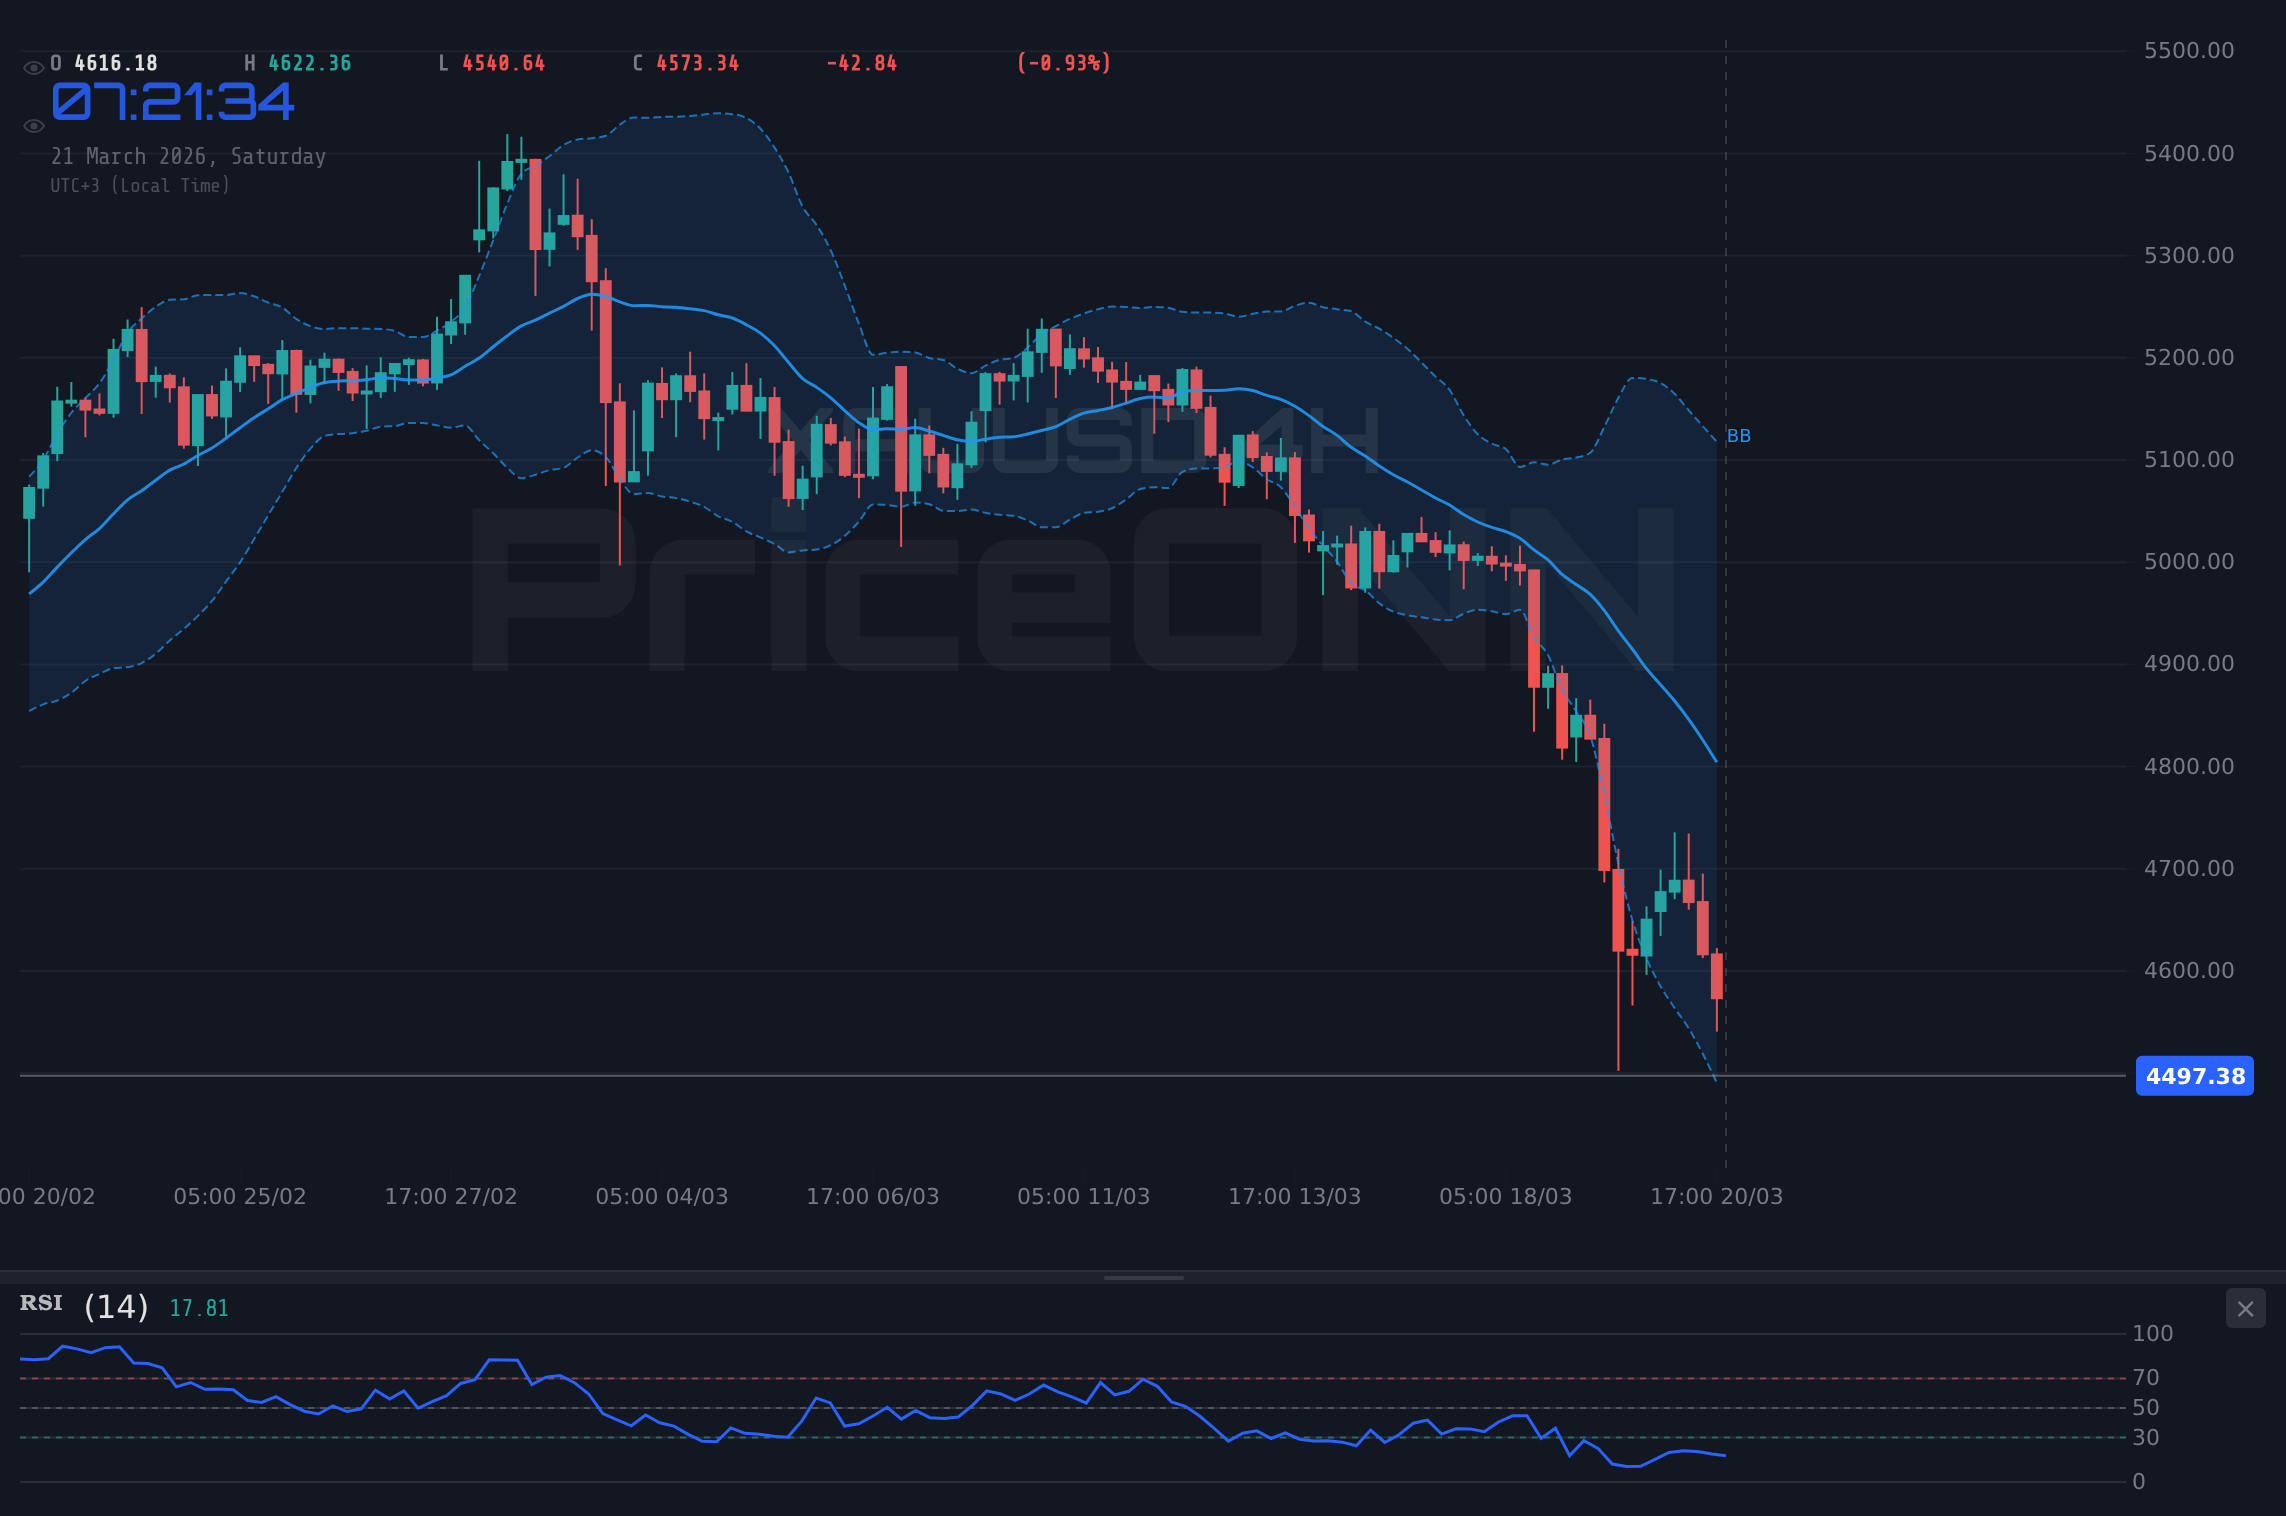
Looking at the shorter timeframes, the 4-hour chart reinforces the bearish sentiment. The ADX here is a staggering 22.4, indicating a moderate downtrend is in play. The RSI(14) at 31.45 echoes the daily reading, suggesting that the index is far from being oversold and could easily see further downside. The MACD on this timeframe also shows negative momentum. The Bollinger Bands are trading below the middle band, a classic sign of bearish pressure. The Stochastic Oscillator, with %K at 11.73 and %D at 28.56, is deeply in oversold territory, which might hint at a potential short-term bounce. However, given the overwhelming bearish signals across other indicators and longer timeframes, such a bounce would likely be a temporary correction within a larger downtrend rather than the start of a sustained recovery.
Even the 1-hour timeframe, often a playground for short-term traders, shows signs of bearish control, despite a higher ADX of 38.15 suggesting a strong trend. The RSI at 35.56 is not yet oversold, and the MACD histogram is firmly in negative territory. The Stochastic Oscillator, while showing %K at 19.01 and %D at 15.01, is in the oversold region, but this often occurs during strong downtrends where oversold conditions can persist. The key takeaway from the technicals is the overwhelming bearish consensus across multiple timeframes, especially the daily chart. The critical support level to watch on the daily chart is $23,770.36. A break below this level would likely accelerate the downtrend, targeting further downside.
The Bull Case: Can Resilience Emerge?
Despite the prevailing bearish technicals and macroeconomic headwinds, the argument for a potential bullish turn, however tentative, cannot be entirely dismissed. The Nasdaq100's closing price of $23,992.13 still holds above the crucial daily support at $23,770.36. This level has historically acted as a significant floor, and a failure to break it decisively could lead to a consolidation phase or even a short-covering rally. One of the primary catalysts for such a reversal would be a shift in central bank policy expectations. Should upcoming economic data, such as inflation figures or employment reports, surprise to the downside, it could reignite hopes for earlier interest rate cuts. This would reduce the attractiveness of higher bond yields, potentially driving capital back into growth assets like technology stocks.
Furthermore, the persistent strength of the US Dollar Index (DXY), currently at 99.39, while a headwind, can also present opportunities. If the narrative shifts towards a global economic slowdown, the dollar's safe-haven status might be challenged, or its strength could be seen as a precursor to a global easing cycle. Additionally, the sheer resilience shown by some sectors within the Nasdaq, even amidst broader weakness, could signal underlying strength. For instance, certain AI-driven companies or those with strong balance sheets and innovative products might continue to attract investment regardless of the broader market sentiment. The ADX at 13.05 on the WTI crude oil chart, for example, indicates a weak trend, which could suggest that the inflationary pressures from energy markets might not be as persistent as feared, potentially easing the burden on central banks.
The 1-hour and 4-hour charts, while showing bearish momentum, also present oversold readings in Stochastic oscillators. A divergence between these short-term oversold conditions and the broader bearish trend could signal a potential for a short-term bounce. If price action manages to reclaim key intraday resistance levels, such as $24,120.99 on the 1-hour chart, it could attract momentum traders. The RSI(14) on the 1-hour chart is at 35.56, which, while not bullish, offers more room for upward movement compared to the daily RSI of 32.5. A sustained move above the 50-period moving average on the hourly chart could be an initial sign of strength, though confirmation would be needed from higher timeframes and fundamental catalysts.
The Bear Case: Reinforcing the Downtrend
The bearish argument for the Nasdaq100, currently trading around $23,992.13, is robust and supported by a confluence of technical and fundamental factors. The daily chart indicators present a clear picture: an ADX of 36.06 signaling a strong downtrend, an RSI(14) at 32.5 indicating ample room for further decline, and a negative MACD histogram confirming bearish momentum. The price is trading below the middle Bollinger Band on the daily timeframe, and the Stochastic Oscillator's %K at 28.13 and %D at 45.03 suggest further downside potential. The critical support level at $23,770.36 is the immediate hurdle, and a decisive break below it would likely trigger a cascade of selling, targeting the next significant support at $23,675.46 on the 1-hour chart and potentially lower.
From a fundamental standpoint, the macroeconomic environment continues to favor a cautious, if not bearish, outlook. Inflation remains a persistent concern, as evidenced by the continued strength in oil prices (Brent at $112.79, WTI at $98.50), which hover near multi-year highs. This persistent inflationary pressure necessitates a firm stance from central banks, likely meaning higher-for-longer interest rates. The DXY's rise to 99.39 further solidifies this view, as a strong dollar typically correlates with tighter global financial conditions and reduced liquidity for risk assets. The recent breaking news highlights this: Gold tumbled below $4,500, and equity indices like the S&P 500 and Dow Jones saw significant drops, all pointing towards a market that is repricing for a higher-rate environment and increased geopolitical risk. The Nasdaq100, with its heavy weighting towards growth stocks whose valuations are sensitive to discount rates, is particularly vulnerable in such a climate.
The lack of a clear dovish pivot from the Federal Reserve is a major concern. While markets might have initially hoped for earlier rate cuts, recent commentary and data suggest a more protracted period of elevated rates. This outlook impacts corporate earnings expectations, as higher borrowing costs can crimip growth and profitability. Furthermore, geopolitical tensions, particularly in the Gulf, add another layer of uncertainty, potentially disrupting supply chains and exacerbating inflationary pressures. This risk-off sentiment favors assets that offer safety, not growth. The fact that the S&P 500 broke below its 6,570 level and the 200-day moving average last week, as reported, is a significant technical breakdown that often precedes further declines in correlated indices like the Nasdaq100. The immediate bearish target on the Nasdaq100, should support at $23,770.36 fail, would be the $23,675.46 level, with the next significant psychological barrier being $23,000.
The Verdict: Bearish Trend Likely to Continue
After weighing the arguments, the evidence strongly favors the continuation of the bearish trend for the Nasdaq100. The technical picture, particularly on the daily chart, is overwhelmingly bearish. The ADX at 36.06, RSI at 32.5, and negative MACD momentum all point towards further downside. The closing price of $23,992.13 sits precariously close to the critical support level of $23,770.36. A break below this level seems more probable than not, given the prevailing macroeconomic conditions and risk sentiment.
The fundamental backdrop does little to inspire confidence in a near-term recovery. Persistent inflation, hawkish central bank rhetoric, and rising Treasury yields create a challenging environment for growth stocks. The strengthening DXY, currently at 99.39, adds further pressure. While there's always a possibility of a short-covering rally or a technical bounce from oversold conditions on shorter timeframes, the underlying forces suggest these will be short-lived unless significant fundamental catalysts emerge, such as a surprise dovish shift from the Fed or a de-escalation of geopolitical tensions. The market's reaction to rising oil prices and tumbling gold prices indicates a clear risk-off sentiment, which is detrimental to indices like the Nasdaq100.
The key levels to watch remain $23,770.36 for support and $24,120.99 for resistance on the 1-hour chart, with the daily support at $23,770.36 being the most critical. A decisive break below $23,770.36 could open the door to $23,675.46 and potentially much lower targets, perhaps even testing the psychological $23,000 level. Conversely, for the bulls to regain control, they would need to defend $23,770.36 convincingly and push price back above the $24,120.99 resistance, ideally with increasing volume and improving macroeconomic data. Until then, caution is advised, and risk management should be paramount for any market participant.
Bearish Scenario: Trend Continuation
70% ProbabilityNeutral Scenario: Consolidation Near Support
20% ProbabilityBullish Scenario: Unexpected Reversal
10% ProbabilityFrequently Asked Questions: Nasdaq100 Analysis
What happens if Nasdaq100 breaks below the $23,770.36 support level?
A break below $23,770.36 on the daily chart would likely confirm the bearish trend, invalidating any short-term hopes for a recovery. This could trigger accelerated selling, targeting the $23,675.46 level and potentially the significant psychological barrier at $23,000. The ADX at 36.06 on the daily timeframe supports such a move.
Should I buy Nasdaq100 at current levels near $23,992.13 given the RSI at 32.5?
Buying at current levels near $23,992.13 is not advisable given the RSI at 32.5 on the daily chart, which still has room to fall. While shorter timeframes show oversold Stochastic readings, the overall trend remains bearish. A high-probability setup would require a confirmed break of resistance or a clear bullish divergence on longer timeframes, which is not present now.
Is the MACD histogram's negative momentum at -401.52 a sell signal for the Nasdaq100 today?
Yes, the negative MACD histogram reading of -401.52 on the daily chart is a strong sell signal, confirming bearish momentum. This indicates that the selling pressure is dominant and the market is likely to continue trending downwards unless significant buying pressure emerges to shift the MACD above its signal line.
How will the strengthening DXY at 99.39 affect Nasdaq100's outlook next week?
The strengthening DXY at 99.39 typically exerts downward pressure on growth-oriented assets like the Nasdaq100, especially those with significant international revenue. A stronger dollar can lead to tighter global financial conditions and reduced liquidity, making it harder for tech stocks to sustain rallies. This correlation suggests continued headwinds for the Nasdaq100 unless the DXY reverses course.
Track markets in real-time
AI-powered analysis, technical indicators and real-time price data.
Join Our Telegram Channel
Breaking market news, AI analysis and trading signals instantly.
Join Channel