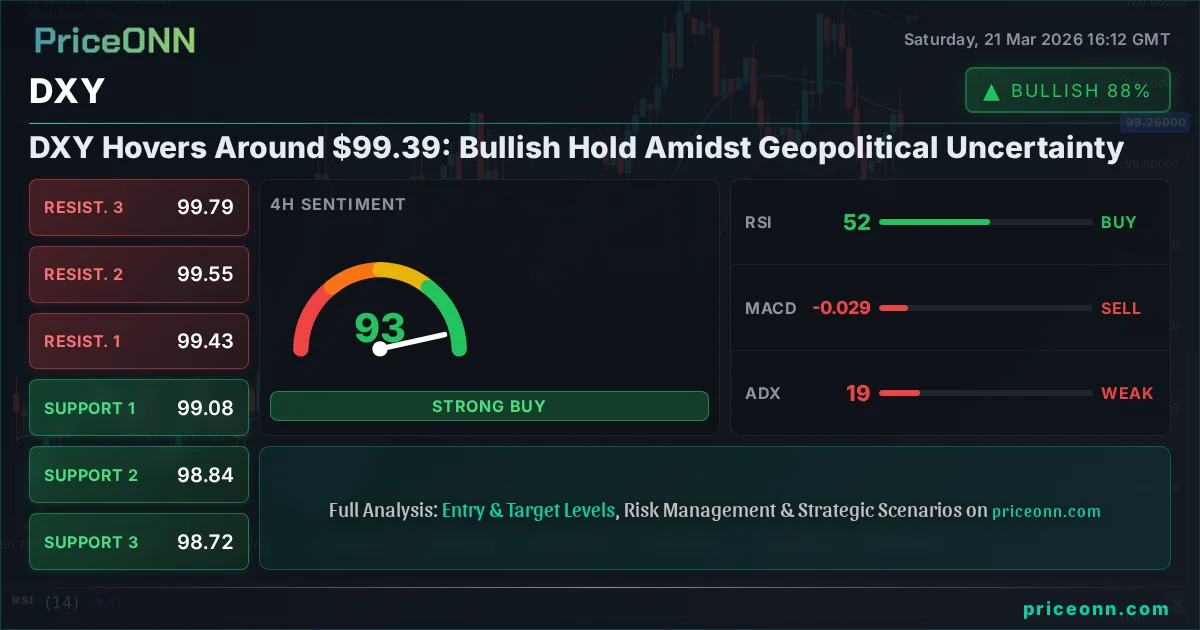
DXY Hovers Around $99.39: Bullish Hold Amidst Geopolitical Uncertainty
The Dollar Index (DXY) holds near $99.39 as markets digest geopolitical tensions and Fed policy signals. Analysis of key levels and scenarios.
The US Dollar Index (DXY) finds itself navigating a critical juncture, currently holding its ground around the $99.39 mark. This price point represents more than just a number; it's a battleground where geopolitical tensions, evolving central bank expectations, and shifting market sentiment collide. Last week saw significant volatility, with the DXY retreating below the psychologically important 100.00 level before staging a modest recovery, underscoring the delicate balance of forces at play. As traders and investors scrutinize every tick, the question on everyone's mind is whether the dollar's safe-haven status will be tested further or if current levels offer a stable foundation for a renewed advance. This analysis dives deep into the technical and fundamental drivers shaping the DXY's outlook, exploring various scenarios and the critical levels to watch in the week ahead.
- The Dollar Index (DXY) is currently testing pivotal support near $99.39, a level that has seen significant price action over the past week.
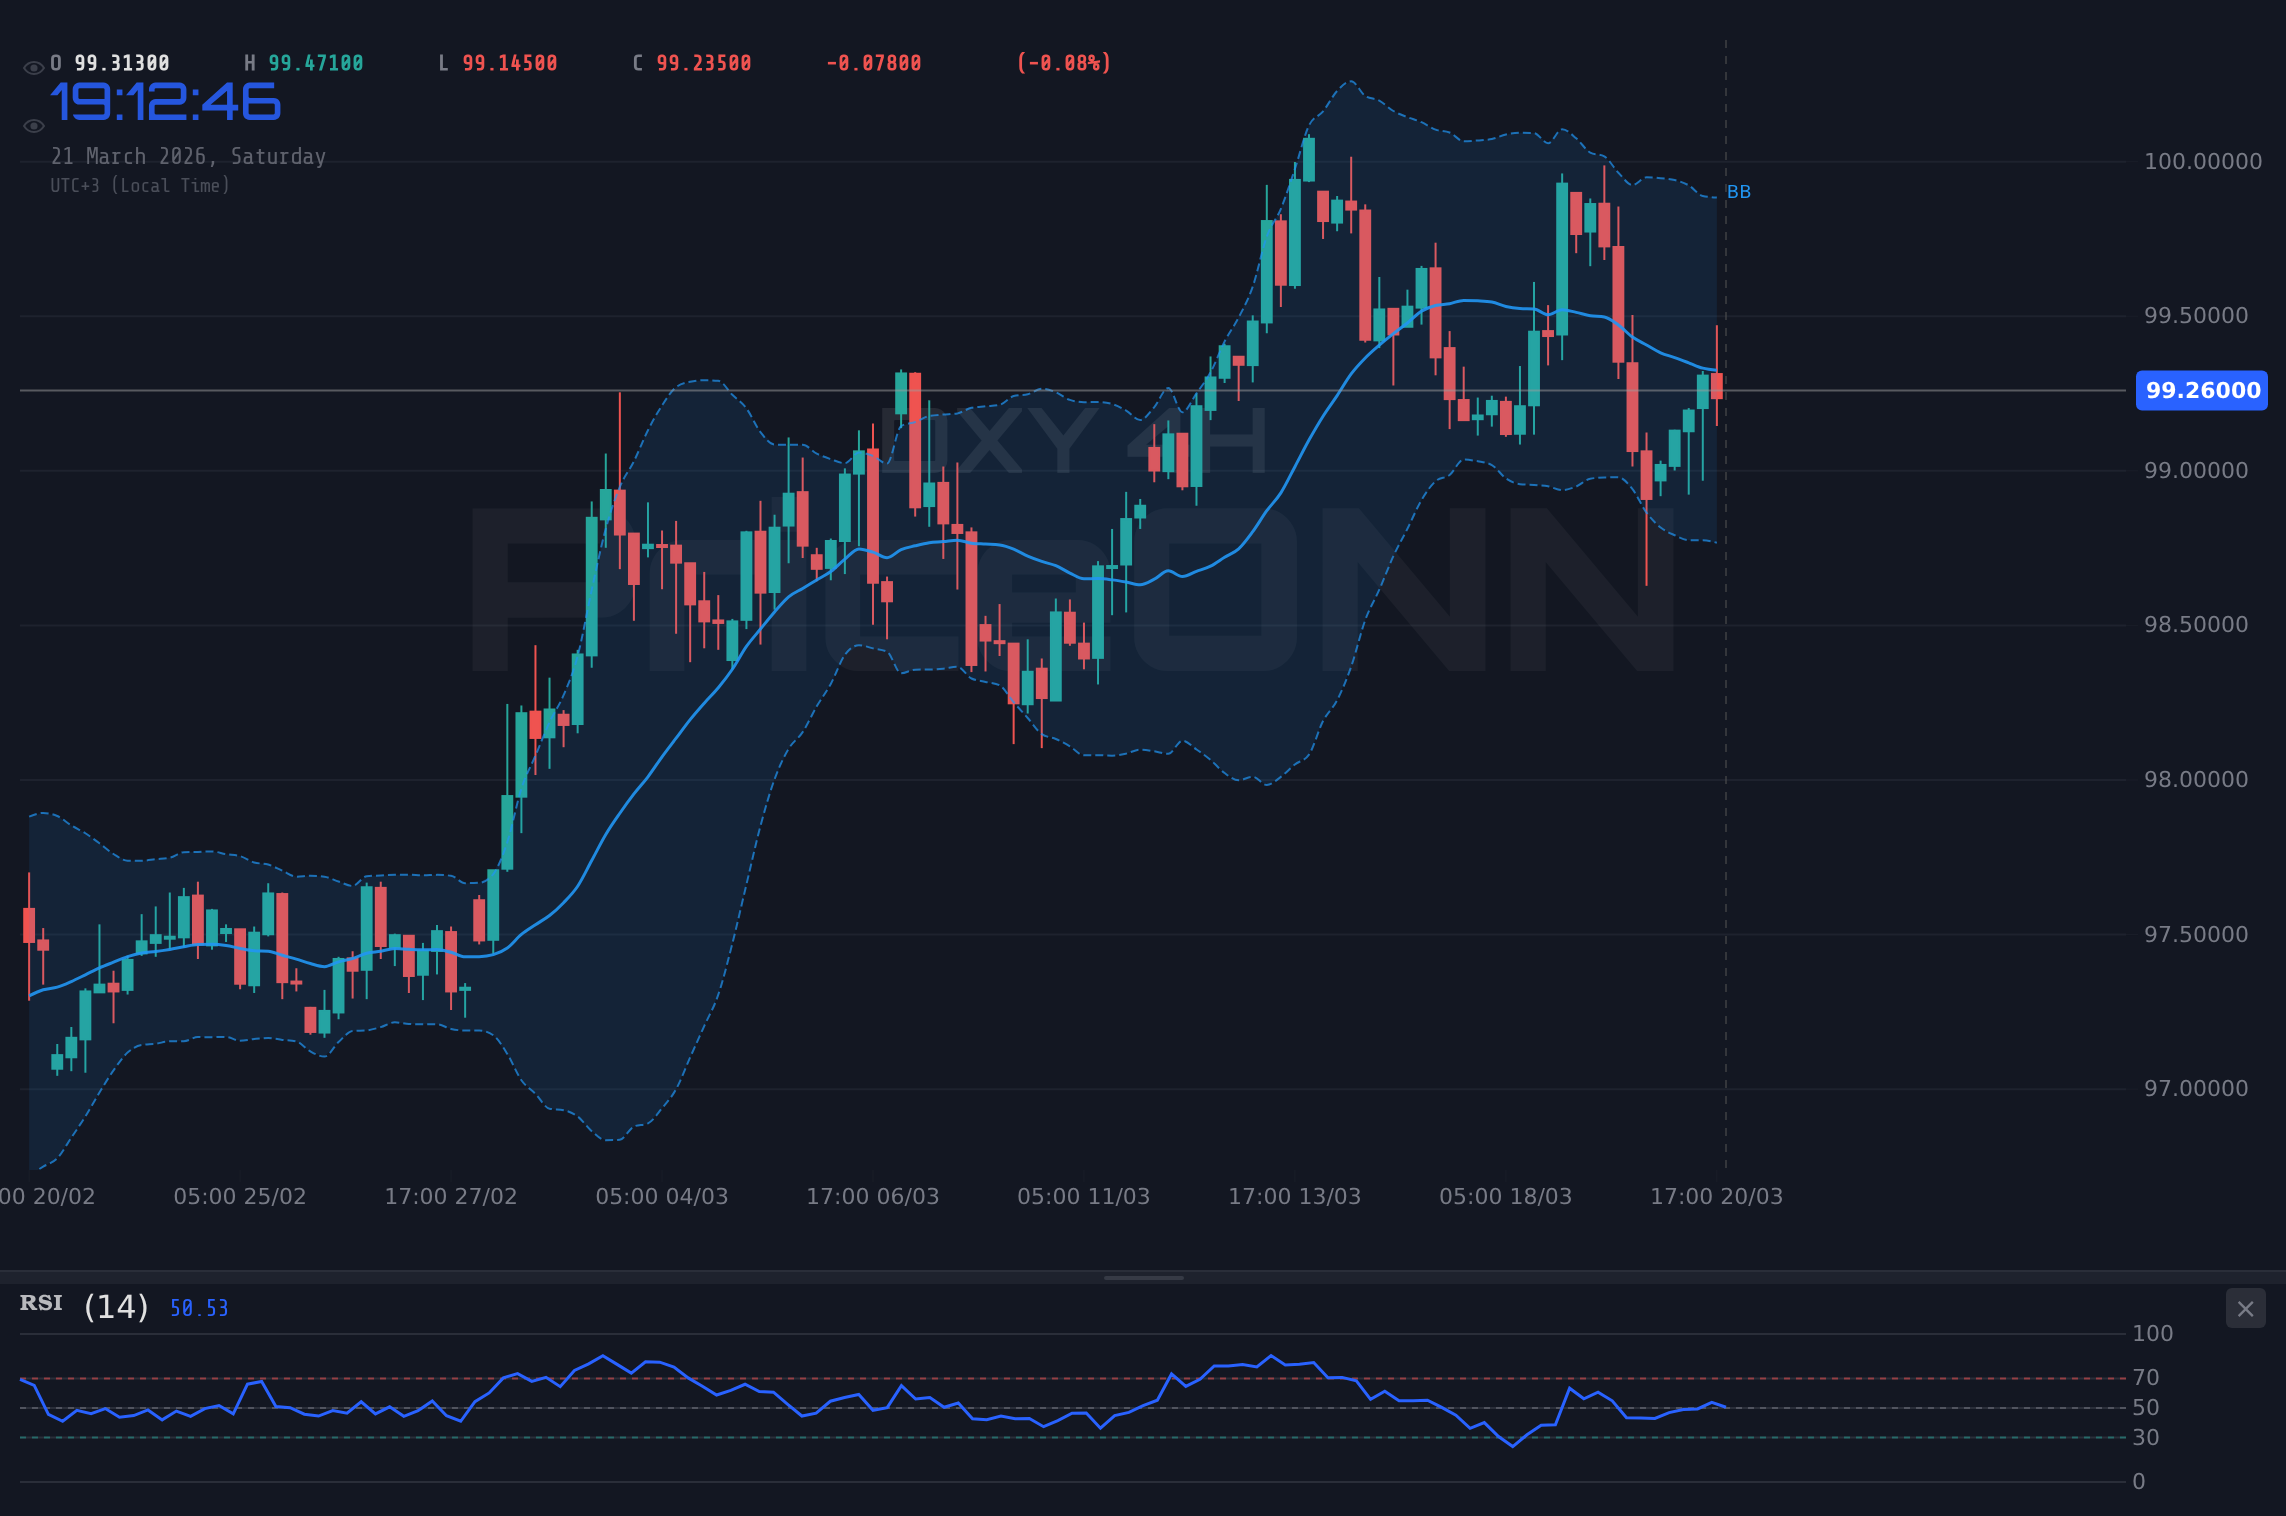
- On the 1H chart, RSI at 56.78 suggests a neutral stance with a slight upward bias, while the 4H RSI at 51.52 indicates a similar indecisive market. The daily RSI at 58.15 points to a cautiously bullish undertone.
- The ADX indicator shows varying trend strengths across timeframes: a moderate 22.64 on the 1H, weak 19.43 on the 4H, and a stronger 34.64 on the daily chart, suggesting a developing trend that needs confirmation.
- Key resistance lies at $99.43, $99.55, and $99.79 on the 4H chart, while support is found at $99.08, $98.84, and $98.72, defining the immediate trading range.
- Geopolitical escalations and divergent central bank stances are key macro drivers influencing the DXY's safe-haven appeal.
The Dollar Index's Tightrope Walk: A Tale of Two Forces
The DXY's recent price action paints a picture of a market grappling with conflicting narratives. On one hand, escalating geopolitical risks typically bolster the dollar's appeal as a safe-haven asset. Investors often flock to perceived stability during times of global uncertainty, driving demand for USD-denominated assets. However, this conventional wisdom is being challenged by a complex interplay of factors. The Federal Reserve's current monetary policy stance, while holding rates steady, has been interpreted with nuance. Market participants are constantly dissecting statements from Fed officials, seeking clues about the future path of interest rates. Any hint of a more dovish or hawkish tilt can significantly impact the dollar's trajectory, often overriding traditional safe-haven flows. Furthermore, the economic performance of other major economies and their respective central banks' policies play a crucial role. If other economies show signs of resilience or if their central banks adopt more aggressive tightening measures, it can diminish the relative attractiveness of the US dollar, even amidst global turmoil. This complex dynamic is precisely why the DXY has struggled to maintain a firm direction, oscillating around the $99.39 level.
The technical indicators provide a mixed but leaning-positive signal for the dollar. On the 1-hour timeframe, the Relative Strength Index (RSI) sits at 56.78, indicating a neutral-to-slightly-bullish momentum. This suggests that while the buying pressure isn't overwhelming, sellers are also not in firm control. The MACD (Moving Average Convergence Divergence) is showing positive momentum, with the MACD line above its signal line, reinforcing the idea of a potential upward bias. The Average Directional Index (ADX) at 22.64 suggests a developing trend, which, combined with the RSI, points towards a possible continuation of the current upward move. However, looking at the 4-hour chart, the picture becomes more subdued. The RSI at 51.52 is almost perfectly neutral, reflecting a market in equilibrium. The ADX here is a weaker 19.43, indicating a lack of strong directional conviction. This suggests that while the short-term momentum might favor buyers, the medium-term trend is still consolidating. This divergence in signals across different timeframes highlights the indecisiveness in the market and the importance of observing how these indicators evolve.
The daily chart, however, offers a slightly more encouraging perspective for dollar bulls. The RSI at 58.15 is comfortably in the neutral zone, moving towards the upper half, which often precedes a sustained bullish move. The MACD on the daily timeframe is also showing positive momentum, reinforcing the potential for upside. The ADX at 34.64 indicates a strengthening trend, suggesting that the sideways consolidation might be giving way to a more defined direction. This confluence of daily indicators, leaning towards bullishness, provides a foundation for the argument that the current consolidation around $99.39 might be a prelude to a move higher. The key will be whether this daily trend strength can overcome the indecision seen on the shorter timeframes and translate into decisive price action above the immediate resistance levels.
The Bull's Roadmap: Navigating Towards Higher Ground
For the bulls to regain firm control and push the DXY higher, several conditions need to be met. The immediate hurdle is the resistance zone identified on the 4-hour chart, specifically around $99.43, $99.55, and $99.79. A decisive break and hold above $99.79 would be a significant technical signal, suggesting a potential continuation of the upward trend observed on the daily chart. This would likely be accompanied by an increase in trading volume, confirming conviction from market participants. Historically, such breakouts often lead to accelerated price discovery, with the next logical target being the psychological level of 100.00, which has acted as both a pivot and a psychological barrier in recent times. A sustained move above 100.00 would then open the door for further upside, potentially targeting the $100.54 and $100.79 resistance levels identified on the daily timeframe. The underlying fundamental catalysts for such a move would likely involve a combination of escalating geopolitical risks that drive safe-haven demand, coupled with a clear signal from the Federal Reserve indicating a more hawkish stance than currently priced in by the market. For instance, stronger-than-expected inflation data or robust employment figures could solidify expectations of higher-for-longer interest rates, providing a strong tailwind for the dollar.
From a technical perspective, the confluence of indicators supports this bullish scenario, provided the key resistance levels are breached. On the 1-hour chart, the RSI moving above 60 and the MACD maintaining its positive momentum would be crucial confirmation. The Stochastic Oscillator, currently showing a potential pullback on the 1-hour chart, would need to find support and turn upwards, ideally avoiding a bearish crossover. The ADX at 22.64 on the 1H and 34.64 on the 1D suggests that if a breakout occurs, the trend could gain significant traction. For scalpers and short-term traders, a confirmed break above $99.43, targeting $99.79 and then $100.00, offers a clear intraday setup. Swing traders would look for a daily close above $99.79, with targets extending to $100.54 and potentially $100.79 over the coming days or week. Long-term investors might see a sustained move above 100.00 as a signal for a more significant dollar rally, eyeing levels closer to $101.08 and beyond, especially if macroeconomic data continues to support a stronger dollar narrative or if global risk aversion intensifies significantly.
The correlation analysis also plays a vital role here. A strengthening DXY typically exerts downward pressure on commodities like gold and silver, as seen in their significant price drops on the 1H and 4H charts (XAUUSD down 3.28%, XAGUSD down 6.67%). If the DXY continues its ascent, these precious metals may face further headwinds. Conversely, a robust dollar can also weigh on US equities, though the current market narrative is complex, with tech stocks facing their own sector-specific headwinds. The correlation with bond yields is also key; higher yields tend to support the dollar, making dollar-denominated assets more attractive. If Treasury yields were to surge on the back of renewed inflation fears or hawkish Fed commentary, this would provide a significant boost to the DXY, potentially accelerating its move towards higher resistance levels. The interplay between these assets - equities, bonds, commodities, and the dollar - provides a comprehensive backdrop against which the DXY's potential bullish scenario must be evaluated.
Where Bears Take Control: The Case for Dollar Weakness
Conversely, a bearish outlook for the DXY would be triggered if the price fails to hold the current support levels and succumbs to selling pressure. The immediate downside objective for bears lies at the 4-hour support levels: $99.08, $98.84, and ultimately $98.72. A decisive break below $98.72, particularly on increased volume, would signal a significant shift in market sentiment and technical structure. This level represents a key area of consolidation observed on the 4-hour chart, and a failure to hold it could precipitate a sharper decline. The next significant support to watch would be the daily support at $98.36, followed by $97.82. A break below these levels would invalidate the current bullish undertones and suggest a potential move towards the lower end of the daily range, possibly testing the $97.00 psychological mark. The fundamental drivers for such a bearish scenario would likely stem from a perceived dovish pivot by the Federal Reserve, or conversely, more aggressive policy tightening from other major central banks like the ECB or Bank of Japan, narrowing the interest rate differential.
Geopolitical developments could also paradoxically weaken the dollar. If de-escalation occurs in key regions, reducing the perceived need for safe-haven assets, demand for the dollar could wane. Furthermore, if global economic growth shows unexpected resilience, particularly in Europe or Asia, investors might rotate out of the dollar and into higher-yielding or growth-oriented assets in those regions. Technically, a bearish reversal would be confirmed by several signals. On the 1-hour chart, a break below the RSI 50 level, coupled with a bearish MACD crossover and the Stochastic Oscillator completing a bearish turn from overbought territory (though currently in neutral/oversold zones), would signal waning buying pressure. The ADX on the 1-hour chart would need to fall below 20, indicating a weakening trend, and then potentially reverse upwards in a downward direction. For swing traders, a daily close below $98.72 would be a strong bearish signal, targeting $98.36 and $97.82. Scalpers would focus on intraday breaks below $99.08 and $98.84. Long-term investors might view a sustained move below $98.00 as a significant bearish development, potentially signaling a deeper correction.
The correlation with other markets is crucial here. If risk assets like the SP500 and Nasdaq begin to recover strongly while the DXY falls, it would reinforce the bearish dollar narrative. This would imply that investors are becoming more risk-on, favoring equities over safe-haven currencies. The correlation with oil prices is also noteworthy; while high oil prices can sometimes fuel inflation fears and support the dollar, a significant drop in oil prices could signal weakening global demand, which could weigh on the dollar indirectly. The relationship with bond yields is also dynamic; if yields were to fall significantly due to expectations of Fed rate cuts or a flight to safety into Treasuries, this would also put downward pressure on the DXY. The bearish scenario hinges on these intermarket dynamics shifting decisively against the dollar.
The Waiting Game: Consolidation Around $99.39
Between the clear bullish aspirations and the bearish threats lies the possibility of continued consolidation. This neutral scenario, where the DXY remains range-bound, is often driven by a balance of opposing forces and a lack of decisive catalysts. The current technical indicators, particularly on the 1-hour and 4-hour charts, lean towards this outcome. The RSI hovering around the 50-60 level and the ADX readings showing moderate to weak trend strength are hallmarks of consolidation. In this environment, price action tends to oscillate between defined support and resistance levels, creating choppy trading conditions.
The key levels to watch in a consolidation scenario are the immediate support at $99.08 and resistance at $99.43 on the 4-hour chart. A range between these two points, or perhaps a slightly wider one defined by the daily support at $98.36 and resistance at $99.79, could persist until a significant economic event or geopolitical development forces a breakout. During such periods, scalpers might find opportunities by trading the range boundaries, while swing traders and long-term investors might adopt a more patient approach, waiting for clearer signals. The lack of strong directional momentum means that trend-following strategies would be less effective, and range-trading or mean-reversion strategies might be more appropriate. The fundamental backdrop supporting this neutral scenario would involve mixed economic data, balanced commentary from central bank officials, and a geopolitical landscape that remains tense but not escalating dramatically.
The market sentiment would likely be characterized by caution and indecision. Investors might be hesitant to commit to strong positions ahead of key economic data releases, such as upcoming inflation reports or employment figures, or ahead of significant central bank meetings. This uncertainty allows both buyers and sellers to exert influence, keeping the price within a defined range. The correlation analysis during consolidation often shows less clear directional relationships. For instance, equities might trade sideways, bond yields might fluctuate without a strong trend, and commodity prices could exhibit volatility driven by supply-side factors rather than broad risk appetite. The dollar's strength would be more dependent on the relative performance of other major currencies and their specific economic or political circumstances rather than a universal flight to safety.
Bearish Scenario: Dollar Under Pressure
35% ProbabilityNeutral Scenario: Range-Bound Action
40% ProbabilityBullish Scenario: Dollar Strength Resumes
25% ProbabilityWhat I'm Watching This Week: Key Catalysts for the DXY
As we look ahead, the DXY's path will likely be dictated by a confluence of macroeconomic data releases and evolving geopolitical narratives. The most critical factor remains the Federal Reserve's policy outlook. While the market currently anticipates a 'hawkish hold' - meaning rates will remain steady but with a tone suggesting future hikes are possible if inflation persists - any deviation from this expectation could be a major catalyst. Traders will be dissecting speeches from Fed officials for subtle shifts in language regarding inflation, employment, and the appropriate path for monetary policy. Upcoming inflation data, such as CPI or PCE, will be paramount. If inflation proves stickier than expected, it could strengthen the case for higher-for-longer rates, boosting the dollar. Conversely, signs of cooling inflation might fuel speculation of earlier rate cuts, pressuring the DXY.
Geopolitical developments will continue to cast a shadow, acting as a potential wildcard. Any significant escalation or de-escalation in ongoing global conflicts could trigger sharp moves in safe-haven assets, including the dollar. The market's reaction to these events often depends on the perceived impact on global economic stability and risk appetite. For instance, a major escalation could see the DXY test higher resistance levels, while signs of diplomatic progress might lead to a risk-on sentiment, potentially weakening the dollar. The correlation with other major currencies also warrants close attention. The Euro's performance against the dollar (EURUSD) is particularly important; if EURUSD breaks below key support levels like $1.15067, it would likely coincide with DXY strength. Similarly, the trajectory of USDJPY, currently showing bullish signals on shorter timeframes, could provide further clues about dollar sentiment. Observing the interplay between these currency pairs and the DXY will be essential for a comprehensive market view.
Technically, the $99.08 support and $99.79 resistance levels on the 4-hour chart represent the immediate battleground. A confirmed break above $99.79, especially on increased volume and with supportive daily indicators, would signal a potential bullish continuation towards $100.00 and $100.54. Conversely, a decisive break below $98.72 would invalidate the bullish bias and open the door for further downside towards $98.36 and $97.82. The ADX indicator's behavior will be key: a rising ADX above 25 would confirm a strengthening trend, regardless of direction, while a falling ADX below 20 would indicate a period of consolidation or a potential trend reversal.
Frequently Asked Questions: DXY Analysis
What happens if the DXY breaks below the $98.72 support level this week?
A sustained break below $98.72 on the DXY would invalidate the current bullish undertones and signal a potential shift towards weakness. This could lead to a test of the $98.36 support, and potentially further down towards $97.82, especially if accompanied by dovish shifts in Fed expectations or a significant de-escalation in geopolitical tensions.
Should I consider long positions on the DXY at current levels around $99.39?
Current levels around $99.39 present a mixed technical picture. While daily indicators show some bullish bias, shorter timeframes exhibit consolidation. A confirmed break and hold above the 4H resistance at $99.79, ideally on increasing volume, would offer a higher-probability long entry trigger targeting $100.00. Until then, caution is advised.
Is the RSI at 58.15 on the daily chart a strong buy signal for the DXY?
An RSI of 58.15 on the daily chart is considered neutral-to-bullish, indicating upward momentum but not yet extreme overbought conditions. It suggests the current trend has room to run but is not an isolated buy signal. Confirmation from price action breaking key resistance levels and other indicators like MACD showing sustained positive momentum would be needed for a stronger conviction.
How will upcoming inflation data impact the DXY's movement this week?
Upcoming inflation data is a critical catalyst for the DXY. If inflation figures come in hotter than expected (actual > forecast), it could reinforce expectations of a hawkish Fed stance, potentially pushing the DXY above $99.79 towards $100.00. Conversely, cooler-than-expected inflation could fuel rate cut speculation, leading to dollar weakness and a potential test of support levels below $99.00.
| Indicator | Value | Signal | Interpretation |
|---|---|---|---|
| RSI (14) | 58.15 | Neutral | Moving towards upper half, suggesting underlying bullish momentum. |
| MACD Histogram | Positive | Bullish | Momentum is building, supporting potential upside. |
| Stochastic | K=65.73, D=75.68 | Bearish Crossover | A bearish crossover is noted, cautioning against immediate upside. |
| ADX | 34.64 | Strong Trend | Indicates a firm trend is in place, favoring directional trades. |
| Bollinger Bands | Mid Band Breakout | Bullish Bias | Price is trading above the middle band, suggesting an upward bias. |
Volatility creates opportunity - those prepared will be rewarded. Markets are cyclical; every downturn plants seeds for the next rally. With disciplined risk management, these choppy waters can be navigated safely. The DXY's current stance around $99.39 offers a clear technical roadmap. While geopolitical risks and mixed Fed signals create uncertainty, the underlying trend strength on the daily chart provides a foundation for potential upside. Patience will be key as the market digests incoming data and events. Traders who remain vigilant, respect the key levels, and manage their risk prudently will be best positioned to capitalize on the inevitable shifts in market direction.
Track markets in real-time
AI-powered analysis, technical indicators and real-time price data.
Join Our Telegram Channel
Breaking market news, AI analysis and trading signals instantly.
Join Channel