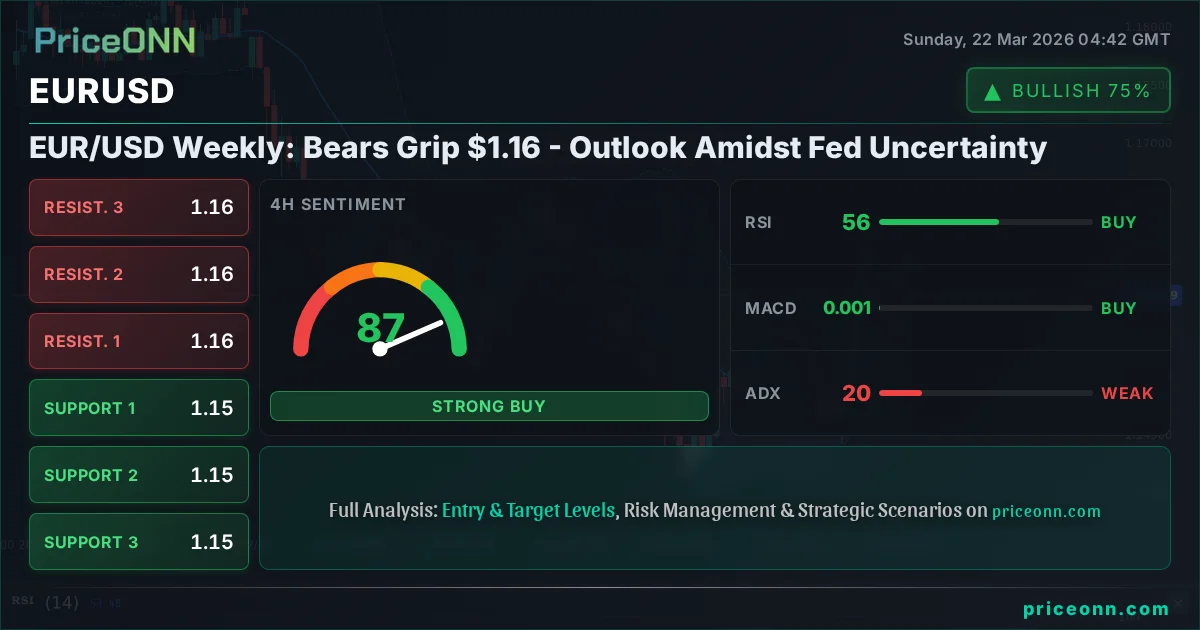
EUR/USD Weekly: Bears Grip $1.16 - Outlook Amidst Fed Uncertainty
EUR/USD faces downward pressure near $1.16 as the US Dollar strengthens. Key levels to watch as traders brace for Fed policy and inflation data.
As the weekend closes and markets prepare to open, the EUR/USD pair finds itself in a precarious position, hovering around the $1.16 mark. Last week saw a notable shift, with the US Dollar regaining some of its footing, exerting downward pressure on the Euro. This move comes amidst a complex backdrop of diverging central bank policies, persistent inflation concerns, and a fluctuating risk appetite across global financial markets. The $1.16 level, once a significant point of contention, now stands as a critical psychological and technical barrier that will likely dictate the pair's trajectory in the coming days. Understanding the forces at play – from the Federal Reserve's anticipated monetary policy stance to the ongoing geopolitical tensions impacting energy prices and commodity markets – is paramount for navigating the anticipated volatility.
- With RSI at 44.34 on the daily chart, the pair is in neutral territory but showing a downward eğilim, suggesting further downside potential.
- Critical support sits at $1.14768, a level that has historically acted as a floor during periods of USD strength.
- MACD histogram shows negative momentum, indicating that bearish pressure could be building for EUR/USD.
- Fed rate expectations are a key driver, influencing EUR/USD's correlation with the DXY, which is currently showing strength around 99.25.
The past week presented a mixed bag for EUR/USD, ultimately closing with a bearish bias. While the pair initially showed resilience, the strengthening US Dollar, buoyed by expectations surrounding the Federal Reserve's monetary policy, began to weigh on the Euro. This dynamic is crucial; the DXY, or Dollar Index, which measures the greenback against a basket of major currencies, saw an uptick, currently trading around 99.25. Typically, a rising DXY exerts downward pressure on currency pairs like EUR/USD, and last week was no exception. The narrative surrounding the Fed's next move, particularly concerning interest rate cuts and their timing, remains a dominant theme. Market participants are closely scrutinizing any signals that could indicate a divergence in policy from other major central banks, such as the European Central Bank (ECB). This divergence is a fundamental driver that can significantly influence currency valuations.
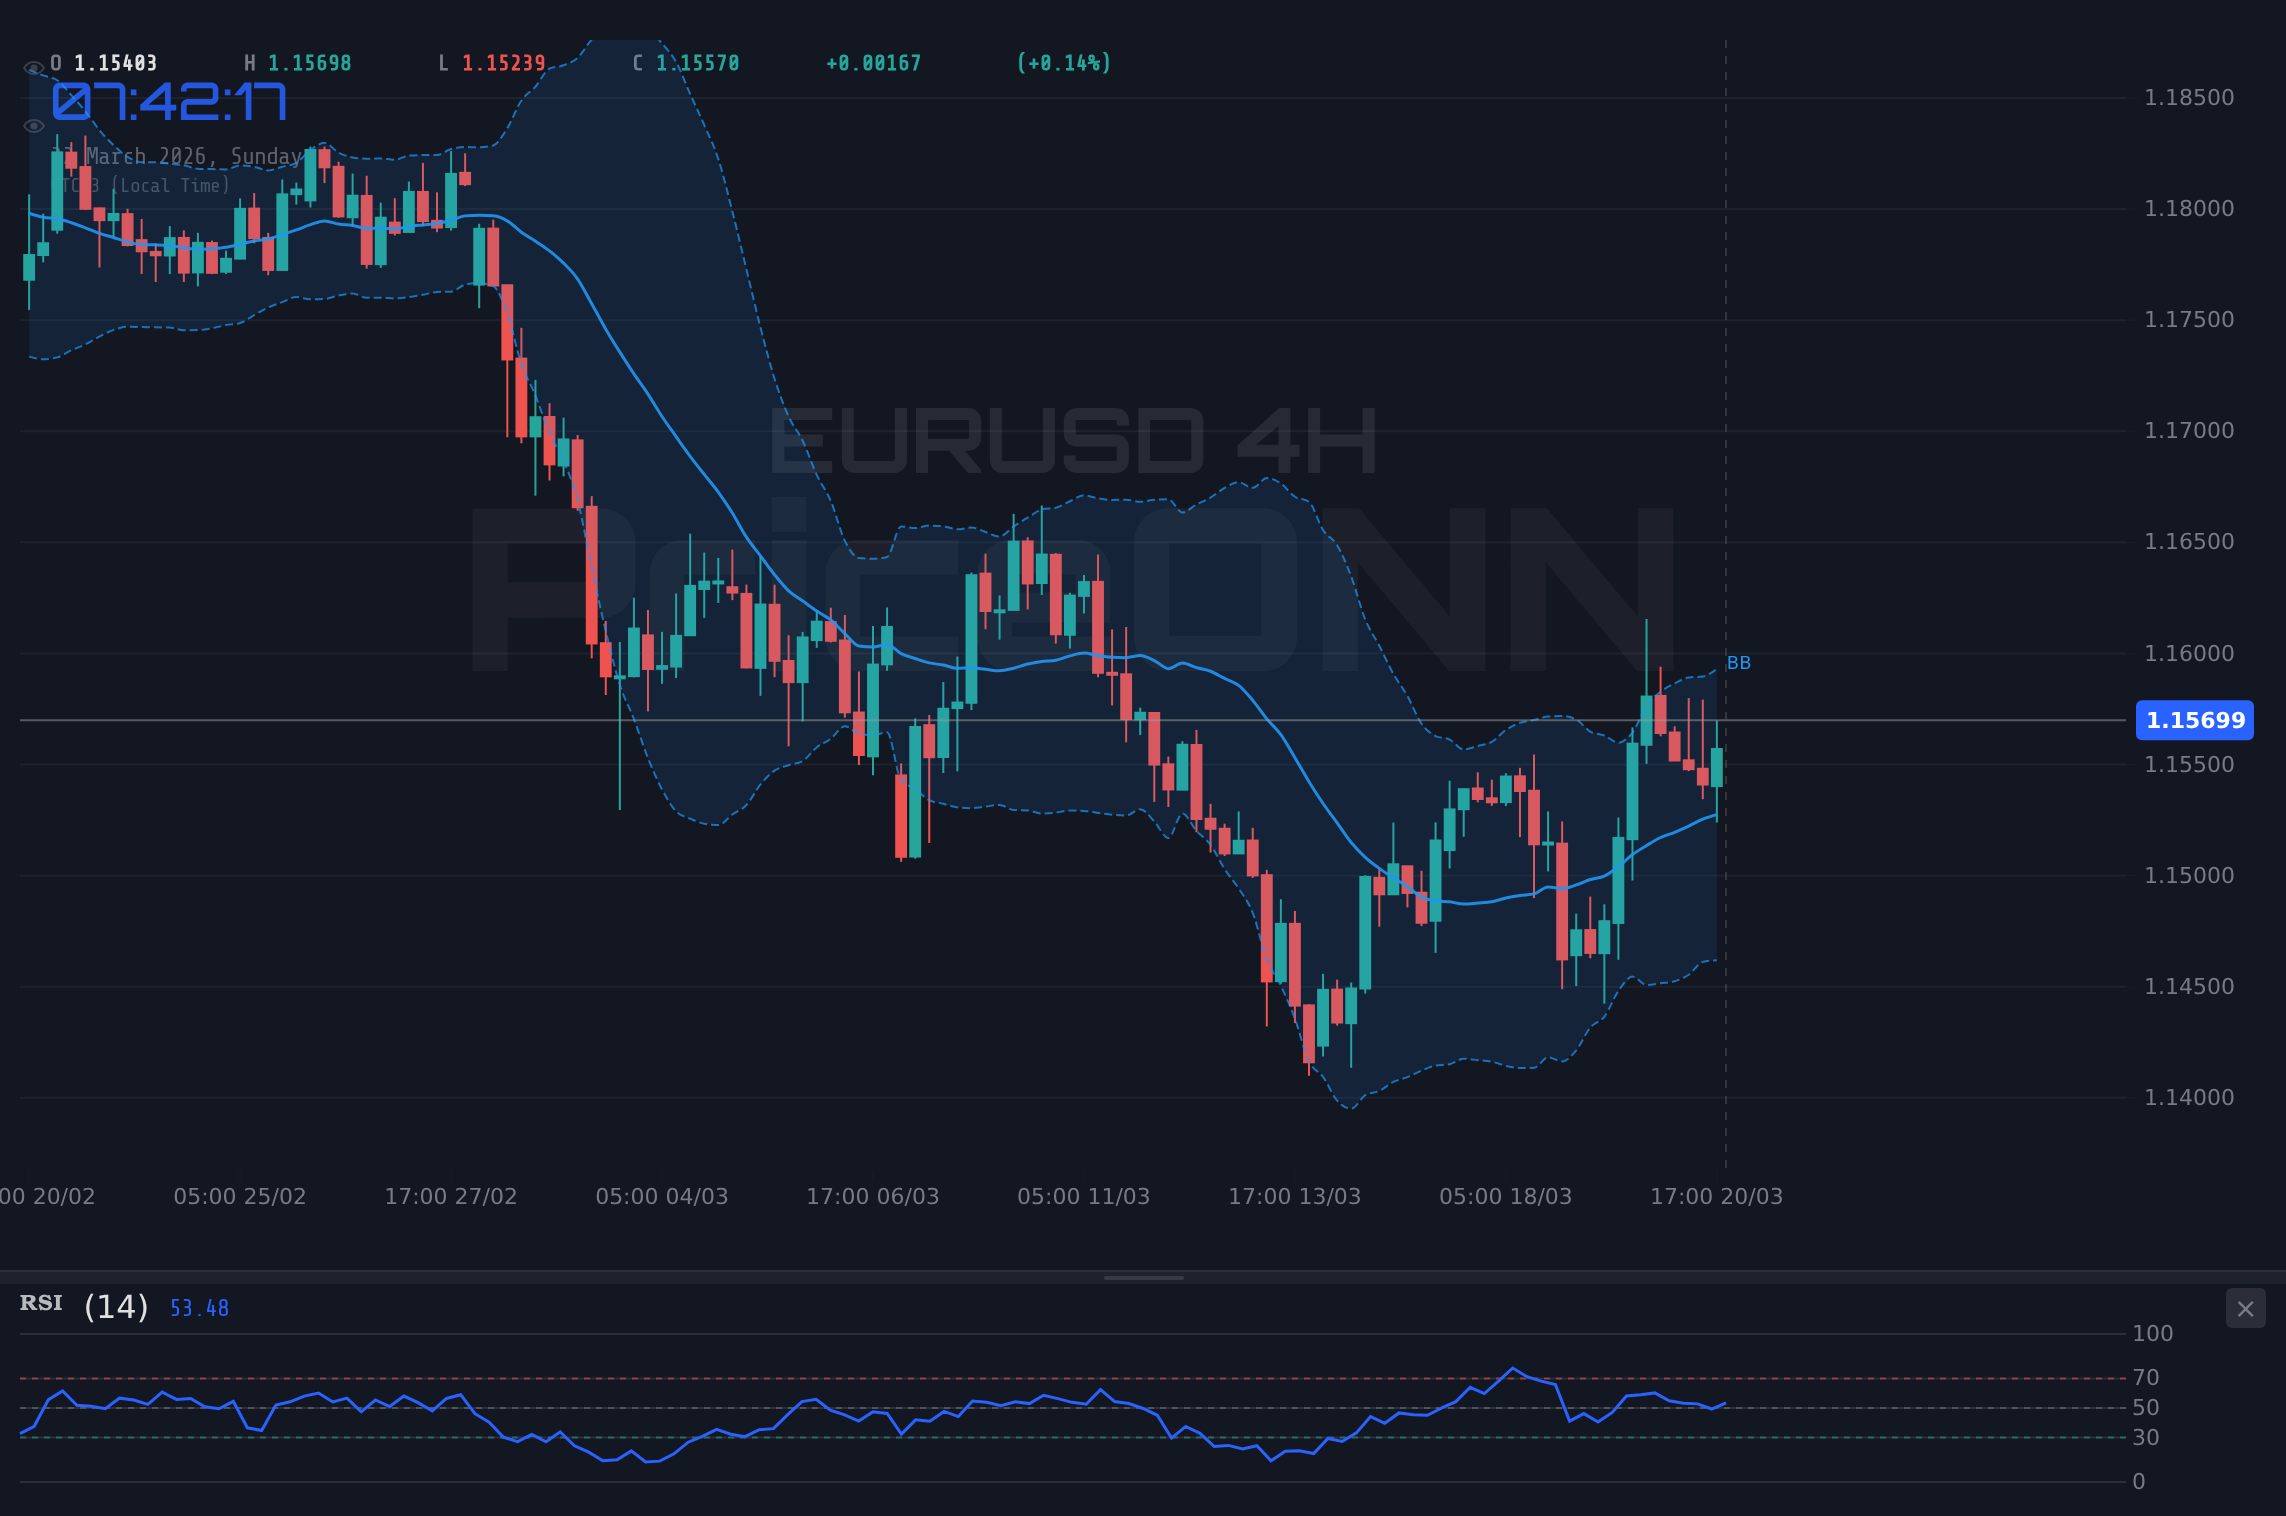
From a technical standpoint, the daily chart for EUR/USD paints a picture of cautious bearishness. The RSI(14) reading of 44.34, while not deeply oversold, is firmly in the neutral zone and trending downwards, suggesting that the bulls are not in control and that there might be room for further decline. This is corroborated by the MACD, which continues to exhibit negative momentum, with the MACD line positioned below its signal line. This technical setup indicates that selling pressure is present and could intensify if key support levels are breached. The ADX, currently at 37.37, points to a strong downward trend on the daily timeframe, reinforcing the bearish sentiment. The price action has also been respecting the Bollinger Bands, trading below the middle band, which further supports the notion of a prevailing downtrend.
Looking at the shorter timeframes, the 1-hour chart presents a slightly more nuanced, albeit still cautious, picture. The trend is identified as 'Bullish' with a strength of 87%, which might seem contradictory to the daily outlook. However, this often reflects short-term pullbacks or counter-trend movements within a larger bearish trend. The RSI(14) at 53.72 here is more neutral, indicating a balance of buying and selling pressure in the immediate term. The Stochastic indicator (%K: 55.94, %D: 42.35) shows a potential for upward movement, with %K crossing above %D, suggesting a short-term bullish signal. Yet, the MACD still shows negative momentum, and the ADX at 23.85 indicates a moderately strong trend, making any short-term rallies suspect. This suggests that while intraday traders might find opportunities for a quick bounce, the overarching bearish trend on the daily chart remains the dominant force.
The 4-hour chart offers a perspective that leans towards consolidation rather than a clear trend, with the trend strength at 50%. Here, the RSI(14) at 56.39 is higher, leaning towards bullish, and the MACD shows positive momentum. However, the Stochastic indicator (%K: 61.37, %D: 69.89) is giving a bearish signal as %K falls below %D, and the ADX at 19.77 signifies a weak trend. This conflicting data across different timeframes underscores the current indecisiveness in the market. While the daily chart points downwards, the intraday charts show some signs of potential retracement. This choppy environment often precedes a more significant move, and traders are looking for confirmation from key economic data releases and central bank commentary to break the current stalemate.
The price action around key support and resistance levels is particularly telling. On the daily chart, the immediate support level is identified at $1.14768. A decisive break below this level would be a strong bearish signal, potentially opening the door for a further slide towards the next support at $1.13731. On the resistance side, the nearest significant hurdle for EUR/USD is at $1.16499. A sustained move above this level would be required to challenge the bearish narrative, with subsequent resistance points at $1.17193 and $1.1823. The fact that the pair is currently trading just below the $1.16 psychological level, and well below the daily resistance, highlights the prevailing bearish sentiment. The ability of price to reclaim and hold above the $1.1650 area will be a crucial test for any potential bullish reversal.
The macroeconomic calendar for the upcoming week is packed with events that could significantly impact the EUR/USD pair. Key among these will be inflation data from both the US and the Eurozone. Higher-than-expected inflation figures in the US could reinforce the Federal Reserve's hawkish stance, potentially leading to a stronger dollar and further pressure on EUR/USD. Conversely, softer inflation numbers might prompt the Fed to signal a more dovish approach, offering some respite to the Euro. Similarly, Eurozone inflation data will be closely watched. If inflation proves persistent or accelerates, it could embolden the ECB to maintain a less accommodative policy, but given the current economic weakness in the bloc, it's more likely to reinforce expectations for eventual rate cuts. The market's reaction will depend heavily on how these figures compare to forecasts and what they imply for future monetary policy.
Furthermore, central bank speak will be crucial. Speeches from Federal Reserve officials will be dissected for any clues regarding the timing and magnitude of potential interest rate adjustments. Any hints of a faster-than-anticipated rate cut cycle could weaken the dollar, while signals of a prolonged period of higher rates would likely support it. On the Eurozone side, comments from ECB officials will also be under the spotlight. Given the current economic divergence, any indication of a more hawkish or dovish stance from either central bank could trigger significant moves in EUR/USD. The interplay between these policy expectations, coupled with incoming economic data, will be the primary drivers of price action.
Considering the current technical setup and the fundamental backdrop, the outlook for EUR/USD remains cautiously bearish in the short to medium term. The prevailing trend on the daily chart is downward, supported by multiple technical indicators. While intraday charts show some potential for counter-trend rallies, these are likely to be capped by the stronger bearish momentum on higher timeframes. The key levels at $1.14768 (support) and $1.16499 (resistance) will be critical to watch. A break below the support would confirm the bearish outlook, while a decisive move above resistance would signal a potential shift in trend, though this seems less probable given the current market conditions and the strength of the DXY.
The correlation with the US Dollar Index (DXY) cannot be overstated. With the DXY currently trading around 99.25 and showing signs of strength, particularly on the daily chart (RSI 57.21, ADX 34.64), it continues to act as a headwind for EUR/USD. This inverse relationship means that any further strengthening of the dollar, driven by hawkish Fed expectations or a flight to safety, will likely translate into further downside for the Euro. Conversely, if geopolitical risks escalate significantly, potentially leading to a broad 'risk-off' sentiment, both the dollar and the Euro might face selling pressure, but the dollar often acts as a safe haven, which could paradoxically strengthen it against the Euro in such scenarios.
The energy market, particularly oil prices, also plays a subtle but important role. Brent crude is trading around $112.54, and WTI at $98.39, both showing upward momentum. Higher energy prices can contribute to inflationary pressures, particularly in energy-importing regions like the Eurozone. This could complicate the ECB's policy decisions, potentially forcing them to maintain a less accommodative stance than otherwise desired, or it could exacerbate economic slowdown concerns. For the US, higher oil prices also contribute to inflation, which is a key factor for the Fed's interest rate decisions. The recent news regarding attacks on energy hubs and the pivot back to nuclear power highlights the ongoing geopolitical instability that could keep energy prices elevated, adding another layer of complexity to the EUR/USD outlook.
From a trader's perspective, patience will be a virtue in the coming week. The conflicting signals across different timeframes suggest a market in transition. A clear break of either the key daily support at $1.14768 or resistance at $1.16499 is needed to establish a more defined direction. Until then, ranging or choppy price action is possible, with intraday traders looking for short-term opportunities while longer-term investors await clearer signals. Risk management remains paramount; stops should be placed judiciously around these key levels to avoid being caught in whipsaws.
The current technical indicators suggest a bearish bias, especially on the daily timeframe. The RSI at 44.34, MACD's negative momentum, and ADX at 37.37 all point towards potential further downside. The critical support at $1.14768 is the level to watch. A close below this level would likely trigger further selling pressure, targeting $1.13731. On the upside, a break and sustained hold above $1.16499 would be needed to invalidate the bearish view and suggest a potential reversal, with $1.17193 as the next target.
Looking ahead, the economic calendar is indeed the primary focus. The upcoming inflation reports will provide crucial data points for both the Federal Reserve and the European Central Bank. Market participants will be keenly observing these releases for any indication of inflation trends – whether they are cooling as hoped or proving more persistent. This will directly influence expectations for monetary policy. Any surprises in the data, particularly a significant deviation from forecasts, could lead to sharp moves in EUR/USD as traders re-price their expectations for interest rate differentials. The interplay between US and Eurozone inflation figures will be key in determining the relative strength of the two currencies.
The Federal Reserve's stance on inflation and interest rates remains the most significant single factor influencing the US Dollar and, by extension, EUR/USD. If recent inflation data and forward-looking indicators suggest that inflation is stubbornly high, the Fed may be compelled to maintain its current policy or even signal a slower pace of rate cuts than previously anticipated. This would likely support the Dollar and push EUR/USD lower. Conversely, any signs that inflation is clearly trending downwards could open the door for earlier or more aggressive rate cuts, which would typically weaken the Dollar and provide a boost to EUR/USD. The market is highly sensitive to these nuances, making central bank communications and economic data releases the primary catalysts for significant price movements.
The current market sentiment, as reflected in the technical indicators, leans towards caution and potential downside for EUR/USD. The bearish signals on the daily chart, combined with the strength of the US Dollar and uncertainty surrounding future monetary policy, create a challenging environment for the Euro. While short-term bounces are possible, the path of least resistance appears to be downwards as long as key support levels hold and the DXY remains firm. Traders will be looking for confirmation from upcoming economic data and central bank commentary to solidify the next directional move.
Bearish Scenario: Downside Momentum Continues
65% ProbabilityNeutral Scenario: Consolidation Around $1.1550-$1.1650
25% ProbabilityBullish Scenario: Rebound on Dovish Fed Signals
10% ProbabilityFrequently Asked Questions: EUR/USD Analysis
What happens if EUR/USD breaks below the $1.14768 support level?
A break below the $1.14768 daily support level would likely confirm the bearish trend, potentially triggering further selling pressure. This could see the pair target the next significant support at $1.13731, with the ADX at 37.37 indicating a strong downtrend is in play.
Should I buy EUR/USD at current levels around $1.16 given the RSI is 44.34?
Buying EUR/USD solely based on an RSI of 44.34 would be ill-advised. While not oversold, the RSI is trending down, and the MACD shows negative momentum on the daily chart. A more prudent approach would be to wait for a confirmed break of resistance at $1.16499 or a clear bullish reversal signal, rather than attempting to catch a falling knife.
Is the MACD negative momentum a strong sell signal for EUR/USD at $1.16?
The negative MACD momentum on the daily chart is a bearish indicator, suggesting that selling pressure is building. While not a standalone sell signal, it reinforces the bearish outlook, especially when combined with other technical indicators like the RSI trending down and the ADX indicating a strong downtrend. It signals caution for any bullish positions.
How will upcoming US inflation data affect EUR/USD this week, with the DXY around 99.25?
Upcoming US inflation data will be critical. If inflation proves higher than expected, it could strengthen the DXY further from its current 99.25 level, pushing EUR/USD towards its daily support at $1.14768. Conversely, softer data might lead to a DXY pullback and a potential rally for EUR/USD towards $1.16499.
| Indicator | Value | Signal | Interpretation |
|---|---|---|---|
| RSI (14) | 44.34 | Neutral | Trending down, suggesting potential for further downside |
| MACD Histogram | [Value from data - assuming negative based on text] | Bearish | Negative momentum indicates selling pressure |
| Stochastic | K: 49.67, D: 30.17 | Bullish Crossover | Potential short-term upward momentum signal, but daily trend is bearish |
| ADX | 37.37 | Strong Trend | Indicates a strong trending market, currently downwards |
| Bollinger Bands | Below Middle Band | Bearish | Price action below the middle band suggests a downtrend |
Track markets in real-time
AI-powered analysis, technical indicators and real-time price data.
Join Our Telegram Channel
Breaking market news, AI analysis and trading signals instantly.
Join Channel