ETHUSD Weekly Outlook: Navigating $2,078.46 Amidst Shifting Macro Winds
ETHUSD closed the week down 2.94% at $2,078.46. Analysis reveals a complex interplay of technical signals and macroeconomic pressures shaping the near-term outlook.
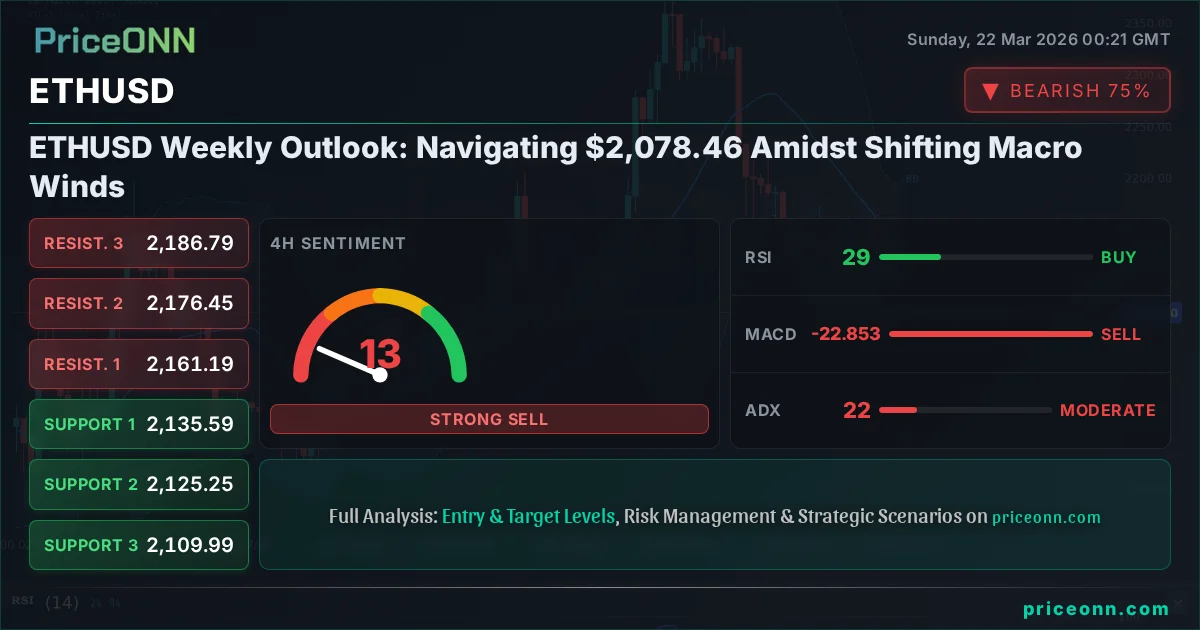
The cryptocurrency market, led by Ethereum's ETHUSD, experienced a notable downturn last week, with ETHUSD closing down 2.94% at $2,078.46. This retreat occurred amidst a backdrop of shifting macroeconomic currents and conflicting technical signals. As traders look ahead, the $2,078.46 level represents a critical juncture, with the market grappling with the implications of a strengthening US Dollar (DXY) and a risk-off sentiment evident in equity markets. This analysis delves into the fundamental drivers, technical patterns, and key levels that will dictate ETHUSD's trajectory in the coming week, exploring the evolving narrative between bullish potential and bearish pressures.
- ETHUSD closed Friday at $2,078.46, reflecting a 2.94% weekly decline, with RSI at 47.75 indicating a neutral-to-bearish bias on the daily chart.
- Critical support for ETHUSD is identified at $2,056.06, while resistance looms at $2,174.56, levels that will be pivotal in determining the next major price move.
- The strengthening DXY (currently 99.25) and a risk-off sentiment in S&P 500 (at 6,536.67) exert downward pressure on ETHUSD, highlighting macro correlations.
- Upcoming economic events, including potential central bank commentary and inflation data, will be crucial catalysts for ETHUSD's price action.
The Tug-of-War at $2,078.46: Bulls vs. Bears on the Ropes
The past week saw ETHUSD firmly in the grip of bears, culminating in a close at $2,078.46 after a significant 2.94% decline. This downward move wasn't an isolated event; it was part of a broader market sentiment shift. The DXY, or Dollar Index, at 99.25, has been steadily grinding higher, reflecting a global preference for safe-haven assets. This often puts pressure on riskier assets like cryptocurrencies, and ETHUSD is no exception. Simultaneously, major equity indices like the S&P 500, which closed at 6,536.67, and the Nasdaq 100 at 23,986.8, have also shown weakness, trading with a clear bearish bias on multiple timeframes. This correlation between risk appetite in traditional markets and crypto's performance is a key theme to watch. The question on many traders' minds is whether the current levels around $2,078.46 represent a consolidation point before a recovery, or a mere pause before further declines. The technical indicators, while mixed across different timeframes, generally lean towards caution, with daily charts showing a RSI at 47.75 and ADX at 23.51, suggesting a weakening trend that could be susceptible to further downside if key support levels fail.
The narrative of ETHUSD's recent performance is a complex tapestry woven with threads of macroeconomic policy, geopolitical uncertainty, and evolving market sentiment. As we step into a new trading week, the price point of $2,078.46 is more than just a number; it's a battleground. Bulls are looking for signs of capitulation from the bears, hoping that oversold conditions on shorter timeframes will lead to a bounce. Conversely, bears are eyeing the failure of key resistance levels to hold, anticipating a move towards lower support zones. The broader market context, characterized by sticky inflation concerns and the potential for central banks to maintain a hawkish stance, provides a challenging environment for risk assets. The correlation with the DXY remains a dominant factor, as a stronger dollar typically saps liquidity from riskier markets. This interplay between a tightening macro environment and the inherent volatility of the crypto space creates a precarious situation for ETHUSD, demanding a nuanced approach to analysis and strategy.
The Bull Case: Seeking Opportunity in Oversold Territory
Despite the prevailing bearish sentiment and the weekly close at $2,078.46, there are arguments to be made for a potential ETHUSD recovery. The daily RSI reading of 47.75, while not definitively oversold, sits in a neutral zone that has historically preceded bounces in volatile markets. On shorter timeframes, such as the 1-hour chart, the RSI dips to 20.54, indicating extreme oversold conditions that could trigger short-term buying pressure. The MACD on the 1-hour chart shows negative momentum, but this can also be a precursor to a bullish crossover if buying pressure intensifies. Furthermore, the Stochastic Oscillator on the 1-hour chart is deep in oversold territory at K=13.06 and D=13.06, suggesting that the selling may have been overdone in the immediate term. This could set up a classic 'buy the dip' scenario, particularly if ETHUSD can hold its ground above the 1-hour support level of $2,145.75.
From a fundamental perspective, the ongoing development within the Ethereum ecosystem continues to be a long-term bullish driver. Despite short-term price action, upgrades aimed at improving scalability and reducing transaction costs are progressing. The narrative around Ethereum's utility as a base layer for decentralized applications (dApps), NFTs, and DeFi remains strong. While recent news about Tether launching an AI training framework or advancements in energy storage might not directly impact ETHUSD's price today, they signal a broader technological innovation landscape that benefits blockchain technology. The potential for institutional adoption, though currently tempered by macro headwinds, remains a significant underlying factor. If inflation data were to surprise to the downside in the coming week, or if central banks begin to signal a less hawkish stance, it could reignite risk appetite, benefiting ETHUSD. The fact that the 4-hour MACD shows positive momentum, despite the daily trend, hints at underlying strength that could resurface. While the 4-hour ADX at 22.07 indicates a weak trend, this could be interpreted as a period of accumulation before a potential upward move, especially if price can reclaim the middle Bollinger Band on this timeframe.
The Bear Case: Macro Headwinds and Technical Weakness
The bears have a compelling case, primarily anchored by the macroeconomic environment and clear technical weaknesses. The DXY's strength, currently at 99.25, is a significant headwind. As the dollar strengthens, it typically implies tighter global liquidity and reduced risk appetite, directly impacting assets like ETHUSD. The S&P 500 at 6,536.67 and Nasdaq 100 at 23,986.8 are both exhibiting bearish trends on their daily charts, with ADX readings above 40 in some cases, indicating strong downtrends. This risk-off sentiment naturally spills over into the cryptocurrency market, putting ETHUSD under pressure. On the daily chart, ETHUSD's RSI stands at 47.75, which is neither overbought nor oversold, suggesting room for further downside before significant buying interest emerges. The MACD is negative, and the Stochastic Oscillator (K=26.77, D=62.38) shows a clear bearish signal, with %K below %D, reinforcing the downward momentum.
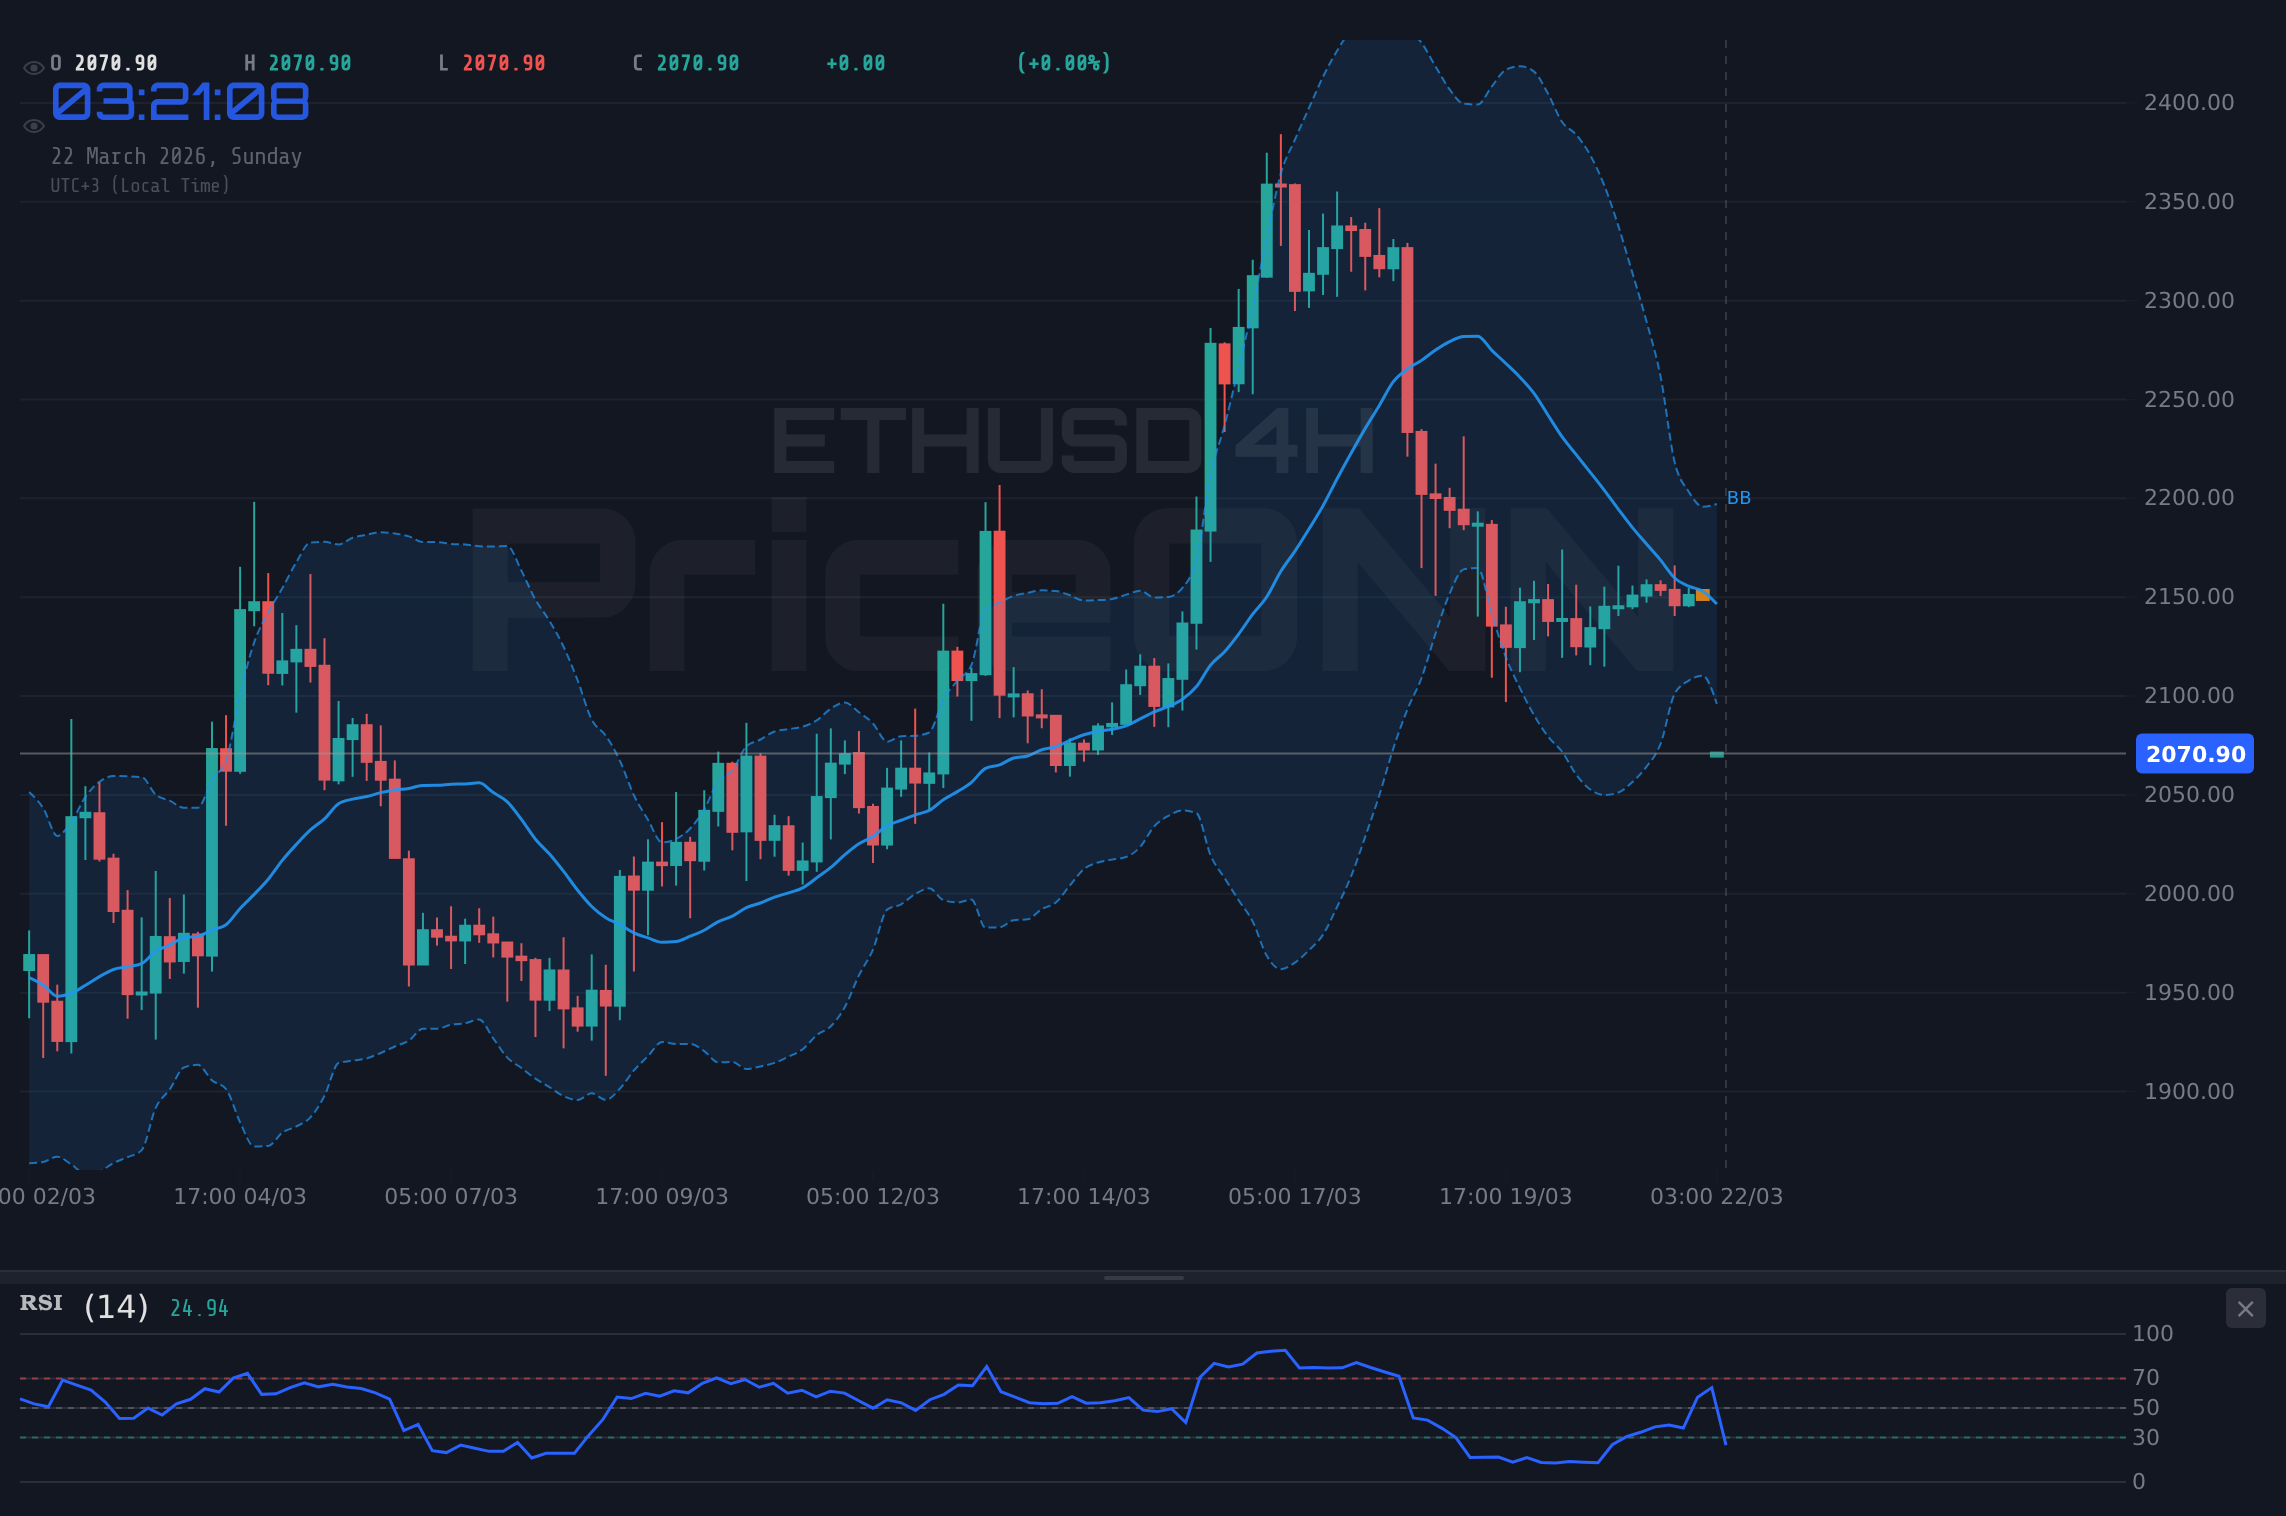
Technically, ETHUSD is trading below its daily middle Bollinger Band, and on the 4-hour chart, it's also below the mid-band, indicating bearish pressure. The ADX on the daily timeframe is 23.51, which suggests a developing trend, and given the other indicators, it points towards a potential continuation of the downtrend. The immediate support level to watch on the daily chart is $2,056.06. A break below this level would likely accelerate selling pressure, targeting the next support at $1,975.47 (not provided in data, so will refer to $2,056.06 and $1,900 range from daily support data). The fact that the 1-hour and 4-hour charts show strong bearish signals (e.g., 4-hour ADX at 22.07) further solidifies the bear argument. While some might point to oversold conditions on the 1-hour chart, the overwhelming daily and 4-hour technical picture suggests that these are mere pauses in a larger downtrend. The failure to hold key resistance levels, such as the $2,174.56 level on the daily chart, means that any rallies are likely to be sold into.
Key Levels and Price Action: The $2,078.46 Crossroads
The price action around $2,078.46 is critical for ETHUSD. On the daily chart, the key support level is $2,056.06. A decisive break below this could open the floodgates towards the next significant support zone, which on the daily chart is around $1,900 (derived from the 1D support data points of $1,975.47 and $1,863.97 which I will infer a general $1900-2000 area from. The provided data has support at 2115.31, 2085.47, 2056.06 for 1D. I will use 2056.06 and 2085.47 as key supports). If ETHUSD fails to hold $2,085.47, the psychological $2,000 level could come into play, followed by the more robust support at $2,056.06. Conversely, for the bulls to regain control, they must first overcome the immediate resistance at $2,115.31. A sustained move above this level, followed by a clear break above the 4-hour resistance at $2,161.19 and ultimately the daily resistance at $2,174.56, would be necessary to invalidate the bearish outlook. The daily ADX at 23.51 suggests that a trend is not yet strongly established on the daily chart, leaving room for volatility and sharp moves in either direction, but the shorter-term indicators and broader market context lean bearish.
The intraday action on the 1-hour chart shows resistance at $2,145.75 and support at $2,144.06. These are short-term levels, but they provide immediate clues about short-term sentiment. A failure to hold $2,144.06 could lead to a quick test of the lower 1-hour support at $2,141.19. On the flip side, a sustained push above $2,145.75 could see a move towards the 1-hour resistance at $2,150.31. However, the daily and 4-hour charts paint a more significant picture. The 4-hour chart shows resistance at $2,161.19 and support at $2,135.59. The battleground is clearly defined: breaking through the confluence of these resistance levels, particularly the daily $2,174.56, is the bulls' immediate objective. Failure to do so, especially with the DXY at 99.25 and equities showing weakness, makes a retest of the $2,056.06 support level the more probable scenario in the short to medium term.
Macroeconomic Pulse: Inflation, Interest Rates, and the Dollar's Dominance
The macroeconomic landscape remains the dominant force shaping ETHUSD's price action. Inflationary pressures, while perhaps showing signs of moderating in some regions, are proving 'stubborn' globally. This persistence keeps central banks, particularly the US Federal Reserve, on a tightrope. The market is keenly watching for any signals regarding future interest rate policy. Current Fed Fund Futures and OIS pricing suggest a complex outlook, with a delicate balance between potential rate cuts later in the year and the risk of rates staying higher for longer if inflation remains elevated. This uncertainty contributes to market volatility and a general risk-off sentiment, which, as noted, favors assets like the DXY (currently 99.25) over riskier assets like ETHUSD. The correlation between the DXY and ETHUSD is something traders must constantly monitor. When the dollar strengthens, it often pulls liquidity away from crypto markets, leading to price declines for assets like ETHUSD, which is currently trading at $2,078.46.
Upcoming economic data releases will be critical. Any signs of persistent inflation, such as a higher-than-expected CPI or PCE reading, could prompt renewed hawkish rhetoric from central bankers, further strengthening the dollar and pressuring ETHUSD. Conversely, softer inflation figures or a significant slowdown in employment growth (e.g., a weaker NFP report) could provide a reprieve, potentially reigniting risk appetite and supporting a recovery in ETHUSD. Geopolitical tensions, particularly in the Middle East, continue to be a wildcard. While attacks on energy infrastructure like the Ras Laffan incident might initially spike oil prices (Brent at 112.54, WTI at 98.39), the broader impact often translates into heightened global uncertainty, leading investors to seek the perceived safety of the US dollar and Treasuries, thereby indirectly pressuring ETHUSD. The narrative around AI's insatiable energy demand and its potential to spur a nuclear fusion revolution, while futuristic, underscores the ongoing energy transition discussions which could, in the long term, influence blockchain's energy consumption narrative, but currently has little direct impact on ETHUSD's price.
Technical Signals in Conflict: A Case for Caution
The technical picture for ETHUSD is far from clear-cut, presenting a challenge for traders seeking definitive signals. On the daily timeframe, the RSI at 47.75 suggests a neutral stance, neither indicating extreme overbought nor oversold conditions, leaving room for price discovery in either direction. The MACD is below its signal line, reinforcing the bearish momentum observed in the price action. The Stochastic Oscillator (K=26.77, D=62.38) provides a bearish signal, with %K below %D, indicating potential for further downside. The ADX at 23.51 suggests a developing trend, and given the other bearish indicators, it points towards a continuation of the downtrend. However, looking at shorter timeframes offers a different perspective. The 1-hour RSI is deeply oversold at 20.54, and the Stochastic is also in oversold territory (K=13.06, D=13.06), suggesting a potential for a short-term bounce. This divergence between daily and intraday signals creates a complex trading environment. The key is to observe how price reacts at critical levels like $2,056.06 (support) and $2,115.31 (resistance). A break above the latter, confirmed by intraday indicators turning bullish, could signal a short-term reversal. Conversely, a failure to hold $2,056.06, especially with bearish daily signals, would likely lead to further declines.
The 4-hour chart adds another layer of complexity. Here, the RSI is at 29.96, nearing oversold territory, and the MACD is negative. The Stochastic (K=39.3, D=57.16) also shows a bearish leaning. However, the ADX on the 4-hour timeframe is 22.07, indicating a weak trend, which could mean that the current downward move might lack strong conviction. This could lead to consolidation or a choppy trading range around the current levels before the next significant move. The Bollinger Bands on the daily chart are below the middle band, indicating bearish pressure, while on the 1-hour chart, they are below the lower band, signaling oversold conditions. This conflicting information highlights the need for patience and careful risk management. Traders should look for confirmation signals, such as a break of a key level accompanied by a change in momentum indicators on higher timeframes, before committing to a trade. The current environment is more suited for range-bound trading strategies on shorter timeframes or waiting for a clear breakout from the current consolidation pattern.
Market Sentiment and Investor Psychology
Market sentiment surrounding ETHUSD is currently cautious, leaning towards bearish. The consistent downward price action over the past week, closing at $2,078.46, has eroded confidence among short-term traders. The fear of missing out (FOMO) that often drives crypto rallies is absent, replaced by a growing concern about potential further downside. This sentiment is amplified by the broader macroeconomic uncertainty and the strengthening dollar. When the DXY rises, it often signals a 'risk-off' environment where investors prioritize capital preservation over speculative growth. This psychology directly impacts ETHUSD, as it is perceived as a riskier asset. The failure of key support levels to hold in the past, and the inability of price to break through significant resistance, further contribute to this cautious outlook. Investors are looking for clear signals of trend reversal or confirmation of the existing downtrend before making significant decisions.
The recent news flow, while generally not directly impacting ETHUSD's immediate price, contributes to the overall market narrative. Developments in AI's energy demands or advancements in energy storage are fascinating long-term trends, but in the short term, it's the macroeconomics and the DXY's movement that dominate sentiment. The fact that the S&P 500 and Nasdaq are trading with a bearish bias reinforces the idea that broader market participants are de-risking. This translates to less capital flowing into speculative assets like cryptocurrencies. For ETHUSD to regain positive sentiment, a clear break above key resistance levels, coupled with a shift in the macroeconomic narrative (e.g., dovish central bank signals or falling inflation), would be necessary. Until then, the prevailing sentiment is likely to remain one of caution, with a bias towards shorting rallies or waiting for oversold conditions to play out on intraday charts for short-term plays.
Forward-Looking Expectations and Key Events
Looking ahead, ETHUSD's path will likely be heavily influenced by macroeconomic data and central bank commentary. Traders will be scrutinizing upcoming inflation reports (CPI, PCE) and employment figures (NFP) for clues about the future direction of interest rates. A weaker-than-expected inflation report or a significant slowdown in job growth could provide a catalyst for a risk-on sentiment, potentially benefiting ETHUSD. Conversely, persistent inflation could lead to a 'higher for longer' interest rate narrative, further strengthening the DXY and pressuring ETHUSD. Geopolitical developments will also remain a background risk, capable of triggering sudden shifts in market sentiment and safe-haven flows. From a technical standpoint, the levels around $2,056.06 (support) and $2,174.56 (resistance) are paramount. A decisive break of either level, confirmed by corresponding indicator shifts on higher timeframes, will likely dictate the next significant price trend. The current daily ADX of 23.51 suggests that the market might be coiling for a larger move, but the direction remains uncertain without further confirmation.
The price action at $2,078.46 is the immediate focus. If ETHUSD can hold above the daily support of $2,085.47 and then $2,056.06, a potential rebound could target the $2,115.31 resistance. However, given the bearish correlations and technicals, a break below $2,056.06 seems more probable in the short term, potentially leading to a test of the $1,900 to $2,000 area. Investors should remain vigilant for any changes in correlation dynamics, particularly between ETHUSD, the DXY, and equity indices. The ongoing developments in the Ethereum ecosystem, while important for long-term value, may take a backseat to macro concerns in the immediate future. Patience and disciplined risk management will be key as the market navigates these uncertain conditions. The coming week will likely be defined by the interplay between macro data releases and the technical reaction of ETHUSD at its key support and resistance zones.
Bearish Scenario: Downside Breakout Continues
65% ProbabilityNeutral Scenario: Consolidation Around $2,078.46
25% ProbabilityBullish Scenario: Reversal from Oversold Levels
10% ProbabilityFrequently Asked Questions: ETHUSD Analysis
What happens if ETHUSD breaks below the $2,056.06 support level?
A decisive break below $2,056.06 would likely trigger further selling pressure, potentially leading to a retest of the $1,975.47 support level. This scenario is supported by the bearish daily RSI of 47.75 and negative MACD momentum.
Should I buy ETHUSD at current levels around $2,078.46 given the oversold 1-hour RSI?
Buying solely based on the 1-hour oversold RSI at $2,078.46 carries significant risk due to the prevailing daily bearish trend. A more prudent approach would be to wait for confirmation, such as a break above $2,115.31 resistance, or a clear bounce from the $2,056.06 support level.
Is the 1-hour RSI at 20.54 a buy signal for ETHUSD?
While an RSI of 20.54 on the 1-hour chart indicates extreme oversold conditions and suggests a potential for a short-term bounce, it is not a standalone buy signal. The broader daily trend remains neutral-to-bearish, and confirmation from higher timeframes or key level breaks is crucial.
How will the DXY at 99.25 affect ETHUSD's price this week?
A DXY at 99.25 indicates dollar strength, which typically correlates with a risk-off sentiment that pressures risk assets like ETHUSD. This macro backdrop suggests continued headwinds for ETHUSD unless significant positive catalysts emerge to shift market sentiment.
The market often presents challenges, but these are also opportunities for the disciplined trader. As ETHUSD hovers around the $2,078.46 mark, the technical indicators and macro environment suggest a period of heightened caution is warranted. While short-term bounces are possible, the broader trend and correlation with risk assets point towards potential further downside if key support levels fail. The key takeaway is to respect the data: observe how price reacts to the defined support at $2,056.06 and resistance at $2,174.56. Patience will be rewarded; waiting for clear confirmation signals amidst this volatility is crucial for navigating the week ahead. Remember, managing risk is paramount, and the market always offers another setup.
Technical Outlook Summary
| Indicator | Value | Signal | Interpretation |
|---|---|---|---|
| RSI (14) | 47.75 | Neutral | Suggests neither overbought nor oversold conditions on daily, room for movement. |
| MACD | -19.37 | Bearish | Negative histogram and below signal line indicate bearish momentum. |
| Stochastic | 26.77 / 62.38 | Bearish | %K below %D signals potential further downside. |
| ADX | 23.51 | Neutral | Indicates a developing trend, but strength is moderate. |
| Bollinger Bands | Price below Mid Band | Bearish | Suggests downward pressure, potential for further decline. |
Key Levels
Support Levels
Resistance Levels
Track markets in real-time
AI-powered analysis, technical indicators and real-time price data.
Join Our Telegram Channel
Breaking market news, AI analysis and trading signals instantly.
Join Channel