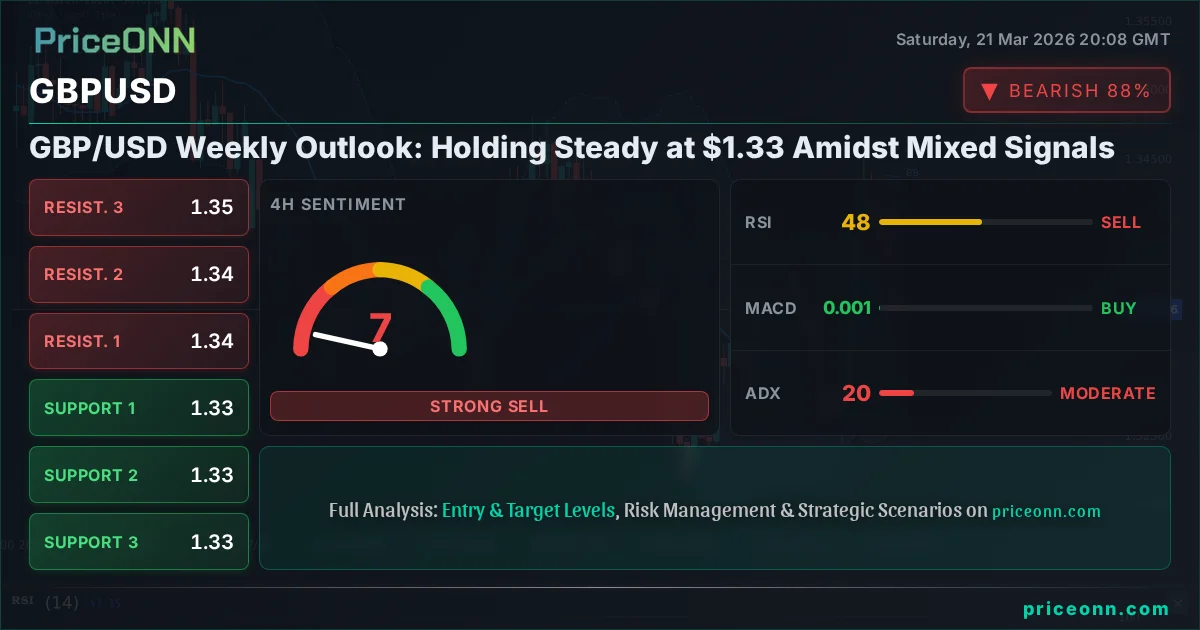
GBP/USD Weekly Outlook: Holding Steady at $1.33 Amidst Mixed Signals
GBP/USD analysis: The pair hovers around $1.33, with a bearish sentiment prevailing despite some technical indicators suggesting a potential pause. Key events to watch next week include...
Last Friday, the Pound Sterling found itself at a critical juncture, trading around the $1.33 level against the US Dollar. This past week has been a period of consolidation and mixed signals for GBP/USD, with significant economic events on the horizon that could dictate its next major move. While the immediate technical picture leans bearish, the broader macroeconomic landscape and upcoming central bank communications are creating a complex environment for traders. Understanding the interplay between the Bank of England's (BoE) policy stance, UK economic data, and the persistent strength of the US Dollar (DXY) is paramount for navigating this pair in the coming days. This analysis delves into the price action, key levels, and fundamental drivers that shaped the week and will likely influence GBP/USD as we move into the next trading period.
- GBP/USD is trading around $1.33, reflecting a cautious market sentiment.
- The 1-day RSI reading of 45.27 suggests a bearish bias, with room for further downside.
- Key support is identified at $1.32893, while resistance looms at $1.35105.
- Upcoming BoE and Fed decisions, along with UK employment data, are critical catalysts.
The narrative surrounding GBP/USD over the past week has been one of cautious observation rather than aggressive directional bets. Trading around the $1.33 mark, the pair has shown a tendency to retreat from higher levels, with the daily chart indicating a bearish lean. The RSI(14) on the daily timeframe stands at 45.27, firmly in neutral territory but trending downwards, suggesting that sellers have a slight edge. This sentiment is further echoed by the MACD, which remains below its signal line, painting a picture of negative momentum. However, the Stochastic Oscillator offers a glimmer of hope for the bulls, with %K at 47.45 and %D at 36.82, indicating a potential upward cross from oversold conditions. This divergence highlights the indecision in the market and the need for a clearer catalyst to drive price action.
Looking at the broader market context, the US Dollar Index (DXY) has been a significant factor. With DXY currently trading at 99.25 and showing a strong upward trend on the daily timeframe (92% strength), it exerts a natural headwind on GBP/USD. A stronger dollar typically makes it more expensive for holders of other currencies to buy USD-denominated assets, and vice-versa for GBP-denominated ones. The DXY's daily ADX reading of 34.64 further confirms a robust uptrend, suggesting that dollar strength is a dominant theme that GBP/USD must contend with. This inverse correlation is a fundamental driver that cannot be ignored when assessing the outlook for the Sterling-Dollar pair.
The Bank of England's (BoE) recent policy decisions and communications have also played a crucial role. While the market has been digesting the latest BoE announcements, the anticipation of future policy moves, particularly regarding interest rates, remains a key driver. Traders are constantly weighing the likelihood of BoE holding rates steady, cutting them, or even hiking them further, against the backdrop of inflation and economic growth data. This uncertainty contributes to the choppy price action seen around the $1.33 level. Any hints from BoE officials about their future intentions, especially concerning inflation targets and the labor market, will be closely scrutinized for their impact on Sterling's valuation.
The UK's economic health, as reflected in its key data releases, remains a central concern for GBP/USD. Last week saw a mixed bag of economic indicators, and the upcoming week promises more crucial data points. The unemployment rate, wage growth, and GDP figures are all vital for assessing the overall economic trajectory. For instance, a stronger-than-expected jobs report could bolster the Pound by suggesting a resilient economy, potentially giving the BoE more room to maintain a hawkish stance or delay rate cuts. Conversely, weak employment numbers could signal economic headwinds, increasing dovish expectations and pressuring GBP/USD lower.
The interplay between these fundamental factors creates a complex trading environment. On the one hand, the overarching strength of the US Dollar, driven by Fed policy expectations and global risk sentiment, acts as a persistent drag on GBP/USD. On the other hand, any positive economic surprises from the UK or a shift in BoE sentiment could provide temporary relief for the Sterling. This push and pull is reflected in the technical indicators, where conflicting signals, such as the bearish RSI versus the potentially oversold Stochastic, suggest that the market is searching for direction.
Navigating the Technical Landscape: Key Levels and Indicators
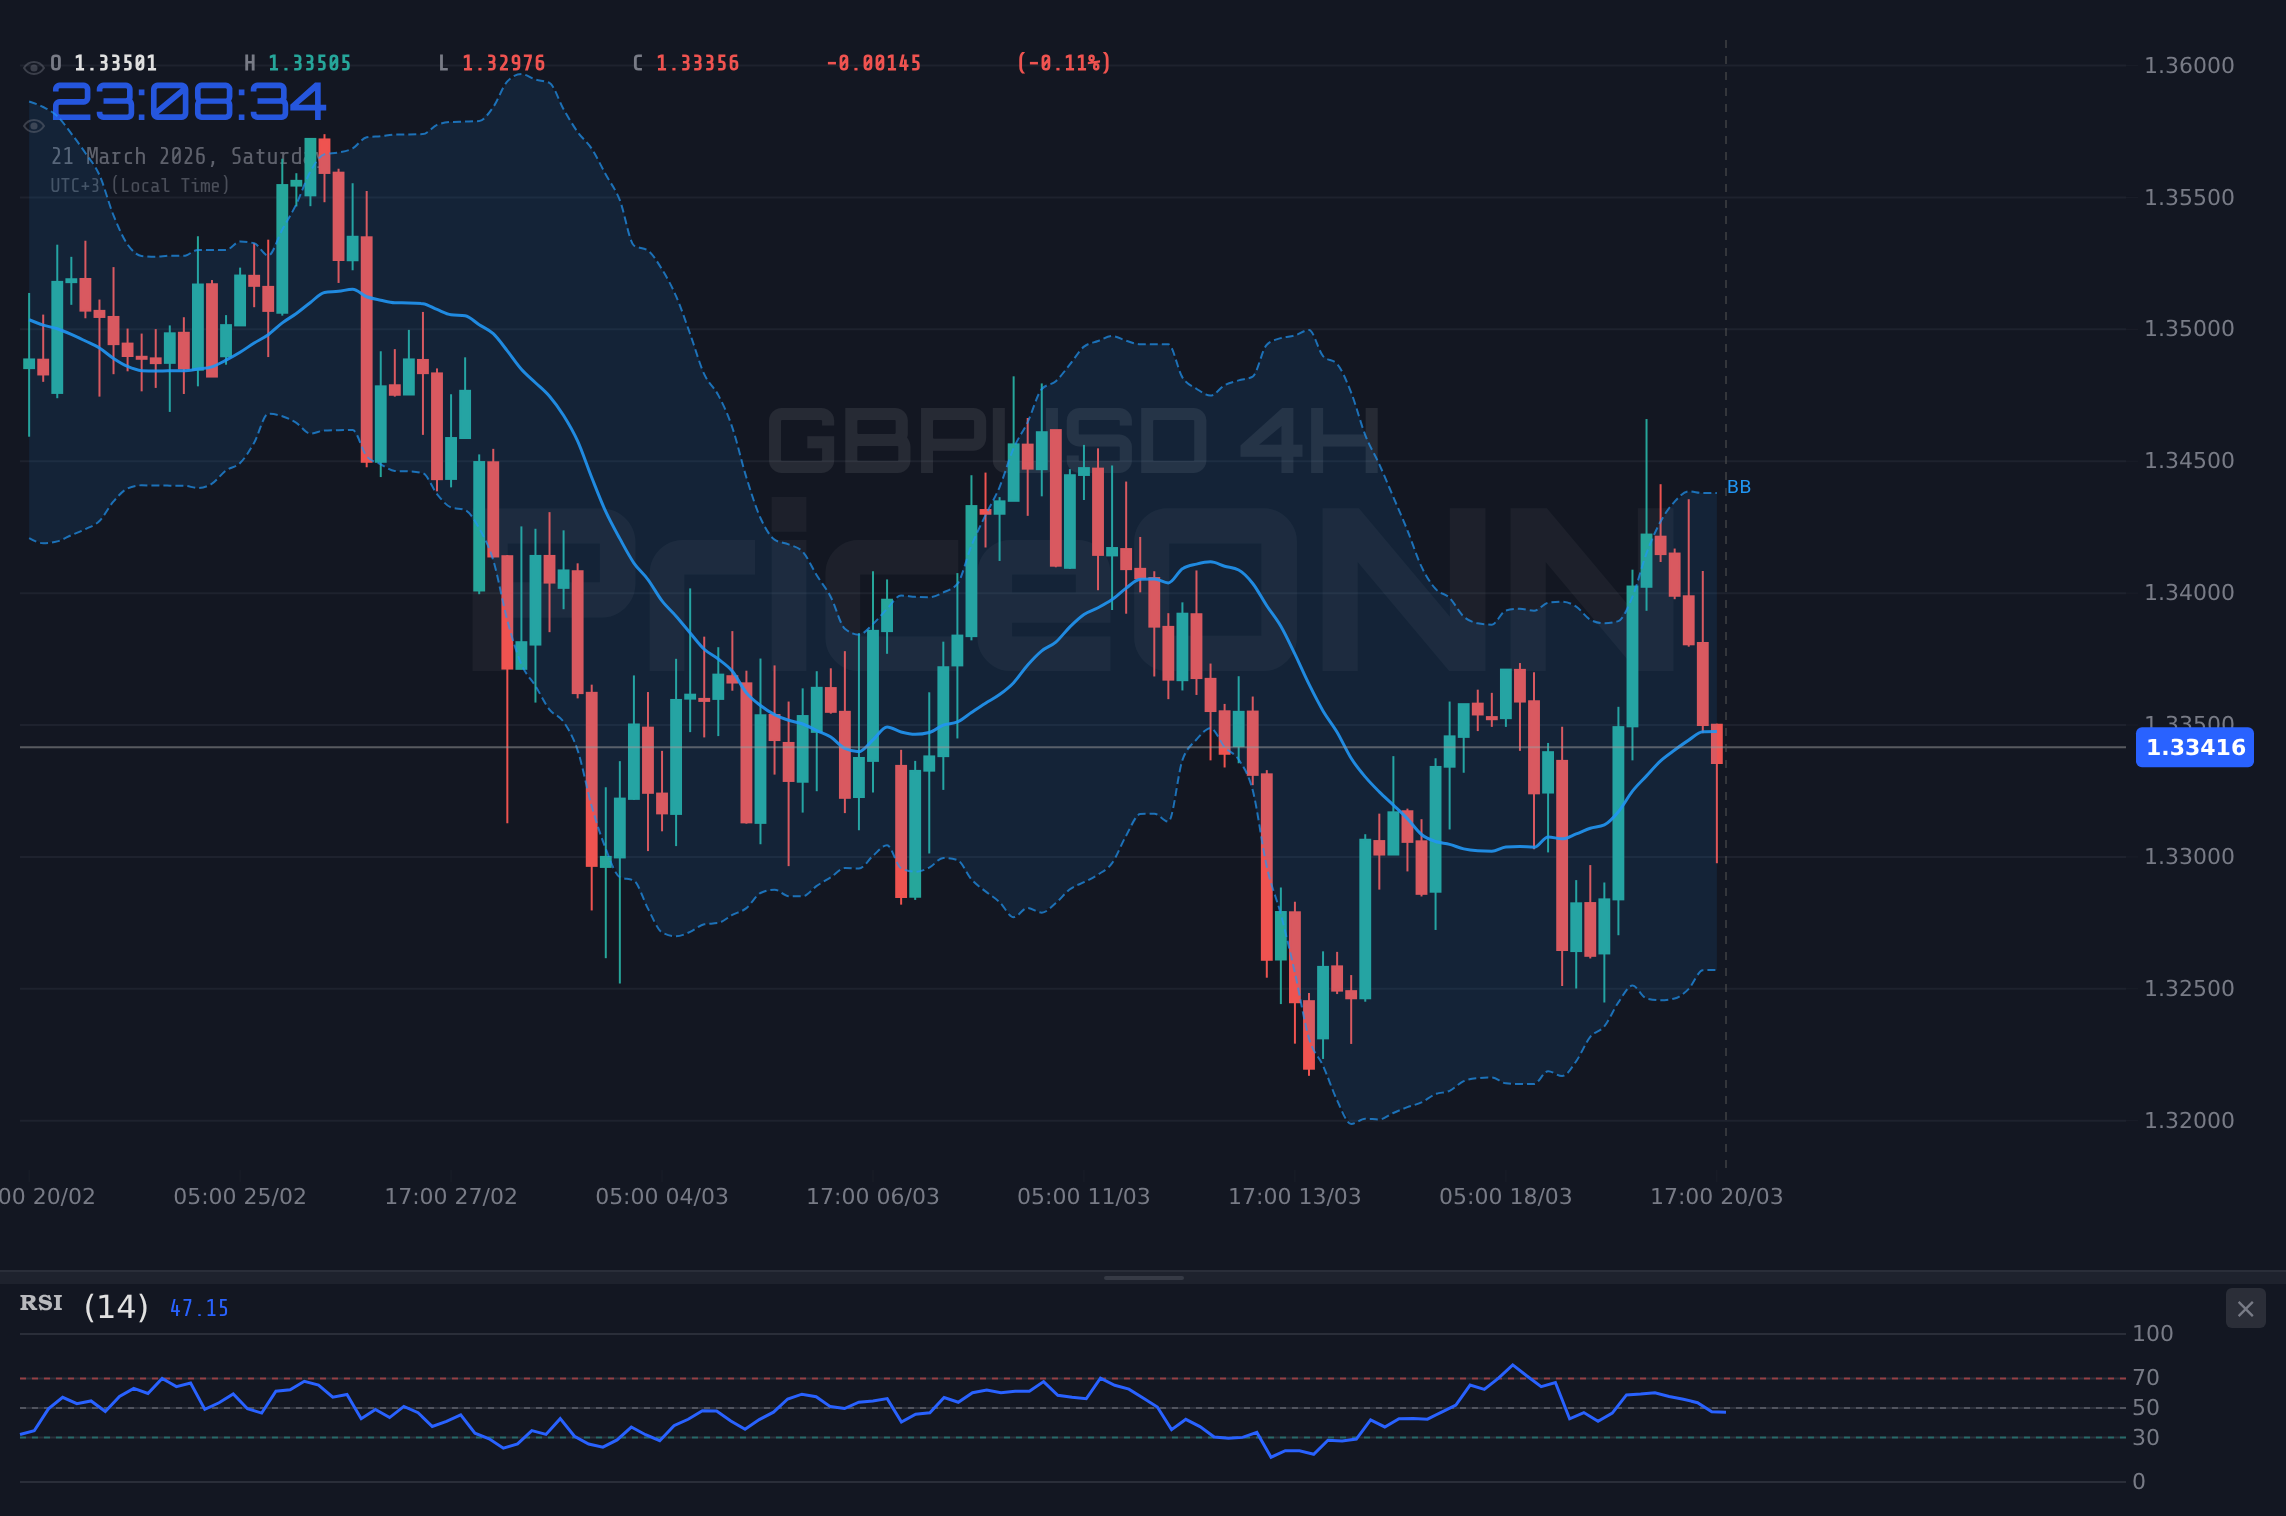
Delving deeper into the technicals, the GBP/USD's daily chart presents a picture of a market testing key support levels. The current price hovers around $1.33435, but the significant daily drop of -0.59% (-0.00787) indicates selling pressure is present. The first daily support level to watch is at $1.32893. A decisive break below this level would signal a further bearish continuation, potentially opening the door for a test of the next support at $1.31565. On the resistance side, the immediate hurdle for the bulls is the current price area, with the daily resistance R1 identified at $1.35105. Breaking and holding above this level would be crucial for any significant bullish reversal, with R2 at $1.35989 and R3 at $1.37317 representing further upside targets.
The hourly (1H) timeframe shows a slightly different dynamic, with the trend currently neutral but showing a slight bullish bias (Power: 50%). Support is found at $1.33149, $1.33048, and $1.32863, while resistance is capped at $1.33435, $1.33620, and $1.33721. The RSI(14) on this timeframe is at 42.55, indicating a bearish inclination, but the Stochastic Oscillator shows %K at 29.29 and %D at 15.14, suggesting a potential upward cross from oversold conditions. This hourly view suggests that while the daily trend is bearish, there might be short-term buying opportunities if support holds. However, the ADX at 27.93 on the 1H chart indicates a strong downtrend is in play, making any upside moves potentially shallow.
The 4-hour timeframe presents a neutral trend (Power: 50%), with support at $1.33285, $1.33069, and $1.32670. Resistance levels are set at $1.33900, $1.34299, and $1.34515. Here, the RSI(14) is at 48.39, still below the 50-level, reinforcing the bearish bias. The MACD is showing positive momentum, crossing above its signal line, which could be interpreted as a bullish sign, but this conflicts with the broader bearish trend suggested by the daily ADX of 29.92. The Stochastic Oscillator on the 4H chart shows %K at 50 and %D at 70.78, indicating a bearish signal as %K is below %D, further complicating the picture. This mixed signal environment underscores the importance of waiting for confirmation before committing to a trade.
The overall technical signal across different timeframes paints a picture of caution. The daily chart's bearish lean, supported by RSI and MACD, suggests that downside risks remain elevated. However, the oversold readings on the Stochastic Oscillator in the shorter timeframes could hint at a potential short-term bounce. This is a classic scenario where traders need to be patient and wait for a clear break of either support or resistance, or for confirmation from multiple indicators aligning. The ADX values across the timeframes (27.93 on 1H, 20.06 on 4H, 29.92 on 1D) indicate that trends are generally present, but their strength varies, suggesting periods of consolidation interspersed with potential moves.
Fundamental Catalysts: What's Next for GBP/USD?
Looking ahead, the economic calendar is packed with events that could significantly impact GBP/USD. The upcoming UK employment data, including the unemployment rate and average earnings, will be crucial. Strong figures could reinforce the narrative of a resilient UK economy, potentially bolstering the Pound. Conversely, disappointing numbers might increase pressure on the Bank of England to consider easing monetary policy sooner rather than later, which would likely weigh on GBP/USD. The market will be particularly sensitive to any signs of persistent wage inflation, as this is a key concern for central banks trying to tame rising prices.
Furthermore, the Federal Reserve's upcoming policy decision and statements will be closely watched. While the Fed is not expected to change interest rates at this meeting, the accompanying statement and projections will provide vital clues about their future monetary policy path. Any indications of a more hawkish stance - perhaps due to sticky inflation in the US - could strengthen the US Dollar further, exacerbating the downward pressure on GBP/USD. Traders will be dissecting every word from Fed officials for signals on the timing and pace of potential rate cuts or hikes, which directly influences the interest rate differential between the US and the UK.
The correlation between GBP/USD and the DXY cannot be overstated. As mentioned, the DXY is currently showing a strong daily uptrend. If this trend continues, driven by Fed hawkishness or a 'risk-off' sentiment in global markets, it will naturally create headwinds for GBP/USD. Conversely, any sign of weakness in the dollar, perhaps due to dovish signals from the Fed or improving global risk appetite, could provide a much-needed tailwind for the Sterling. This dynamic highlights the importance of monitoring not just UK-specific news but also broader US economic data and global risk sentiment.
Geopolitical developments also continue to cast a shadow over global markets. While not directly impacting GBP/USD in the same way as energy prices, heightened geopolitical tensions can increase demand for safe-haven assets like the US Dollar, indirectly affecting the pair. Any escalation in global conflicts or trade disputes could lead to increased volatility and a flight to safety, which would likely benefit the USD and weigh on GBP/USD. The recent news regarding energy markets, such as the attack on Qatar's Ras Laffan energy hub, highlights the potential for unexpected events to disrupt supply chains and influence inflation expectations, further complicating the macroeconomic picture.
The concept of 'carry trade' is also relevant here. With interest rate differentials potentially widening or narrowing based on central bank policies, the cost of holding certain currency pairs can change. If US interest rates remain relatively higher or rise faster than UK rates, it could encourage carry trades into the US Dollar, putting further downward pressure on GBP/USD. Conversely, if the BoE adopts a more hawkish stance than anticipated, it could make Sterling more attractive for carry trades, supporting the pair.
Understanding these macro-level forces is essential. It's not just about the price action on the chart; it's about the underlying economic and geopolitical currents driving those movements. For instance, the recent plunge in gold, silver, and copper prices, as reported, suggests a broader risk-off sentiment or a deleveraging event in commodities, which could spill over into currency markets. If this trend continues, it might indicate a broader market move away from riskier assets, potentially favoring the safe-haven US Dollar over the British Pound.
Trading Scenarios for the Week Ahead
Bearish Scenario: Consolidation Below Key Resistance
65% ProbabilityNeutral Scenario: Range-Bound Trading Around $1.33
25% ProbabilityBullish Scenario: Unexpected BoE Hawkishness or Strong Data
10% ProbabilityThe market sentiment currently favors a bearish outlook for GBP/USD, especially given the persistent strength of the US Dollar Index (DXY) trading at 99.25. The daily chart's RSI at 45.27 and the negative MACD momentum reinforce this view. However, the oversold conditions indicated by the Stochastic Oscillator on shorter timeframes suggest that any further downside might be met with some buying interest, potentially leading to a period of consolidation around the $1.33 level. The critical support at $1.32893 remains the level to watch for a bearish confirmation, while breaking above $1.3380 is needed to challenge the more significant resistance at $1.35105.
The upcoming week is pivotal, with key economic data releases from the UK, including employment figures, and the Federal Reserve's policy decision. These events have the potential to shift the balance of power between the two currencies. Traders should pay close attention to wage growth figures, as they are a key inflation indicator that the BoE monitors closely. If wage growth remains elevated, it could imply continued inflationary pressures, potentially leading the BoE to maintain a cautious stance on rate cuts, which could support Sterling. Conversely, a slowdown in wage growth might signal easing inflation, increasing the likelihood of BoE rate cuts and pressuring GBP/USD.
The correlation with the DXY is a dominant theme. As DXY is currently at 99.25 and showing strong daily uptrend signals (ADX 34.64), it presents a significant headwind for GBP/USD. Any further strengthening of the dollar, perhaps driven by a hawkish Fed or a 'risk-off' sentiment in global markets, would likely push GBP/USD lower. The recent commodity sell-off, with gold, silver, and copper prices tumbling, could be an indicator of broader market deleveraging or a shift towards safe-haven assets, further supporting the dollar's strength. This macro environment suggests that bullish scenarios for GBP/USD will require a significant catalyst, such as unexpected hawkishness from the BoE or a sharp reversal in the DXY.
Risk management remains the most critical aspect for traders navigating this environment. Given the conflicting signals and the potential for sharp moves on key data releases, it is advisable to approach the market with caution. Waiting for clear confirmation of a trend, either a break of key support at $1.32893 or a sustained move above resistance at $1.35105, would be prudent. For those looking for short-term opportunities, monitoring the hourly and 4-hour charts for divergences and confluence of signals can be helpful, but always with strict stop-loss orders in place. The current price action around $1.33 suggests a period of waiting might be more profitable than forcing trades in an uncertain market.
Frequently Asked Questions: GBP/USD Analysis
What is the immediate outlook for GBP/USD if it fails to break above $1.3380 resistance?
If GBP/USD fails to break above the $1.3380 resistance level, especially with weak UK economic data, the bearish scenario becomes more probable. This could lead to a test of the $1.32893 support level, with a potential move towards $1.31565 if selling pressure intensifies.
Should I consider buying GBP/USD at current levels around $1.33 given the oversold Stochastic signals?
While oversold Stochastic signals on shorter timeframes might suggest a short-term bounce, the overall daily trend remains bearish (RSI at 45.27). A confirmed buy signal would require a break above $1.3380 resistance and ideally a bullish divergence across multiple indicators, with a 65% probability favoring the downside currently.
Is the RSI at 45.27 on the daily chart a strong sell signal for GBP/USD?
An RSI reading of 45.27 indicates a bearish bias but is not yet in the oversold territory. It suggests that sellers have a slight advantage, but a strong sell signal would typically require RSI to break below 40 or show clear divergence against price action, especially when confirmed by other indicators like MACD.
How might the upcoming BoE policy decision affect GBP/USD, especially if they signal rate cuts?
If the Bank of England signals potential rate cuts, it would likely weaken the Sterling, putting downward pressure on GBP/USD. This could accelerate a move towards the $1.32893 support level. Conversely, a hawkish surprise from the BoE could trigger a bullish scenario, targeting resistance levels above $1.3380.
Track markets in real-time
AI-powered analysis, technical indicators and real-time price data.
Join Our Telegram Channel
Breaking market news, AI analysis and trading signals instantly.
Join Channel