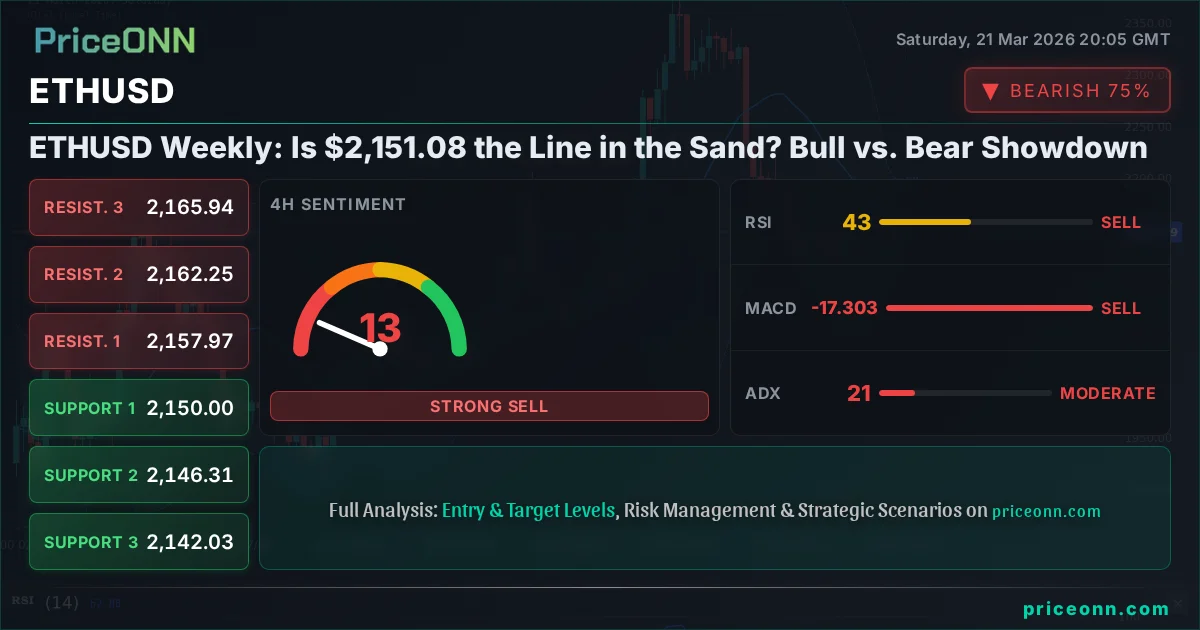
ETHUSD Weekly: Is $2,151.08 the Line in the Sand? Bull vs. Bear Showdown
ETHUSD analysis at $2,151.08. Bears eye key support at $2,142.03, while bulls target resistance at $2,165.94. A neutral outlook prevails amidst mixed signals.
This is where the real battleground lies for ETHUSD. At $2,151.08, the bulls and bears are locked in a fierce tug-of-war, with neither side able to decisively claim victory. Last week saw significant volatility, with price action oscillating around critical technical levels. The question on every trader's mind is whether the current neutral stance will break, and if so, in which direction. Analyzing the confluence of technical indicators, macroeconomic undercurrents, and recent market developments is crucial to understanding the potential path forward for Ethereum's price. This week's review dives deep into the opposing arguments, weighing the evidence for both a bullish continuation and a bearish reversal, all while keeping a close eye on the $2,151.08 pivot point.
- ETHUSD is currently trading at $2,151.08, with a neutral outlook on the daily timeframe.
- Key support is identified at $2,142.03, while resistance looms at $2,165.94.
- The 4-hour RSI at 43.3 suggests bearish momentum, contrasting with the 1-hour RSI at 51.89 pointing towards a neutral-to-bullish bias.
- Geopolitical tensions and the strength of the US Dollar Index (DXY), currently at 99.25, are influencing cryptocurrency market sentiment.
The Bullish Case: Holding the Line at $2,151.08
For the bulls, the current price action around $2,151.08 represents a critical juncture, a line in the sand that must hold to preserve the broader uptrend. While the daily chart might show a neutral trend with a '50% strength' reading, the 1-hour timeframe offers a glimmer of hope, displaying a '70% Buy' signal. This short-term bullish bias is supported by a 'Buy' signal from the 1-hour Stochastic (%K: 31.72, %D: 30.16), indicating potential upward momentum. Furthermore, the 1-hour MACD is showing positive momentum, even if it's currently below the signal line, suggesting that buying pressure could re-emerge. The 1-hour RSI, sitting at 51.89, hovers just above the midpoint, implying a slight edge for buyers in intraday trading. This resilience, especially after recent market turbulence evidenced by the S&P 500's 1.21% drop and Nasdaq's 1.65% decline, is seen as a sign of underlying strength in ETHUSD.
The argument for a bullish continuation hinges on the idea that the recent price consolidation is merely a pause before the next leg up. Bulls point to the fact that ETHUSD has not decisively broken below the crucial $2,142.03 support level on the 4-hour chart, despite significant selling pressure in traditional markets. They might argue that the broader crypto market's reaction to macroeconomic data, like the recent strength in oil prices (Brent at $112.79, WTI at $98.50) potentially fueling inflation concerns, could eventually lead investors back to risk assets like Bitcoin and Ethereum as a hedge. The fact that Bitcoin, despite a slight dip to $70,402, is still consolidating above key support levels, could be seen as a positive sign for the entire crypto ecosystem, including ETHUSD. The general 'Buy' signals on the 1-hour timeframe across multiple indicators, despite mixed signals elsewhere, provide a narrative for short-term optimism. If ETHUSD can hold above $2,150 and then decisively break through the $2,157.97 resistance on the 4-hour chart, a move towards the $2,162.25 or even $2,165.94 levels could be on the cards. This would invalidate the short-term bearish momentum and confirm a bullish bias.
Moreover, the narrative of Ethereum's ongoing development and upgrades, such as the potential for reduced bridge times and the push for 'one-click staking,' continues to be a fundamental tailwind. While these are longer-term catalysts, they provide a backdrop of positive sentiment that can influence short-term trading decisions. Bulls might also draw parallels to past market cycles where significant dips were eventually bought, leading to new all-time highs. The current RSI readings on the 1-hour chart, while not screaming 'oversold,' are far from 'overbought,' suggesting room for upward movement before any significant profit-taking pressure kicks in. The ADX at 18.13 on the 1-hour chart, though indicating a weak trend, also suggests that the market isn't strongly trending downwards, leaving room for a bullish reversal to take hold if key resistance levels are breached. The strength of the bullish signals in the 1-hour timeframe, particularly from Stochastic and the general 'Buy' consensus, forms the bedrock of the optimistic outlook.
The Bearish Case: Pressure Mounting at $2,151.08
On the flip side, the bears see the $2,151.08 level not as a bastion of support, but as a precarious perch before a significant decline. Their argument is primarily built on the bearish signals observed on the 4-hour and daily timeframes. The 4-hour chart shows a 'Sell' signal with a '100%' trend strength, indicating a dominant downtrend. The RSI(14) on this timeframe is particularly concerning, sitting at 43.3, well below the midpoint and suggesting bearish momentum is building. The Stochastic indicator on the 4-hour chart also shows %K at 65.36 and %D at 57.32, indicating a potential bearish crossover and further downside pressure. The ADX on the 4-hour chart, at 21.15, while indicating a weak trend, still leans towards a downward bias when combined with other bearish indicators.
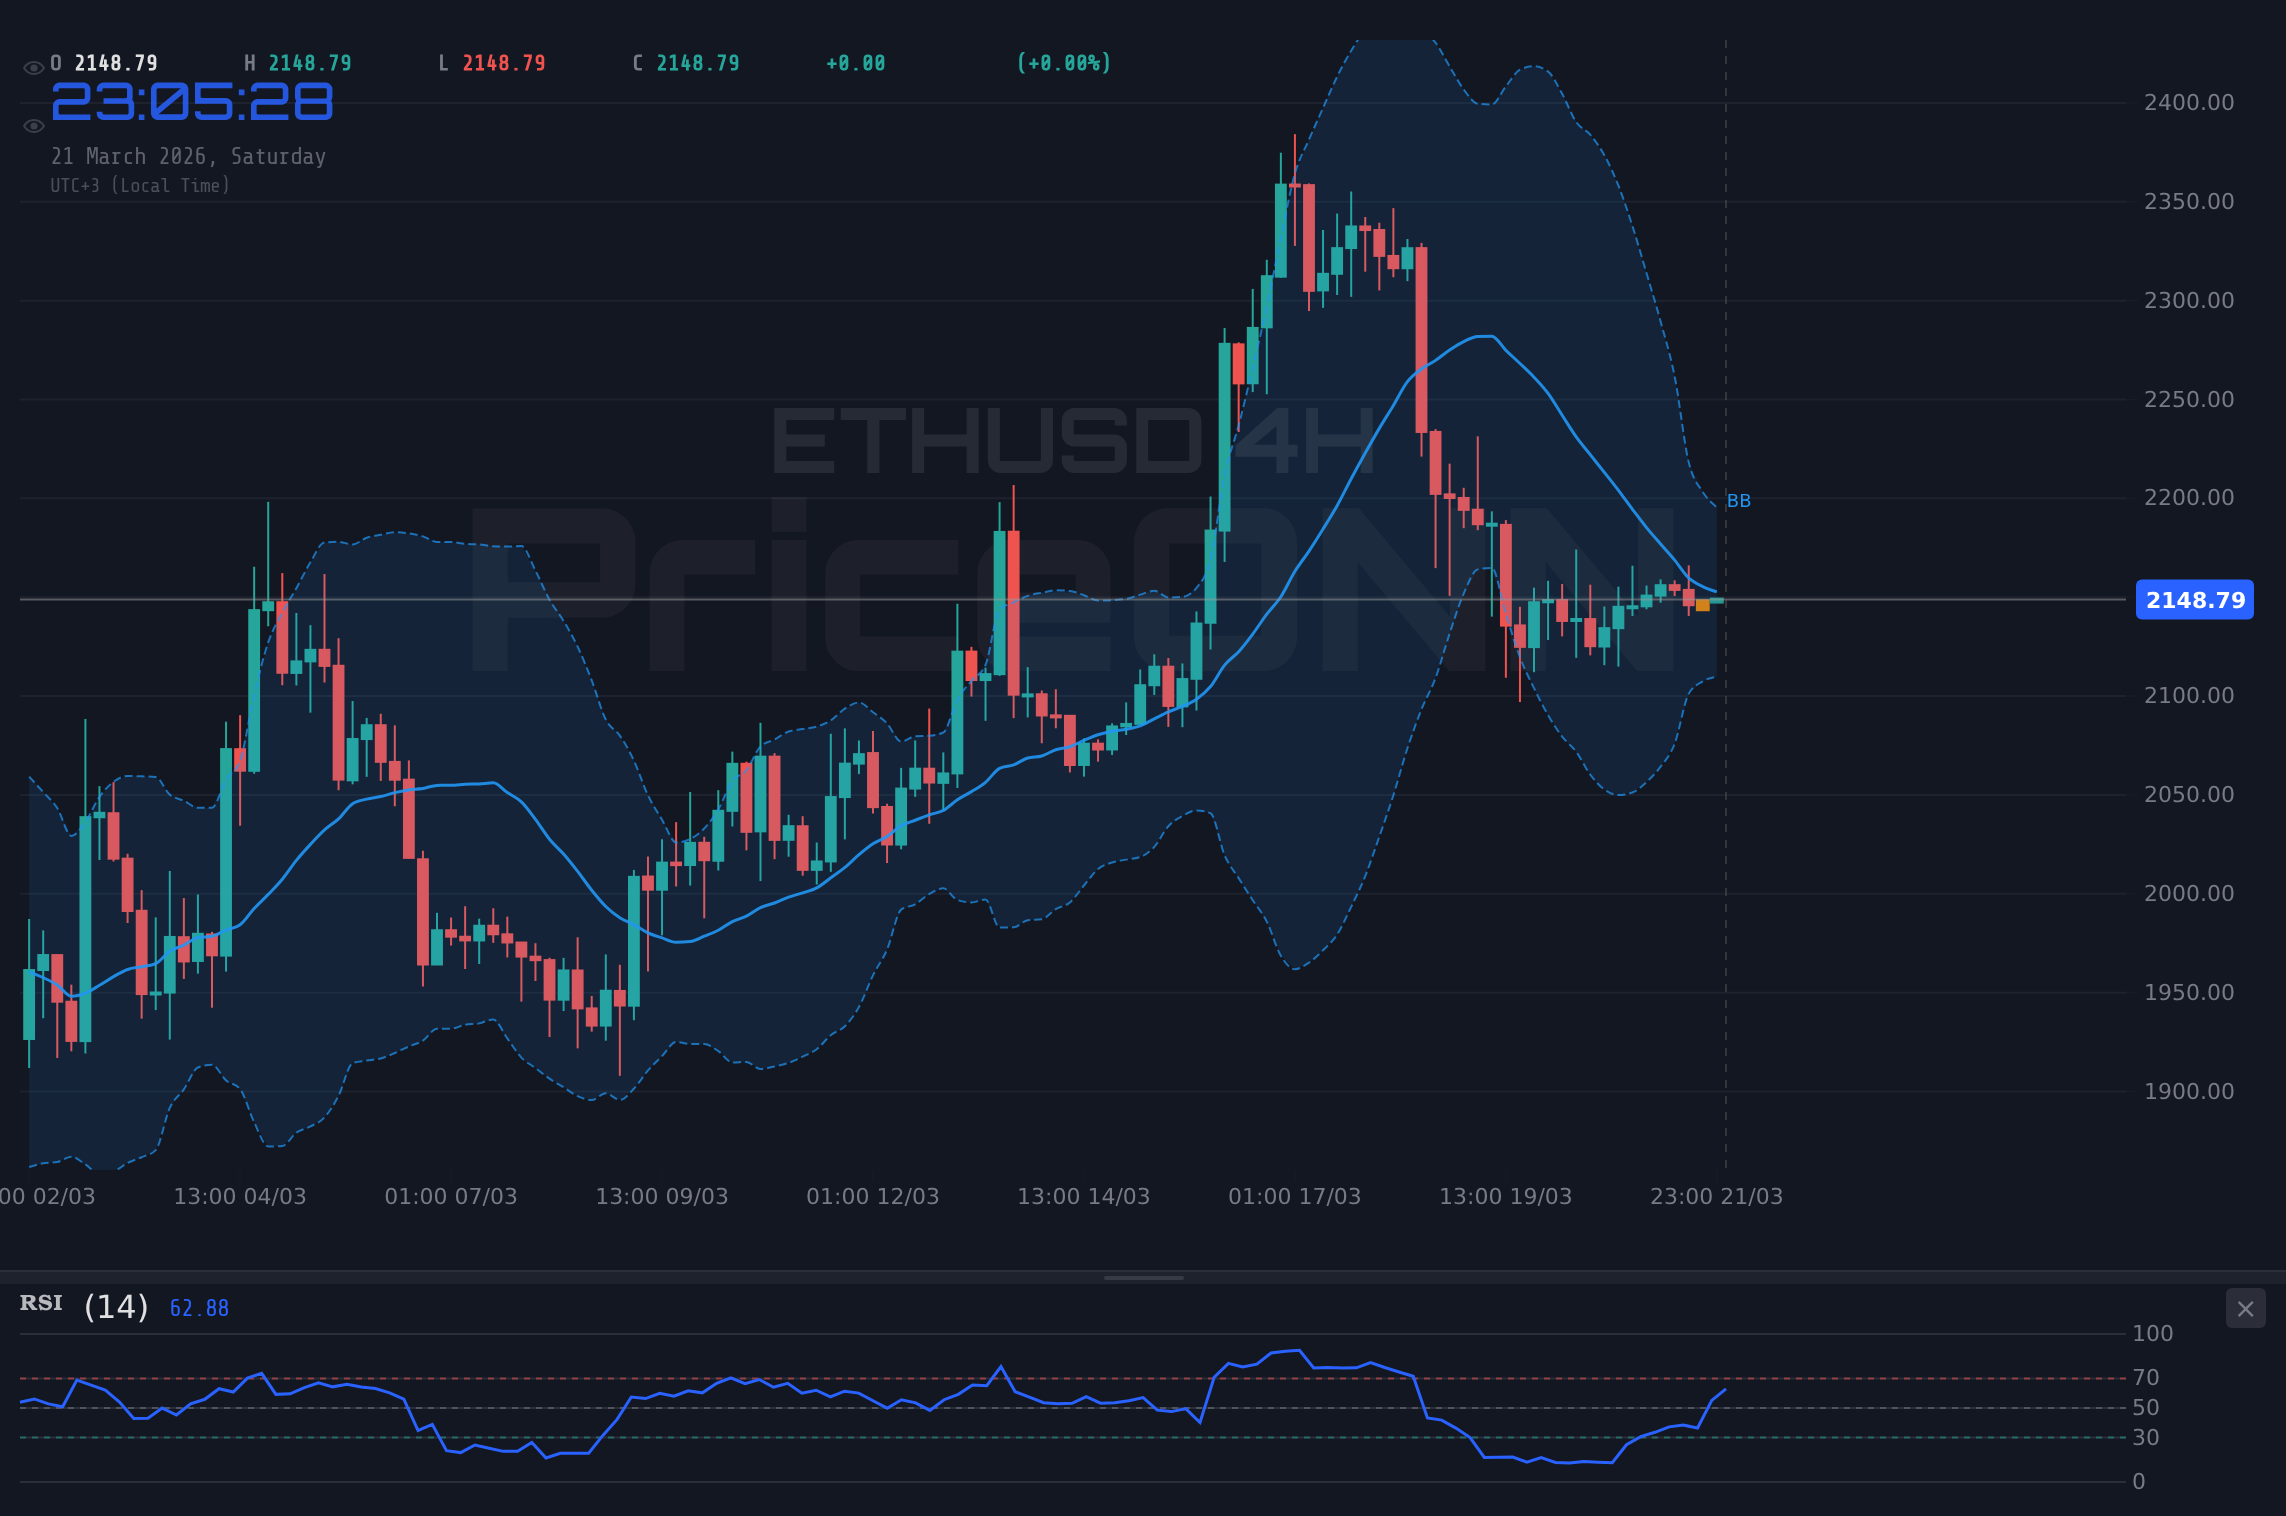
The daily timeframe paints an even more cautionary picture. The trend is classified as 'Bullish (82% strength)' on the daily chart, but this is contradicted by a 'Sell' signal overall and a daily RSI at 51.89, which is neutral but leaning towards a potential downturn. The MACD on the daily chart shows positive momentum, but it is still below the signal line, hinting at potential weakness. The fact that ETHUSD is trading below the middle Bollinger Band on the 4-hour chart, and the Stochastic showing a bearish crossover (%K: 34.09, %D: 63.6) on the daily chart, reinforces the bearish narrative. Bears are particularly worried about the failure to decisively break through resistance levels, such as the $2,157.97 on the 4-hour chart, and the potential for a retest and break of the $2,142.03 support. The significant drops seen in traditional markets, with S&P 500 down 1.21% and Nasdaq down 1.65%, coupled with the strengthening US Dollar Index (DXY) to 99.25, create a risk-off environment that typically weighs on cryptocurrencies. The recent sharp decline in gold, silver, and copper prices, as reported by various news outlets, further signals a broader market deleveraging, which could spill over into the crypto space.
Furthermore, the bears might point to the fact that the positive developments in Ethereum's ecosystem, while important, are not yet translating into sustained price appreciation. They could argue that the market is becoming increasingly sensitive to macroeconomic news and central bank policy shifts, which are currently creating an uncertain environment. The Federal Reserve's stance on interest rates, the ongoing geopolitical tensions, and the potential for inflation to remain sticky could all contribute to a more cautious investor sentiment, leading to a rotation away from riskier assets. The bearish signals on the 4-hour and daily charts, particularly the RSI and Stochastic readings, suggest that the path of least resistance might be downwards. A decisive break below the $2,142.03 support level could open the floodgates for a move towards the next support at $2,146.31 and potentially even lower, invalidating any short-term bullish attempts.
The Neutral Stance: Waiting for Confirmation
Caught between the warring bulls and bears, a neutral stance suggests that the market is awaiting clearer direction. The current price of $2,151.08 sits precariously between key support and resistance levels, making it difficult to establish a strong directional bias. On the daily chart, the trend is technically classified as 'Bullish (82% strength)', yet the overall 'Sell' signal and a neutral RSI of 51.89 suggest caution. The MACD on the daily chart is showing positive momentum, but it remains below the signal line, indicating indecision. The 4-hour chart presents a more bearish picture with a strong downtrend and bearish RSI, while the 1-hour chart offers a slight bullish tilt with its 'Buy' signals and neutral-to-positive RSI.
This divergence across different timeframes is the hallmark of a market in consolidation. Traders adopting a neutral approach are likely waiting for a decisive break above the $2,165.94 resistance on the 4-hour chart to confirm a bullish move, or a clear breach below the $2,142.03 support to signal a bearish continuation. Until then, they might be employing range-trading strategies, looking to buy near support and sell near resistance, or simply staying on the sidelines. The ADX values across the timeframes also reflect this uncertainty: strong on the 4-hour (21.15) and daily (23.89) in terms of trend strength but showing a weak trend on the 1-hour (18.13). This suggests that while a trend might be present on longer timeframes, it lacks conviction, making it prone to reversals or sideways movement.
The macroeconomic backdrop further supports a neutral outlook. The strength of the DXY at 99.25 indicates a firm dollar, which typically puts pressure on risk assets. However, the simultaneous strength in oil prices (Brent at $112.79, WTI at $98.50) hints at inflationary pressures that could, in theory, drive investors towards inflation hedges like gold (currently at $4,497.65) and potentially Bitcoin and Ethereum. Yet, the sharp declines in gold, silver, and copper this week suggest that risk aversion is currently trumping inflation hedging narratives. This conflicting set of macro signals - a strong dollar versus rising commodity prices, and risk-off sentiment in traditional markets versus the potential for crypto as an inflation hedge - creates an environment ripe for consolidation in ETHUSD. Investors are likely waiting for clearer signals from central banks, inflation data, or geopolitical developments before committing to a strong directional bet.
Technical Confluence and Key Levels
To navigate this indecisive market, focusing on specific technical levels and indicator confluence is paramount. On the 1-hour chart, the immediate resistance is at $2,153.34, followed by $2,157.83 and $2,162.01. A break and hold above these levels, particularly $2,162.01, would be a strong bullish signal, potentially targeting higher levels. Support on this timeframe is found at $2,144.67, $2,140.49, and $2,136. A break below $2,140.49 could signal a short-term bearish move.
The 4-hour chart presents more significant levels. Resistance is observed at $2,157.97, then $2,162.25, and finally $2,165.94. A sustained move above $2,165.94 would be crucial for bulls to regain control. Conversely, support is located at $2,150, $2,146.31, and $2,142.03. A decisive close below $2,142.03 would likely trigger further downside, potentially targeting $2,137.80 (a level not explicitly provided but implied by the trend). The daily support levels are wider, at $2,115.31, $2,085.47, and $2,056.06, indicating that a significant break of the current range would be required for such a move.
Indicator confluence adds another layer to this analysis. The bearish lean on the 4-hour and daily charts (RSI below 50, bearish Stochastic crossovers) clashes with the slightly bullish tilt on the 1-hour chart. This suggests that short-term traders might find opportunities, but the overall trend remains uncertain. The ADX values are also mixed: weak on the 1-hour (18.13), indicating a lack of directional conviction, but stronger on the 4-hour (21.15) and daily (23.89), suggesting some underlying trend is present, albeit not overwhelmingly strong. Traders will be looking for a clear signal: either a strong bullish breakout confirmed by volume and bullish indicator alignment across multiple timeframes, or a decisive bearish breakdown below key support levels, confirmed by bearish divergences and increasing selling pressure.
The Verdict: A Neutral Outlook with Cautionary Undertones
After dissecting the bullish arguments, the bearish counterpoints, and the neutral observations, the prevailing outlook for ETHUSD at $2,151.08 remains cautiously neutral. The conflicting signals across different timeframes and indicators prevent a strong conviction in either direction. While the 1-hour chart offers some bullish indications, the bearish leanings on the more influential 4-hour and daily charts cannot be ignored. The current market environment, characterized by geopolitical uncertainty, a strengthening US dollar (DXY at 99.25), and mixed signals from traditional asset classes like gold ($4,497.65) and oil ($112.79 for Brent), further supports a period of consolidation.
The bulls need to see a decisive break and hold above the $2,157.97 resistance on the 4-hour chart, ideally confirmed by bullish momentum across multiple timeframes and a positive reaction to upcoming economic data. Conversely, the bears will be looking for a clear break below the $2,142.03 support, which would confirm the bearish trend observed on longer timeframes and potentially trigger a sell-off towards $2,115.31. Until one of these levels is decisively breached with conviction, caution is the advised strategy. Trading within the current range, while potentially offering short-term opportunities, carries inherent risks due to the lack of clear directional momentum. Investors and traders should remain vigilant, monitor key economic releases, and wait for clearer signals before committing significant capital.
Bearish Scenario: Breakdown Below Support
60% ProbabilityBullish Scenario: Resistance Breakout
25% ProbabilityNeutral Scenario: Range-Bound Consolidation
15% ProbabilityFrequently Asked Questions: ETHUSD Analysis
What happens if ETHUSD breaks below the $2,142.03 support level?
A break below the $2,142.03 support on the 4-hour chart would invalidate the short-term bullish outlook and likely trigger further downside. Bears would target the next significant support at $2,115.31, especially if the broader market sentiment remains risk-off.
Should I buy ETHUSD at current levels of $2,151.08 given the mixed signals?
A neutral stance suggests caution at current levels. While the 1-hour chart shows some bullish potential, the bearish leanings on longer timeframes indicate a lack of conviction. Waiting for a clear break above $2,157.97 resistance or a confirmed drop below $2,142.03 support is advisable for a higher probability trade setup.
Is the RSI at 43.3 on the 4-hour chart a strong sell signal for ETHUSD?
An RSI of 43.3 on the 4-hour chart indicates bearish momentum but is not yet in extreme oversold territory. Combined with other bearish indicators on this timeframe, it supports the case for potential downside, but confirmation through a break of support would strengthen the sell signal significantly.
How will the strong DXY at 99.25 affect ETHUSD this week?
A strong US Dollar Index (DXY) at 99.25 typically creates headwinds for risk assets like ETHUSD. This could dampen bullish sentiment and increase selling pressure, especially if geopolitical tensions continue to drive safe-haven demand towards the dollar.
Volatility creates opportunity - those prepared will be rewarded. While the current ETHUSD chart presents a neutral picture, the underlying technicals and macroeconomic factors provide clues for potential future movements. Staying disciplined, managing risk, and waiting for clear confirmation signals are paramount. The market always provides another opportunity, and patience will be key in navigating these choppy waters. Keep a close eye on the $2,142.03 support and $2,157.97 resistance levels as the primary battlegrounds in the coming week.
Technical Outlook Summary
| Indicator | Value | Signal | Interpretation |
|---|---|---|---|
| RSI (14) | 43.3 | Bearish | Suggests bearish momentum on 4H, but not extreme. |
| MACD Histogram | -0.78 | Bearish | Negative momentum indicating selling pressure. |
| Stochastic | 65.36 / 57.32 | Bearish Crossover | Potential for further downside on 4H. |
| ADX | 21.15 | Neutral Trend | Indicates a weak trend on 4H, prone to consolidation. |
| Bollinger | Middle Band | Below Band | Suggests bearish pressure on 4H. |
Track markets in real-time
AI-powered analysis, technical indicators and real-time price data.
Join Our Telegram Channel
Breaking market news, AI analysis and trading signals instantly.
Join Channel