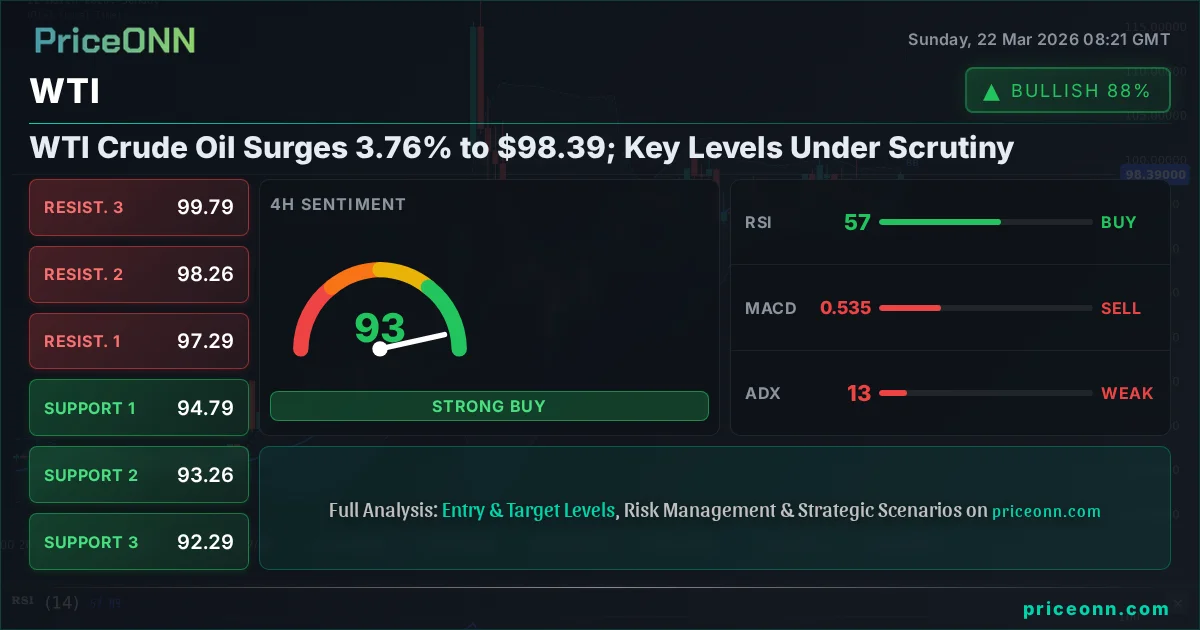
WTI Crude Oil Surges 3.76% to $98.39; Key Levels Under Scrutiny
WTI Crude Oil climbed 3.76% to $98.39 last week. Analysis reveals critical support at $91.26 and resistance at $99.60.
Last Friday, WTI crude oil experienced a significant upward move, closing the week at $98.39 after a robust 3.76% gain. This surge, driven by a confluence of factors including renewed Middle East tensions and tightening supply expectations, has repositioned the market at a crucial juncture. As we step into the new trading week, traders are closely watching key technical levels that could dictate the next phase of price action. The market's reaction to these levels, coupled with ongoing geopolitical developments and macroeconomic data, will be paramount in shaping the outlook for crude oil.
- WTI Crude Oil closed Friday at $98.39, up 3.76% for the week.
- The 1D RSI stands at 70.58, indicating strong bullish momentum but nearing overbought territory.
- Critical support for WTI is identified at $91.26, with resistance eyed at $99.60.
- Geopolitical tensions in the Middle East and supply-side concerns are primary drivers of the recent rally.
Navigating the Surge: WTI's Advance and Technical Signals
The Momentum Behind the Move
The significant jump in WTI crude oil prices last week, culminating in a $98.39 closing print, was not an isolated event but a reflection of shifting market dynamics. On the 1-hour timeframe, the trend indicator shows a neutral stance with 50% strength, but the 4-hour chart reveals an 82% bullish trend. The daily chart, however, paints a picture of strong upward momentum, with a 100% trend strength and an ADX reading of 59.27, signaling a very strong uptrend. This divergence across timeframes suggests that while the immediate sentiment is bullish, the sustainability of this trend will depend on further developments. The RSI(14) on the daily chart is currently at 70.58, firmly in overbought territory. While this indicates strong buying pressure, it also raises a yellow flag for potential pullbacks or consolidation as sellers might step in to take profits. The Stochastic indicator on the daily chart, with %K at 60.96 and %D at 51.71, also supports a bullish trend, showing %K above %D, but it's approaching the upper bounds where a reversal could be signaled.
The MACD indicator on the daily chart is positive, with the MACD line above the signal line, reinforcing the bullish momentum. However, the Bollinger Bands on the daily chart are showing price trading above the middle band, which is generally considered a bullish sign, but the overall context of extremely strong uptrend signals warrants caution against chasing the rally too aggressively. The ADX at 59.27 is exceptionally high, confirming a very strong trend. This level of trend strength often implies that the current move has significant conviction behind it, but it also means that a reversal, when it comes, could be sharp. The challenge for traders is to distinguish between a healthy continuation of the uptrend and the exhaustion phase that often follows such strong rallies.
On the 4-hour chart, the picture is slightly more nuanced. The trend strength is 82% bullish, and the RSI is at 57.06, indicating a healthy upward move without being excessively overbought. The Stochastic (%K=54.04, %D=33.86) also shows a bullish signal with %K above %D. The MACD is showing negative momentum, which contradicts the bullish trend signal, suggesting a potential divergence. The Bollinger Bands remain above the middle band, supporting the upward bias. The ADX at 13.05 is notably lower than the daily reading, indicating a weaker trend on this timeframe, which could suggest that the recent sharp gains might be consolidating or facing resistance.
Examining the Price Action and Key Levels
The price action last week was characterized by a decisive break above previous resistance levels, fueled by a combination of supply concerns and robust demand signals. The daily chart shows WTI crude oil trading within a very strong uptrend, as evidenced by the ADX of 59.27. The immediate resistance level to watch is at $99.60. A sustained break above this level, supported by strong volume and positive momentum indicators, could signal a continuation of the upward trend, potentially targeting the next resistance at $104.37. Conversely, failure to overcome $99.60 could lead to a period of consolidation or a pullback. The daily support level is currently seen at $91.26. A decisive break below this level would invalidate the current bullish thesis and could open the door for further downside, potentially towards the S2 support at $87.69.
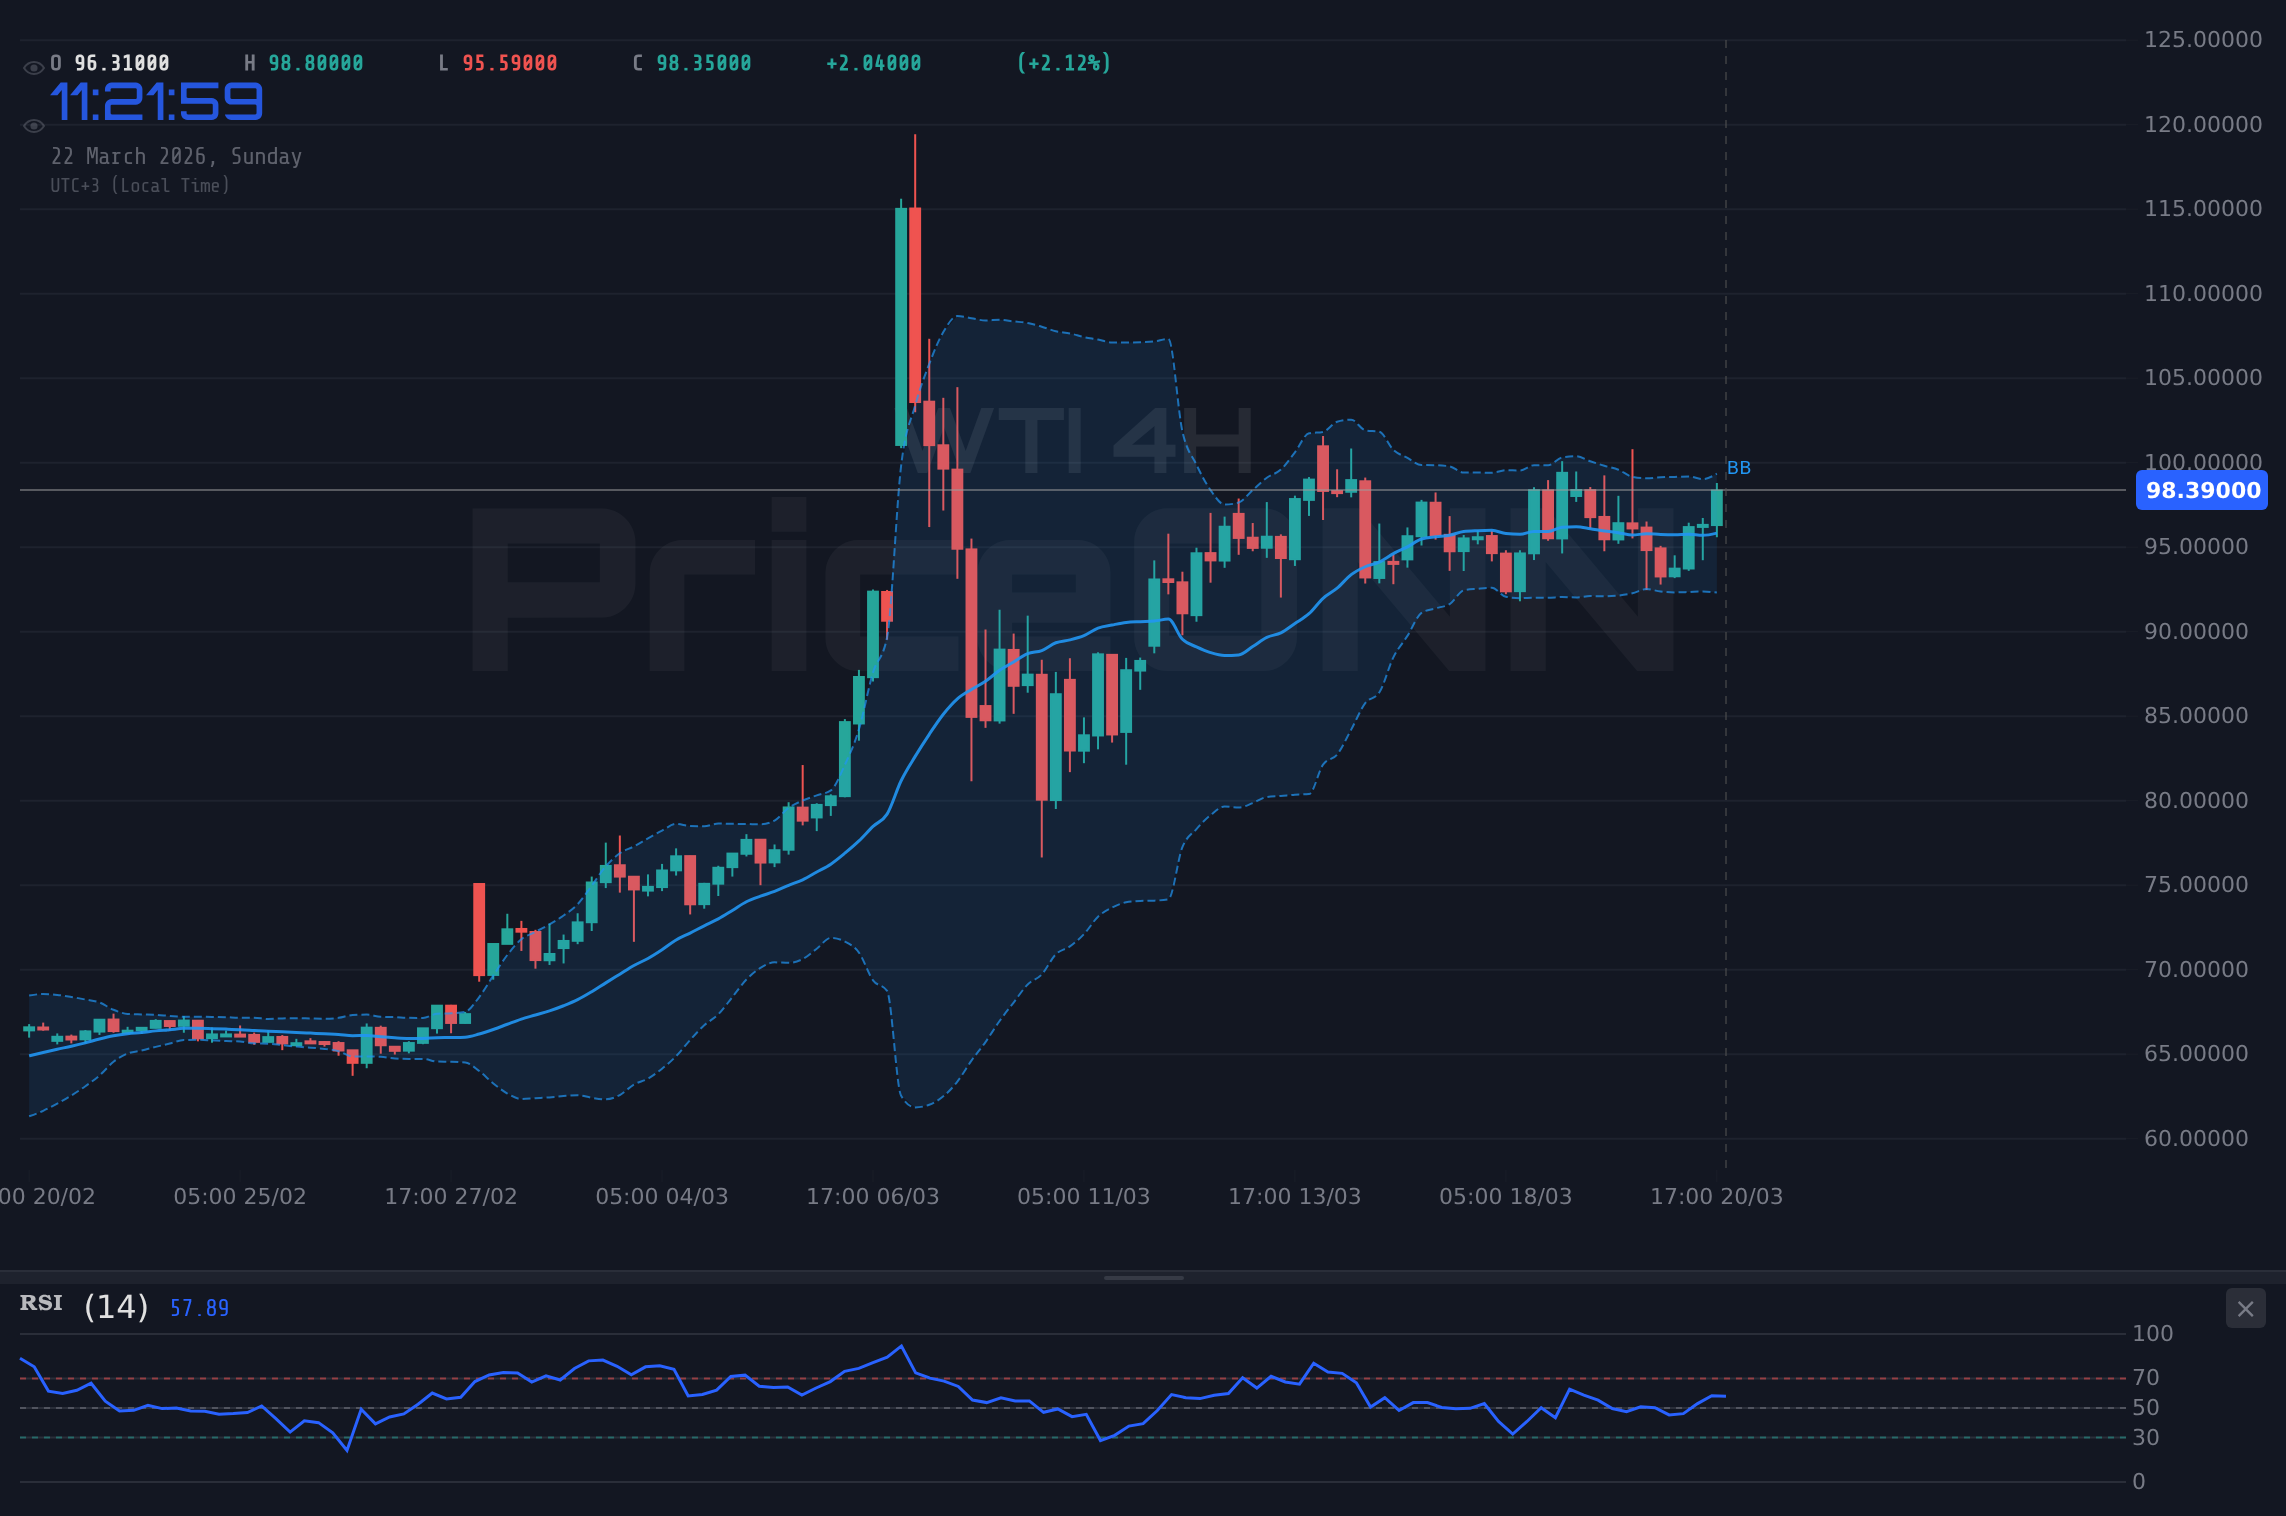
On the 4-hour chart, resistance is seen at $97.29 and $98.26. The fact that the price closed above $98.39 suggests these levels were indeed overcome. The key resistance on this timeframe is $99.79. Support on the 4-hour chart is found at $94.79 and $93.26. The daily chart's support at $91.26 remains the more significant level to monitor for the broader trend. The interplay between these intraday and daily levels will be crucial. For instance, if WTI holds above the $97.29-$98.26 area on the 4-hour chart, it reinforces the bullish outlook. However, a drop below $94.79 could signal an immediate profit-taking opportunity or the start of a correction.
The 1-hour chart provides a closer look at intraday dynamics. Immediate resistance is at $99.54, followed by $100.18. Support is seen at $97.77 and $96.64. The current price of $98.39 sits between these levels, highlighting the tight range that could precede the next significant move. The high ADX of 26.31 on the 1-hour chart suggests that even within this range, there's a degree of trend conviction, but the neutral trend strength (50%) indicates a lack of clear direction. The RSI at 61.45 is in the upper half of its range, indicating bullish sentiment but not yet extreme overbought conditions. The Stochastic (%K=91.26, %D=89.37) is in overbought territory, suggesting that any further upside on this timeframe might be limited without a significant catalyst.
Fundamental Underpinnings and Geopolitical Currents
Supply-Side Dynamics and OPEC+'s Influence
The recent rally in WTI crude oil prices is significantly underpinned by supply-side concerns, most notably the ongoing voluntary production cuts by OPEC+ members. Saudi Arabia's commitment to maintaining cuts, coupled with potential compliance issues from other members, continues to tighten global oil supply. The market is pricing in a deficit, especially as demand shows signs of resilience. The latest market data indicates a very strong uptrend on the daily chart, with an ADX of 59.27, a testament to the market's conviction in the supply-driven narrative. This strong trend suggests that any significant disruption or announcement related to OPEC+ policy could have a magnified impact on prices.
Furthermore, the situation in Alaska, as highlighted by the record-breaking $163.7 million lease sale in the National Petroleum Reserve, signals renewed investor confidence in US oil production. While this might seem counterintuitive to rising prices driven by scarcity, it reflects a longer-term view on supply potential. However, the immediate impact of these lease sales on current production is limited. The focus remains on the short-to-medium term supply picture, where OPEC+'s decisions and geopolitical stability play a dominant role. The market's sensitivity to any news regarding production adjustments or unexpected supply disruptions, particularly from key regions like the Middle East, remains exceptionally high.
Demand-Side Resilience and Economic Indicators
Despite the supply-side pressures, demand for crude oil has shown remarkable resilience. The ongoing expansion of artificial intelligence is creating an unprecedented demand for computing power, which in turn is fueling energy consumption, particularly electricity. While this directly impacts natural gas and nuclear power demand, the broader economic activity spurred by technological advancements indirectly supports oil consumption. News reports suggest that the insatiable energy needs of the AI boom are pushing the US and global energy sectors to their limits, potentially creating a sustained demand environment for all forms of energy, including oil.
Looking at macroeconomic data, the US labor market continues to be a key focus. While specific data points like NFP or CPI were not provided for the past week, their anticipated release in the coming days will be crucial. Stronger-than-expected employment or inflation figures could signal a robust economy, supporting higher oil demand. Conversely, weaker data might raise concerns about economic slowdown, potentially dampening oil demand and putting pressure on prices. The correlation between economic indicators and oil prices remains strong, with traders closely monitoring GDP, PMI, and interest rate expectations. The Fed's stance on interest rates, influenced by inflation and employment data, will also play a significant role in shaping the overall economic outlook and, consequently, oil demand.
Geopolitical Tensions: The Middle East Factor
The specter of geopolitical instability, particularly in the Middle East, continues to be a primary catalyst for the upward pressure on WTI crude oil prices. While some news reports suggest efforts to calm Middle East war concerns and de-escalation efforts, the underlying tensions remain. Any perceived escalation or new threat to oil supply routes or production facilities can trigger immediate price spikes. The market's sensitivity to news from regions like Qatar (Ras Laffan energy hub) or concerning the broader Iran conflict is exceptionally high. The widening Brent-WTI spread, which hit an 11-year high recently, underscores the market's pricing of regional risk premiums into oil benchmarks.
The recent reports about the Ras Laffan attack, even if past, have dramatically shifted the narrative from a potential gas glut to concerns about broader energy security. This sentiment spills over into the oil market, as traders factor in the possibility of further disruptions. While the US easing of Venezuela sanctions might offer some relief on the supply side, its impact is often overshadowed by the larger geopolitical risks. The market's reaction to these events is often immediate and volatile, making it essential for traders to stay abreast of geopolitical developments. The relationship between geopolitical risk and oil prices is complex, often leading to price spikes that may not always be fully justified by immediate supply-demand fundamentals but reflect a 'fear premium' embedded in the price.
Correlations and Macroeconomic Context
The Dollar's Dance with Crude
The relationship between the US Dollar Index (DXY) and crude oil prices, particularly WTI, is a critical element in understanding market movements. Historically, a strengthening dollar tends to put downward pressure on oil prices, as oil is typically priced in dollars, making it more expensive for holders of other currencies. Last week, the DXY showed mixed signals across different timeframes. On the 1-hour chart, the trend was down with a strength of 91%, while the 4-hour showed a bullish trend at 85%. The daily chart, however, indicated a bullish trend at 92% strength. The DXY closed around 99.25, a level that, according to the daily chart's strong bullish trend, could continue to exert some pressure on dollar-denominated commodities like WTI.
However, the current market scenario seems to be characterized by a decoupling or a more complex interplay. Despite the dollar's potential strength, WTI has surged. This suggests that other factors, primarily supply constraints and geopolitical risks, are currently overriding the typical inverse correlation. The RSI for DXY on the daily chart is 57.21, indicating a healthy upward trend without being excessively overbought. The MACD is positive, supporting the bullish trend. The Stochastic (%K=63.6, %D=75.32) shows a bearish signal as %K is below %D, indicating potential pullback. The ADX at 34.64 confirms a strong uptrend. This mixed picture for the dollar adds another layer of complexity, suggesting that while the dollar might offer some headwinds, the bullish momentum in oil is currently too strong to be significantly deterred.
Equities and Risk Appetite
The performance of major equity indices like the S&P 500 and Nasdaq 100 provides insight into overall market risk appetite. Last week saw a notable downturn in these indices. The S&P 500 closed at 6536.67, down 1.2%, with a strong 100% bearish trend on the daily chart. The Nasdaq 100 also fell significantly, closing at 23986.8, down 1.67%, with a 98% bearish trend on the daily timeframe. This broad risk-off sentiment typically correlates with a flight to safety, which can sometimes benefit commodities perceived as inflation hedges, like gold, but can also dampen demand for riskier assets and potentially impact oil demand if it signals an economic slowdown.
However, the current WTI rally appears to be driven more by specific energy market fundamentals and geopolitical events than by overall market sentiment. While a significant equity market crash could eventually drag down oil prices due to demand destruction fears, the current strength in WTI suggests that specific supply-side narratives are currently dominating. The fact that WTI is rising while equities are falling might indicate a temporary decoupling, where oil is being supported by its own unique drivers rather than broader market risk appetite. This divergence is something traders should monitor closely, as a sustained risk-off environment could eventually impact even fundamentally strong commodities.
Trading Scenarios and Outlook
Given the conflicting signals across different timeframes and indicators, and the strong fundamental backdrop, WTI crude oil presents a complex trading environment. The daily chart shows a very strong uptrend with significant bullish momentum, supported by high ADX values and positive MACD readings. However, the RSI nearing overbought territory and the potential for profit-taking suggest that the rally might face headwinds. The $99.60 resistance level is the immediate hurdle. A decisive break above this level, confirmed by strong volume and sustained positive momentum, could propel prices higher towards $104.37. This scenario would be supported by continued geopolitical tensions or unexpected supply disruptions.
On the downside, the key support level to watch is $91.26. A close below this level on the daily chart would invalidate the current bullish thesis and could signal a more significant correction. This scenario becomes more likely if geopolitical tensions ease significantly, or if macroeconomic data points towards a global economic slowdown, thus reducing demand expectations. The 4-hour chart suggests resistance at $99.79 and support at $94.79. A break below $94.79 could trigger a short-term pullback towards $93.26. The 1-hour chart indicates a tighter range between $97.77 and $99.54, suggesting that the market might be consolidating before the next move. The overbought Stochastic on the 1-hour chart hints at a potential short-term dip.
Bearish Scenario: Profit-Taking Pressure Mounts
45% ProbabilityNeutral Scenario: Consolidation Around Key Levels
30% ProbabilityBullish Scenario: Uptrend Continues
25% ProbabilityThe Road Ahead: What to Watch
Looking ahead, the WTI crude oil market remains highly sensitive to geopolitical developments in the Middle East and official OPEC+ communications regarding production levels. Any hint of de-escalation could lead to profit-taking, while renewed tensions or unexpected supply disruptions could further fuel the rally. Macroeconomic data, particularly inflation and employment figures from major economies, will be critical in assessing global demand trends and influencing central bank policies, which in turn affect the broader market sentiment and the dollar's strength.
Technically, the $99.60 resistance and $91.26 support levels are paramount. A decisive move beyond either of these levels will likely set the tone for the coming weeks. Traders should pay close attention to volume accompanying price movements, as it will be key in confirming the validity of any breakout or breakdown. The divergence between the strong daily trend signals and the overbought conditions on shorter timeframes suggests a cautious approach might be warranted. Patience will be key, waiting for clear confirmation before committing to major positions. The market is clearly showing conviction in the current uptrend, but the potential for sharp reversals in the oil market, especially when influenced by geopolitical factors, cannot be underestimated.
Frequently Asked Questions: WTI Analysis
What happens if WTI breaks above the $99.60 resistance level?
A sustained break above $99.60 on the daily chart would validate the ongoing bullish trend. This could trigger further buying pressure, potentially targeting the next resistance level at $104.37. Confirmation would require strong volume and continued positive momentum indicators.
Should I buy WTI at current levels near $98.39 given the RSI is at 70.58?
Buying at current levels near $98.39 requires caution due to the daily RSI nearing overbought territory at 70.58. While the trend is strong, a pullback is possible. Consider waiting for a consolidation or a pullback towards support levels like $91.26, or confirmation of a decisive break above $99.60.
Is the strong ADX of 59.27 a sell signal for WTI?
An ADX of 59.27 on the daily chart indicates a very strong trend, not necessarily a sell signal in itself. It confirms the conviction behind the current price move. However, such high readings often precede significant trend exhaustion or reversals, so it warrants vigilance rather than immediate selling.
How will upcoming inflation data affect WTI prices this week?
Stronger-than-expected inflation data could boost oil prices by signaling robust economic activity and demand, potentially reinforcing the supply deficit narrative. Conversely, weaker inflation might raise concerns about economic slowdown, dampening oil demand and pressuring prices downwards.
| Indicator | Value | Signal | Interpretation |
|---|---|---|---|
| RSI (14) | 70.58 | Neutral | Approaching overbought territory; watch for pullback |
| MACD Histogram | Positive | Bullish Momentum | Reinforces upward trend |
| Stochastic | K=60.96, D=51.71 | Bullish Crossover | Supports ongoing uptrend |
| ADX | 59.27 | Very Strong Trend | Confirms trend conviction |
| Bollinger | Above Middle Band | Bullish Bias | Price above mean, uptrend |
Track markets in real-time
AI-powered analysis, technical indicators and real-time price data.
Join Our Telegram Channel
Breaking market news, AI analysis and trading signals instantly.
Join Channel