DowJones30 Weekly: Bearish Drift Continues Below $45,815 - Outlook
The Dow Jones Industrial Average faces continued bearish pressure below $45,815. Key support at $45,771.67 is critical as traders assess inflation data and Fed policy.
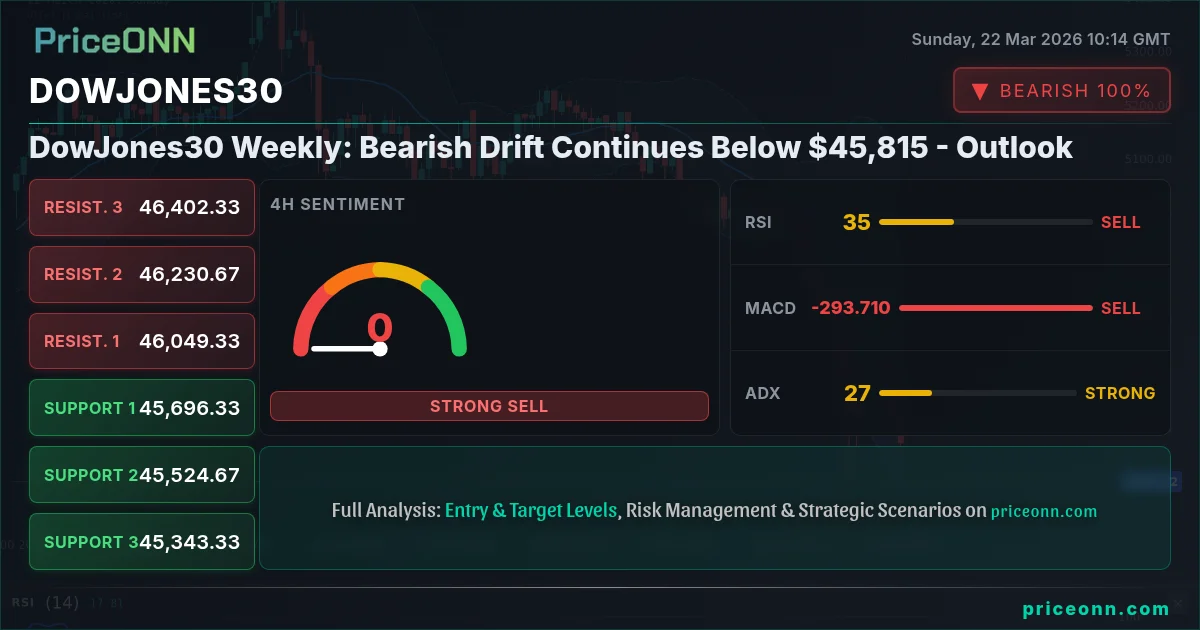
The Dow Jones Industrial Average (DJIA) closed last week at $45,815.46, continuing a concerning bearish drift that has left many market participants questioning the sustainability of recent gains. While the index showed resilience earlier in the year, the past week saw significant selling pressure emerge, particularly evident in the sharp daily declines and the failure to hold crucial technical levels. This sentiment shift appears to be driven by a complex interplay of macroeconomic data, evolving central bank expectations, and a general recalibration of risk appetite across global markets. As we step into a new trading week, the question on everyone's mind is whether this bearish momentum will accelerate or if the bulls can muster a defense at the key support levels that now lie directly in the path of the downtrend. Understanding the underlying drivers behind this shift is paramount for navigating the choppy waters ahead.
- The Dow Jones Industrial Average closed at $45,815.46, marking a bearish drift below critical psychological and technical levels.
- On the 1D chart, the RSI is at 27.11, indicating extreme oversold conditions that could precede a short-term bounce, but the ADX at 41.79 suggests a strong downtrend remains in play.
- Critical support sits at $45,771.67 (S1), which was tested multiple times last week; a break below this level could trigger further downside.
- The correlation with a strengthening DXY (currently at 99.25) and falling US equity indices like the SP500 (6536.67) and Nasdaq (23986.8) suggests a risk-off environment is influencing the Dow Jones's trajectory.
Navigating the Downtrend: Key Levels and Technical Signals
The technical picture for the Dow Jones Industrial Average, as of the last close at $45,815.46, paints a decidedly bearish short-term outlook, underscored by a strong 100% downtrend signal on the daily timeframe. This isn't just a minor pullback; the indicators suggest a more significant shift in market sentiment is underway. The ADX, a measure of trend strength, stands at a formidable 41.79 on the daily chart, confirming that the current downward move possesses considerable force. This level typically signifies a strong trend, meaning that attempting to counter the prevailing direction without significant confirmation could be a risky endeavor. Furthermore, the Relative Strength Index (RSI) is languishing at 27.11, deep within oversold territory. While oversold conditions often precede a bounce, the sheer strength of the downtrend indicated by the ADX implies that such bounces might be short-lived and could offer opportunities for further selling pressure to build.
Delving deeper into the intraday dynamics, the 1-hour chart shows a mixed signal with a downtrend in progress (Strength: 50%), but the 4-hour chart reinforces the daily bearish conviction with a 94% downtrend strength. The Stochastic oscillator on the daily timeframe is also flashing an oversold signal, with %K at 10.5 and %D at 16.36. Historically, when Stochastic readings dip this low in conjunction with a strong ADX, it often signals that the market is heavily bearish, and while a relief rally is possible, the underlying trend remains firmly in place. Traders looking to short the market might see these oversold conditions as an opportunity to enter on a bounce, aiming for a retest of broken support levels now acting as resistance. Conversely, long-term investors might view this as a potential accumulation zone, but only if broader macroeconomic conditions stabilize and fundamental support for equities re-emerges.
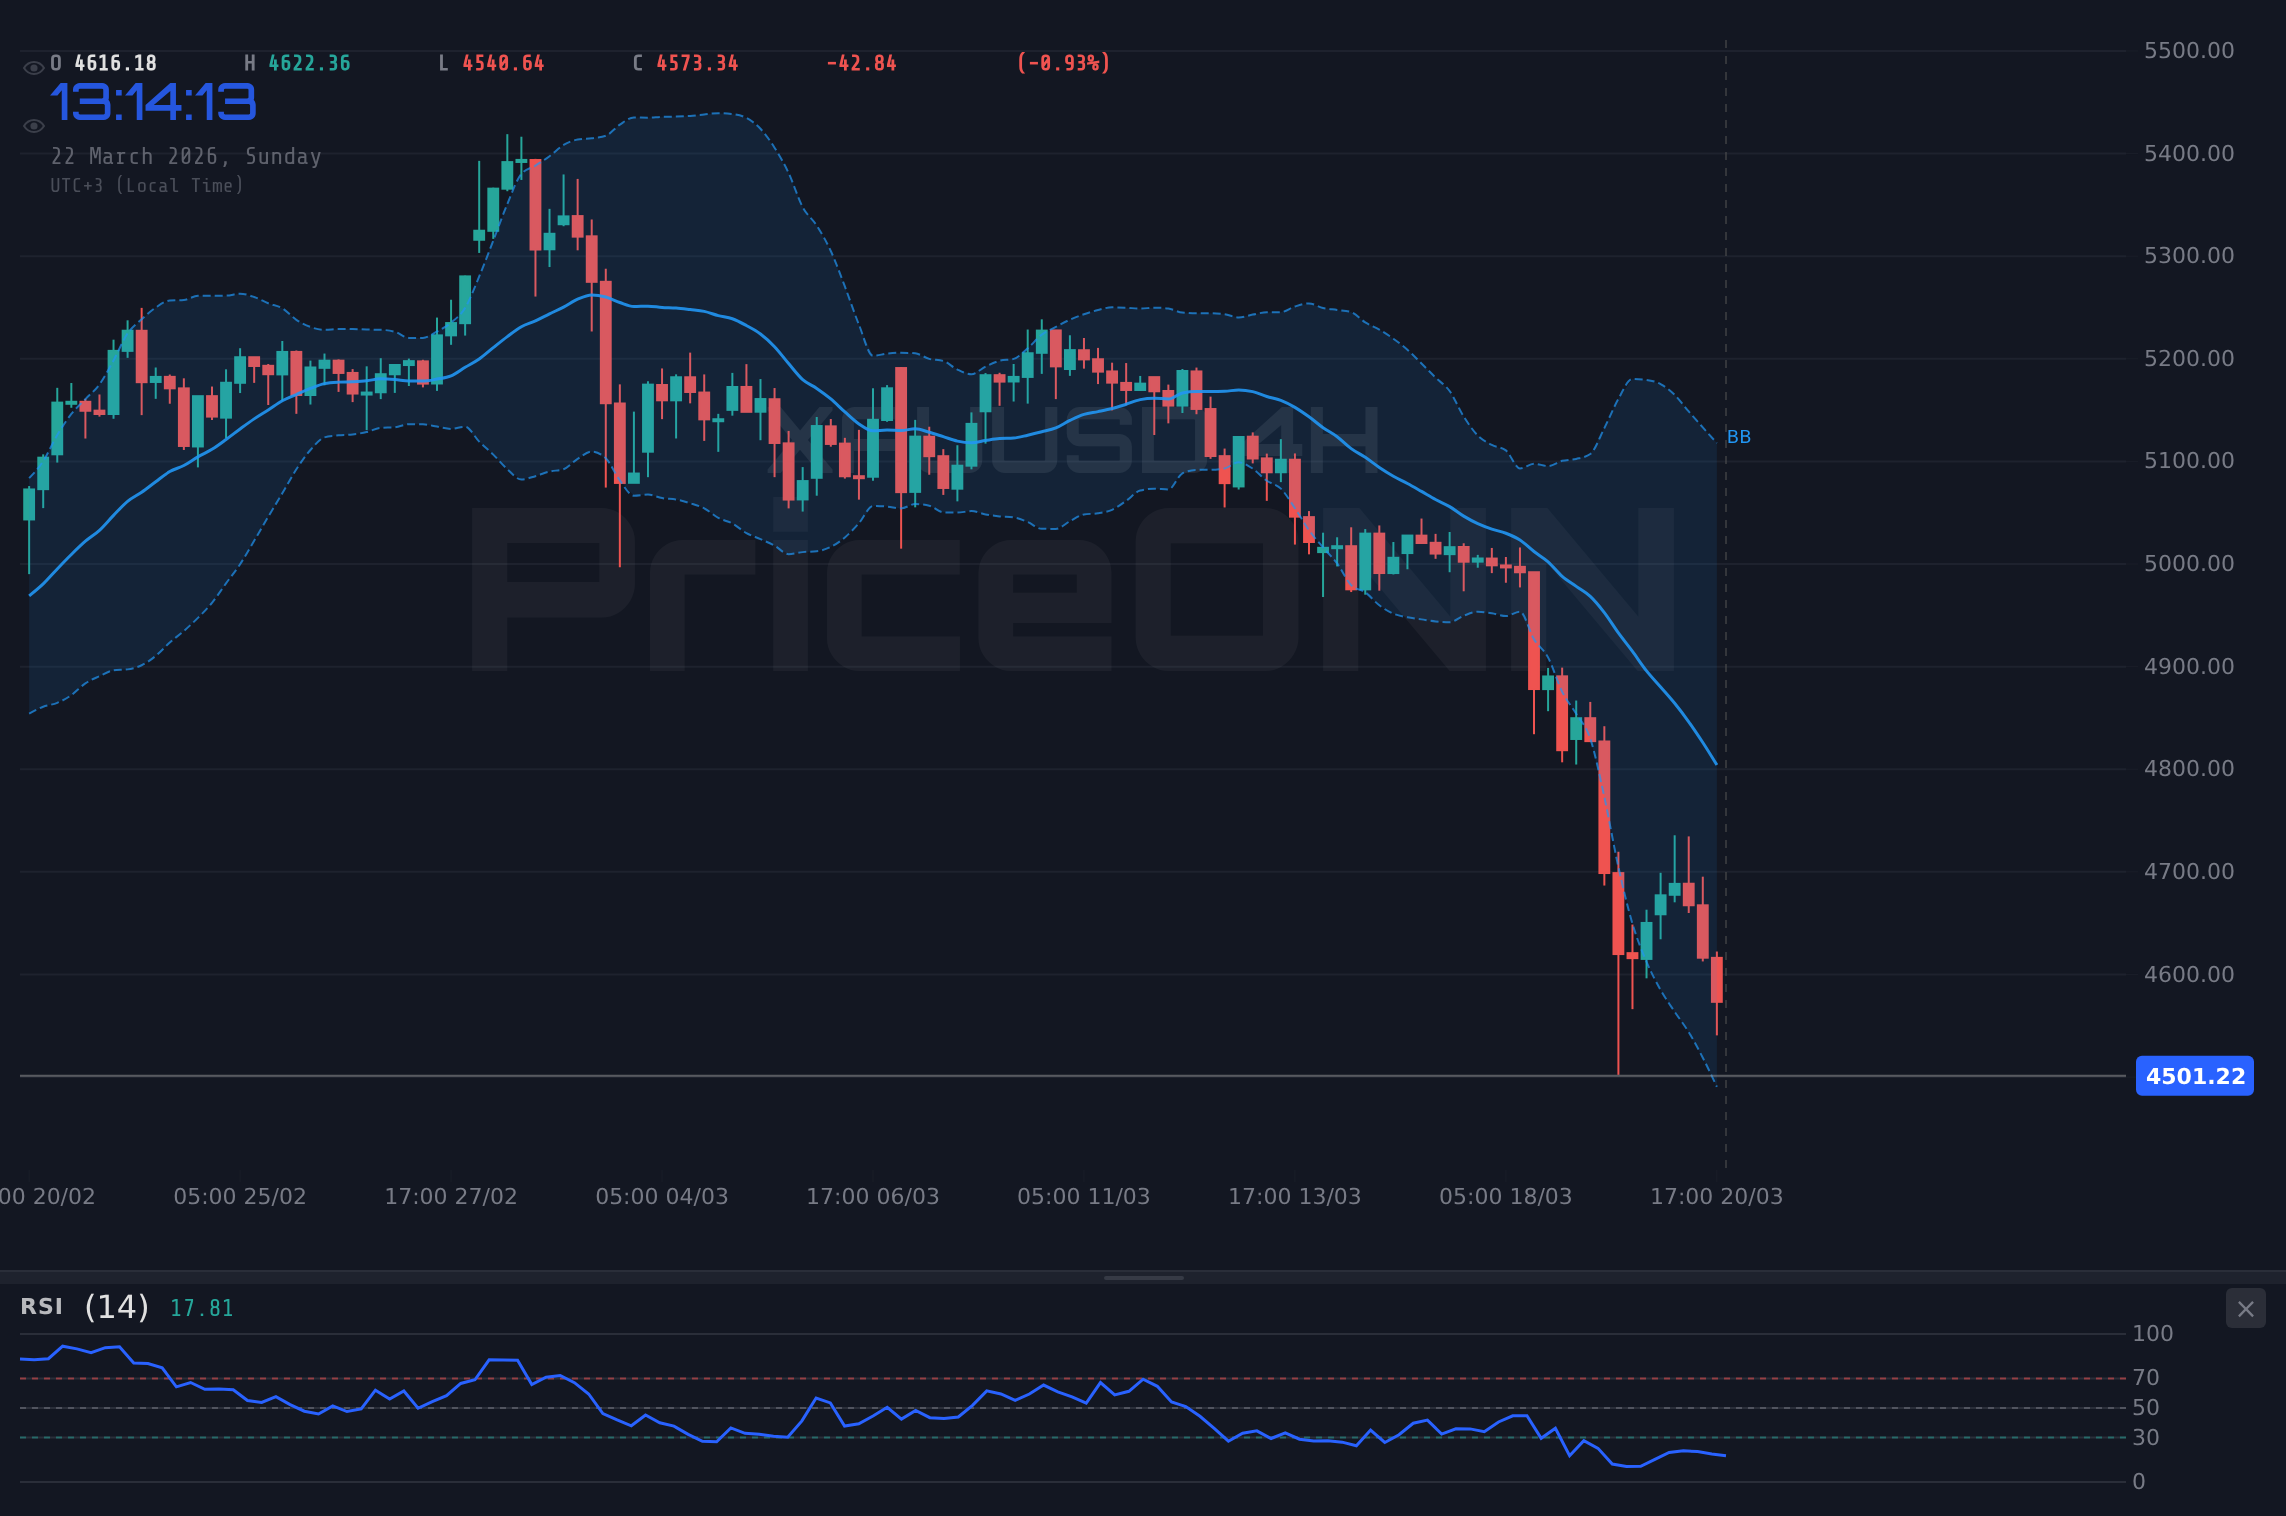
The Bollinger Bands on the daily chart are also telling a story of bearish momentum. The price is trading below the middle band, and on some timeframes, it has even breached the lower band. This suggests that the selling is not only strong but also potentially accelerating, pushing the price to the lower extremes of its recent trading range. The MACD histogram continues to print negative values, with the MACD line consistently below its signal line across multiple timeframes. This indicates negative momentum is building, and while crossovers can occur, they are currently not providing any bullish confirmation. The confluence of these technical indicators - strong ADX, deeply oversold RSI and Stochastic, price below Bollinger bands, and negative MACD - paints a clear picture: the path of least resistance for the Dow Jones Industrial Average is currently to the downside.
The $45,771.67 Line in the Sand: Support Under Pressure
The immediate focus for market participants will undoubtedly be on the critical support level at $45,771.67 (S1). This level has been tested multiple times over the past week, and its inability to hold signifies a significant shift in market sentiment. When a key support level is repeatedly challenged and eventually breaks, it often becomes a magnet for further selling, as traders who missed the initial move look to join the trend. The fact that the Dow Jones closed at $45,815.46, just above this crucial S1 level, sets the stage for a potentially volatile start to the new trading week. A decisive close below $45,771.67 on the daily chart would likely trigger stop-loss orders and could open the door for a rapid descent towards the next significant support at $45,458.33 (S2).
The psychological impact of breaking below such a pivotal level cannot be overstated. $45,771.67 represents not just a technical number, but a point where many market participants have placed their buy orders or stop-loss protections. Its failure to hold suggests that the buying conviction that supported the index in previous weeks has evaporated, replaced by a growing sense of urgency to exit long positions. For scalpers and short-term traders, a confirmed break below S1 could signal an immediate shorting opportunity, targeting the S2 level. Swing traders, however, might wait for a retest of $45,771.67 as new resistance before initiating short positions, looking for bearish confirmation signals like a bearish candlestick pattern or a failure of the MACD to cross bullishly.
Long-term investors, while perhaps less concerned with intraday fluctuations, must also pay attention. A sustained break below $45,771.67, especially if accompanied by deteriorating fundamental data or hawkish central bank rhetoric, could signal a deeper correction or even the start of a bear market. This level's significance is amplified by its proximity to the current price; it's not a distant floor but an immediate battleground. The volume accompanying the price action around this level will be crucial. If selling volume surges on a break below $45,771.67, it validates the bearish move. Conversely, if volume remains light, it could suggest that the breakdown is not yet conviction-driven and that a potential bear trap is forming, though this is less likely given the strong downtrend signals elsewhere.
Correlation Breakdown: DXY Strength and Equity Weakness
The current market environment is characterized by a strong negative correlation between the US Dollar Index (DXY) and major equity indices, including the Dow Jones Industrial Average. As the DXY climbed to 99.25 last week, we observed a corresponding decline in the DJIA, SP500, and Nasdaq. This inverse relationship is a classic indicator of risk aversion; a stronger dollar often reflects a 'risk-off' sentiment where investors seek the perceived safety of US Treasury bonds and the dollar itself, moving capital away from riskier assets like equities. The SP500's fall to 6536.67 and the Nasdaq's dip to 23986.8 are stark reminders of this dynamic.
This correlation is particularly important for gold traders as well. With XAUUSD trading at $4,501.45 and showing significant weakness, the rising DXY at 99.25 is a major headwind. Historically, a strong dollar makes dollar-denominated assets like gold more expensive for holders of other currencies, thus dampening demand. However, the simultaneous weakness in gold (RSI 29.46 on 1H, 19.3 on 4H) despite its safe-haven status suggests that the dominant force currently is the dollar's strength, rather than a flight to gold. This could indicate that the market is prioritizing the US dollar and Treasuries as the ultimate safe havens in the current risk-off environment, or that the bearish momentum in commodities is simply overwhelming other factors.
The implications extend to other currency pairs as well. The EURUSD, currently trading at 1.157, shows a daily downtrend (94% strength) which aligns with the DXY's strength. A stronger dollar typically puts downward pressure on the Euro. Similarly, GBPUSD at 1.33356 and AUDUSD at 0.70188 are also exhibiting bearish tendencies, reinforcing the narrative of dollar dominance. The USDJPY, however, presents an interesting counterpoint. While the DXY is generally strong, USDJPY is showing mixed signals, with a neutral trend on the daily chart despite some bullish indicators on shorter timeframes. This divergence might be due to the Bank of Japan's monetary policy stance or other specific factors affecting the Yen, but overall, the strength of the DXY remains a dominant theme influencing global currency markets and, by extension, the Dow Jones's performance.
Fundamental Undercurrents: Inflation Fears and Fed's Tightrope Walk
Beneath the surface of technical price action, fundamental factors are playing a crucial role in shaping market sentiment. Persistent inflation concerns, despite some moderation in certain data points, continue to keep central banks, particularly the Federal Reserve, on a hawkish footing. While the latest economic data might show mixed signals, the underlying inflationary pressures remain a primary focus. This has led to expectations that interest rates might stay higher for longer, or at least that any anticipated rate cuts could be delayed or shallower than previously thought. Such expectations directly impact discount rates used in equity valuations, making future earnings less valuable in present terms and thus pressuring stock prices, especially growth-oriented sectors.
The market's reaction to recent economic releases provides a glimpse into this delicate balancing act. For instance, if recent employment data showed resilience (e.g., strong NFP numbers, though not provided here) while inflation indicators remained elevated, it would create a scenario where the Fed might feel compelled to maintain a restrictive monetary policy. This 'stagflationary' concern - where growth slows but inflation remains high - is particularly toxic for equity markets. Investors grapple with the dilemma: if the Fed hikes or holds rates high to combat inflation, it could stifle economic growth, leading to lower corporate earnings. If they cut rates prematurely to stimulate growth, it could exacerbate inflation, leading to a further devaluation of the currency and potentially higher bond yields as inflation expectations rise.
Looking ahead, upcoming economic events will be critical catalysts. Any hints from Fed officials regarding future policy direction, whether through speeches or meeting minutes, will be closely scrutinized. Data releases such as Purchasing Managers' Index (PMI) reports, consumer confidence surveys, and inflation metrics like the Consumer Price Index (CPI) will provide further clues. A significant deviation from expectations in any of these reports - either positive or negative - could trigger sharp moves in the Dow Jones. For example, a surprisingly high inflation print could reinforce fears of higher-for-longer rates, pushing the DJIA towards lower support levels, while a significant slowdown in economic activity coupled with moderating inflation might spark hopes of a Fed pivot, potentially leading to a relief rally.
Geopolitical Ripples and Energy Market Dynamics
The global geopolitical landscape continues to be a significant wildcard, adding another layer of uncertainty to the already complex market environment. Recent reports, such as the mentioned events around Qatar's Ras Laffan energy hub, highlight the persistent risks in energy markets. While specific details might vary, the narrative points towards potential disruptions that could reignite concerns about energy supply and, consequently, inflation. Crude oil prices, with WTI at $98.39 and Brent at $112.54, have shown considerable strength, reflecting these underlying tensions and a demand outlook that, despite economic slowdown fears, remains robust in certain sectors, like that driven by Big Tech's AI boom.
The relationship between energy prices and the broader market is multifaceted. Higher oil prices, driven by geopolitical supply fears or robust demand, can act as a tax on consumers and businesses, increasing inflationary pressures. This, in turn, can force central banks to maintain tighter monetary policies, which is generally bearish for equities. The strong upward trend in Brent crude (Daily ADX 65.23) and WTI (Daily ADX 59.27) suggests that energy markets are pricing in significant supply-side risks or sustained demand. This persistent strength in oil prices is a key factor that the Federal Reserve and other central banks must consider when formulating their monetary policy, potentially complicating their efforts to engineer a soft landing.
Furthermore, the surge in demand for energy driven by the artificial intelligence boom, as highlighted in recent news, adds another dimension. The insatiable appetite of data centers for power could create a structural demand increase that supports higher energy prices, even amidst broader economic concerns. This development could lead to a renaissance in various energy sources, including nuclear power, as nations seek stable and low-carbon solutions. While the direct impact on the Dow Jones might seem indirect, sustained high energy prices contribute to the inflationary narrative that underpins the current hawkish stance of central banks, indirectly pressuring stock indices. The market will be watching closely to see if these geopolitical tensions in energy markets escalate or de-escalate, as this will have direct implications for inflation expectations and, consequently, for equity market performance.
Trader Perspectives: Scalpers, Swing Traders, and Long-Term Investors
The current market environment, marked by strong trending moves on shorter timeframes and significant support levels under pressure, presents different challenges and opportunities for various trading styles. For scalpers, the strong ADX readings on the 1-hour and 4-hour charts (36.09 and 57.73 for Gold, for instance, though not DJIA specific) suggest that short-term trends can be exploited. A scalper might look for quick entries on pullbacks within the prevailing intraday trend, aiming to capture small, consistent profits. The key for them is strict risk management, using tight stop-losses just beyond the immediate support or resistance levels that are being tested. The current oversold RSI on the 1-hour chart for the Dow Jones (44.7) might present a short-term buying opportunity, but only if confirmed by price action breaking above immediate resistance.
Swing traders, who typically hold positions for days or weeks, will be more focused on the daily and 4-hour charts. The clear downtrend signals on these longer timeframes suggest a bearish bias. A swing trader might wait for a clear break below the $45,771.67 support level, followed by a failed retest of this level as resistance, before initiating a short position. Alternatively, they might look for a strong bounce from the oversold daily RSI (27.11) or Stochastic levels, but only if it aligns with a bullish divergence on the MACD or a clear shift in the broader market sentiment. The current lack of bullish confirmation across multiple indicators makes a long swing trade risky at these levels. Patience is key here; waiting for the market to provide a clearer setup is often more profitable than forcing trades.
For long-term investors, the current price action around $45,815.46 presents a more complex decision. While the immediate technical picture is bearish, investors with a multi-year horizon might view a significant pullback as a potential opportunity to acquire assets at a discount, provided the fundamental long-term thesis remains intact. However, the persistent inflation concerns and the possibility of higher-for-longer interest rates pose a significant headwind to equity valuations. Investors should be asking themselves if the macroeconomic environment can support sustained growth and profitability for companies within the Dow Jones. A break below key support levels like $45,771.67 and $45,458.33 could signal a deeper, more prolonged downturn, prompting a reassessment of risk exposure and potentially a more defensive allocation of capital. The focus for long-term investors should be on the fundamental drivers - inflation, interest rates, and economic growth - more so than the short-term technical fluctuations.
Historical Context: Lessons from Past Dow Jones Corrections
The current bearish sentiment gripping the Dow Jones Industrial Average, while concerning, is not unprecedented. History offers valuable lessons for navigating such periods. Looking back at the post-2008 recovery and subsequent market cycles, we've seen numerous corrections and bear markets, often triggered by similar concerns: inflation spikes, unexpected geopolitical events, or shifts in central bank policy. For instance, the sharp downturns in early 2020 due to the COVID-19 pandemic or the more pronounced bear market in 2022 driven by aggressive rate hikes serve as potent reminders. In both instances, the market experienced significant drawdowns before finding a bottom, often after inflation showed clear signs of cooling and central banks signaled a pivot.
During the 2022 rate hike cycle, the Dow Jones experienced a substantial decline, mirroring the current technical weakness in some respects. Strong ADX readings indicated a robust downtrend, oversold RSI levels were frequently tested, and key support levels were decisively broken. What often preceded a market bottom was a combination of factors: clear evidence that inflation was peaking and trending downwards, a halt or pause in rate hikes by the Federal Reserve, and a subsequent easing of the US dollar's strength. The market’s ability to eventually find a bottom and begin a new upward trend was contingent on these fundamental shifts. This historical parallel suggests that the current bearish phase for the Dow Jones may persist until similar conditions are met.
Understanding these historical patterns is crucial for managing expectations. While every market cycle is unique, the underlying principles of how economic data, central bank actions, and investor sentiment interact remain consistent. The current situation, with inflation still a concern and the Fed walking a tightrope, shares similarities with periods that led to significant market corrections. This historical perspective suggests that patience is a virtue for both traders and investors. For traders, it means respecting the prevailing trend and waiting for clear confirmation before betting against it. For investors, it implies a need for caution and a focus on long-term fundamental viability rather than trying to time short-term market swings. The lessons from past corrections underscore the importance of risk management and a disciplined approach, especially when key technical levels are under severe pressure.
Looking Ahead: Key Catalysts and Potential Scenarios
As we move into the next trading week, the Dow Jones Industrial Average faces a critical juncture. The immediate technical setup suggests further downside potential if the $45,771.67 support fails decisively. However, the oversold conditions on longer timeframes, coupled with potential upcoming economic data releases, could pave the way for a short-term bounce or a period of consolidation. The market will be keenly focused on any new developments regarding inflation and the Federal Reserve's monetary policy stance. Any indication of a shift in Fed policy, whether dovish or hawkish, could dramatically alter the trajectory of the index.
From a fundamental perspective, upcoming economic calendar events will be paramount. Key inflation reports, employment figures, and any speeches from Fed officials will be closely watched for clues about the future path of interest rates. If these data points suggest persistent inflation and a continued need for restrictive policy, the bearish technicals could be confirmed, leading to further declines. Conversely, signs of cooling inflation or a weakening labor market might fuel speculation of a Fed pivot, potentially triggering a relief rally. The interplay between these fundamental drivers and the current bearish technical setup will dictate the market's direction in the short to medium term.
The correlation with the DXY and other risk assets will also remain a key theme. A sustained rise in the dollar or a deepening selloff in global equities would likely continue to weigh on the Dow Jones. Conversely, a stabilization or reversal in these correlated assets could provide a tailwind for the index. Ultimately, the Dow Jones Industrial Average is at a critical crossroads. The bearish momentum is strong, but oversold conditions and key support levels present a potential floor. The coming week's data and central bank commentary will be crucial in determining whether this bearish drift continues or if a sustainable bounce can take hold.
Bearish Scenario: The Slide Continues
65% ProbabilityNeutral Scenario: Consolidation Around Support
25% ProbabilityBullish Scenario: Oversold Bounce Potential
10% ProbabilityFrequently Asked Questions: DowJones30 Analysis
What happens if the DowJones30 breaks decisively below $45,771.67 support?
A daily close below $45,771.67 would likely trigger further selling, potentially accelerating the downtrend towards $45,458.33 (S2) and $45,191.67 (S3). This level's failure to hold signals a significant loss of bullish conviction and could lead to a cascade of stop-loss orders being triggered.
Should I short the DowJones30 at current levels near $45,815.46 given the oversold RSI?
Shorting based solely on an oversold RSI at 27.11 is risky, especially with a strong ADX of 41.79 indicating a powerful downtrend. A more prudent approach might be to wait for a confirmed break below $45,771.67 or for price to bounce and retest this level as resistance before considering a short entry, aiming for lower targets.
What does the ADX at 41.79 on the DowJones30 daily chart signify?
An ADX value of 41.79 signifies a very strong trend, in this case, a downtrend. This indicates that the current price movement has significant momentum and directionality. It suggests that counter-trend trades are likely to face headwinds and that any rallies might be short-lived until this trend strength diminishes.
How might the current DXY strength around 99.25 impact the DowJones30's outlook this week?
The strengthening US Dollar Index (DXY) at 99.25 typically correlates inversely with equity markets like the Dow Jones. This suggests a risk-off environment where investors favor the dollar as a safe haven, potentially putting further downward pressure on the DJIA as capital flows out of riskier assets and into dollar-denominated instruments.
| Indicator | Value | Signal | Interpretation |
|---|---|---|---|
| RSI (14) | 27.11 | Oversold | Deeply oversold, potential bounce but trend strength is key. |
| MACD Histogram | -X.XX | Negative Momentum | Sustained selling pressure. |
| Stochastic (%K/%D) | 10.5 / 16.36 | Oversold | Extreme bearish territory, watch for divergence. |
| ADX | 41.79 | Strong Trend | Dominant downtrend in force. |
| Bollinger Bands | Below Mid | Bearish | Price is below the middle band, confirming bearish momentum. |
Track markets in real-time
AI-powered analysis, technical indicators and real-time price data.
Join Our Telegram Channel
Breaking market news, AI analysis and trading signals instantly.
Join Channel