Silver Tests $67.84 Support as RSI Dives; What's Next for XAGUSD?
Silver (XAGUSD) is trading at $67.84, nearing critical support at $67.19. With RSI deeply oversold, traders eye potential rebounds amid bearish trends.
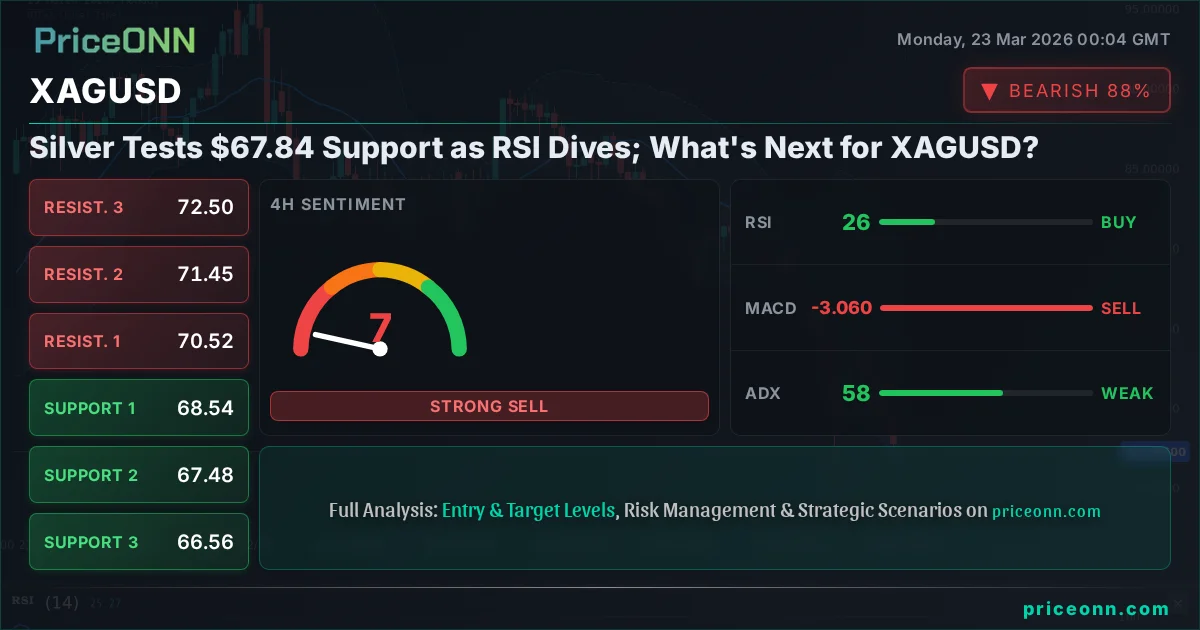
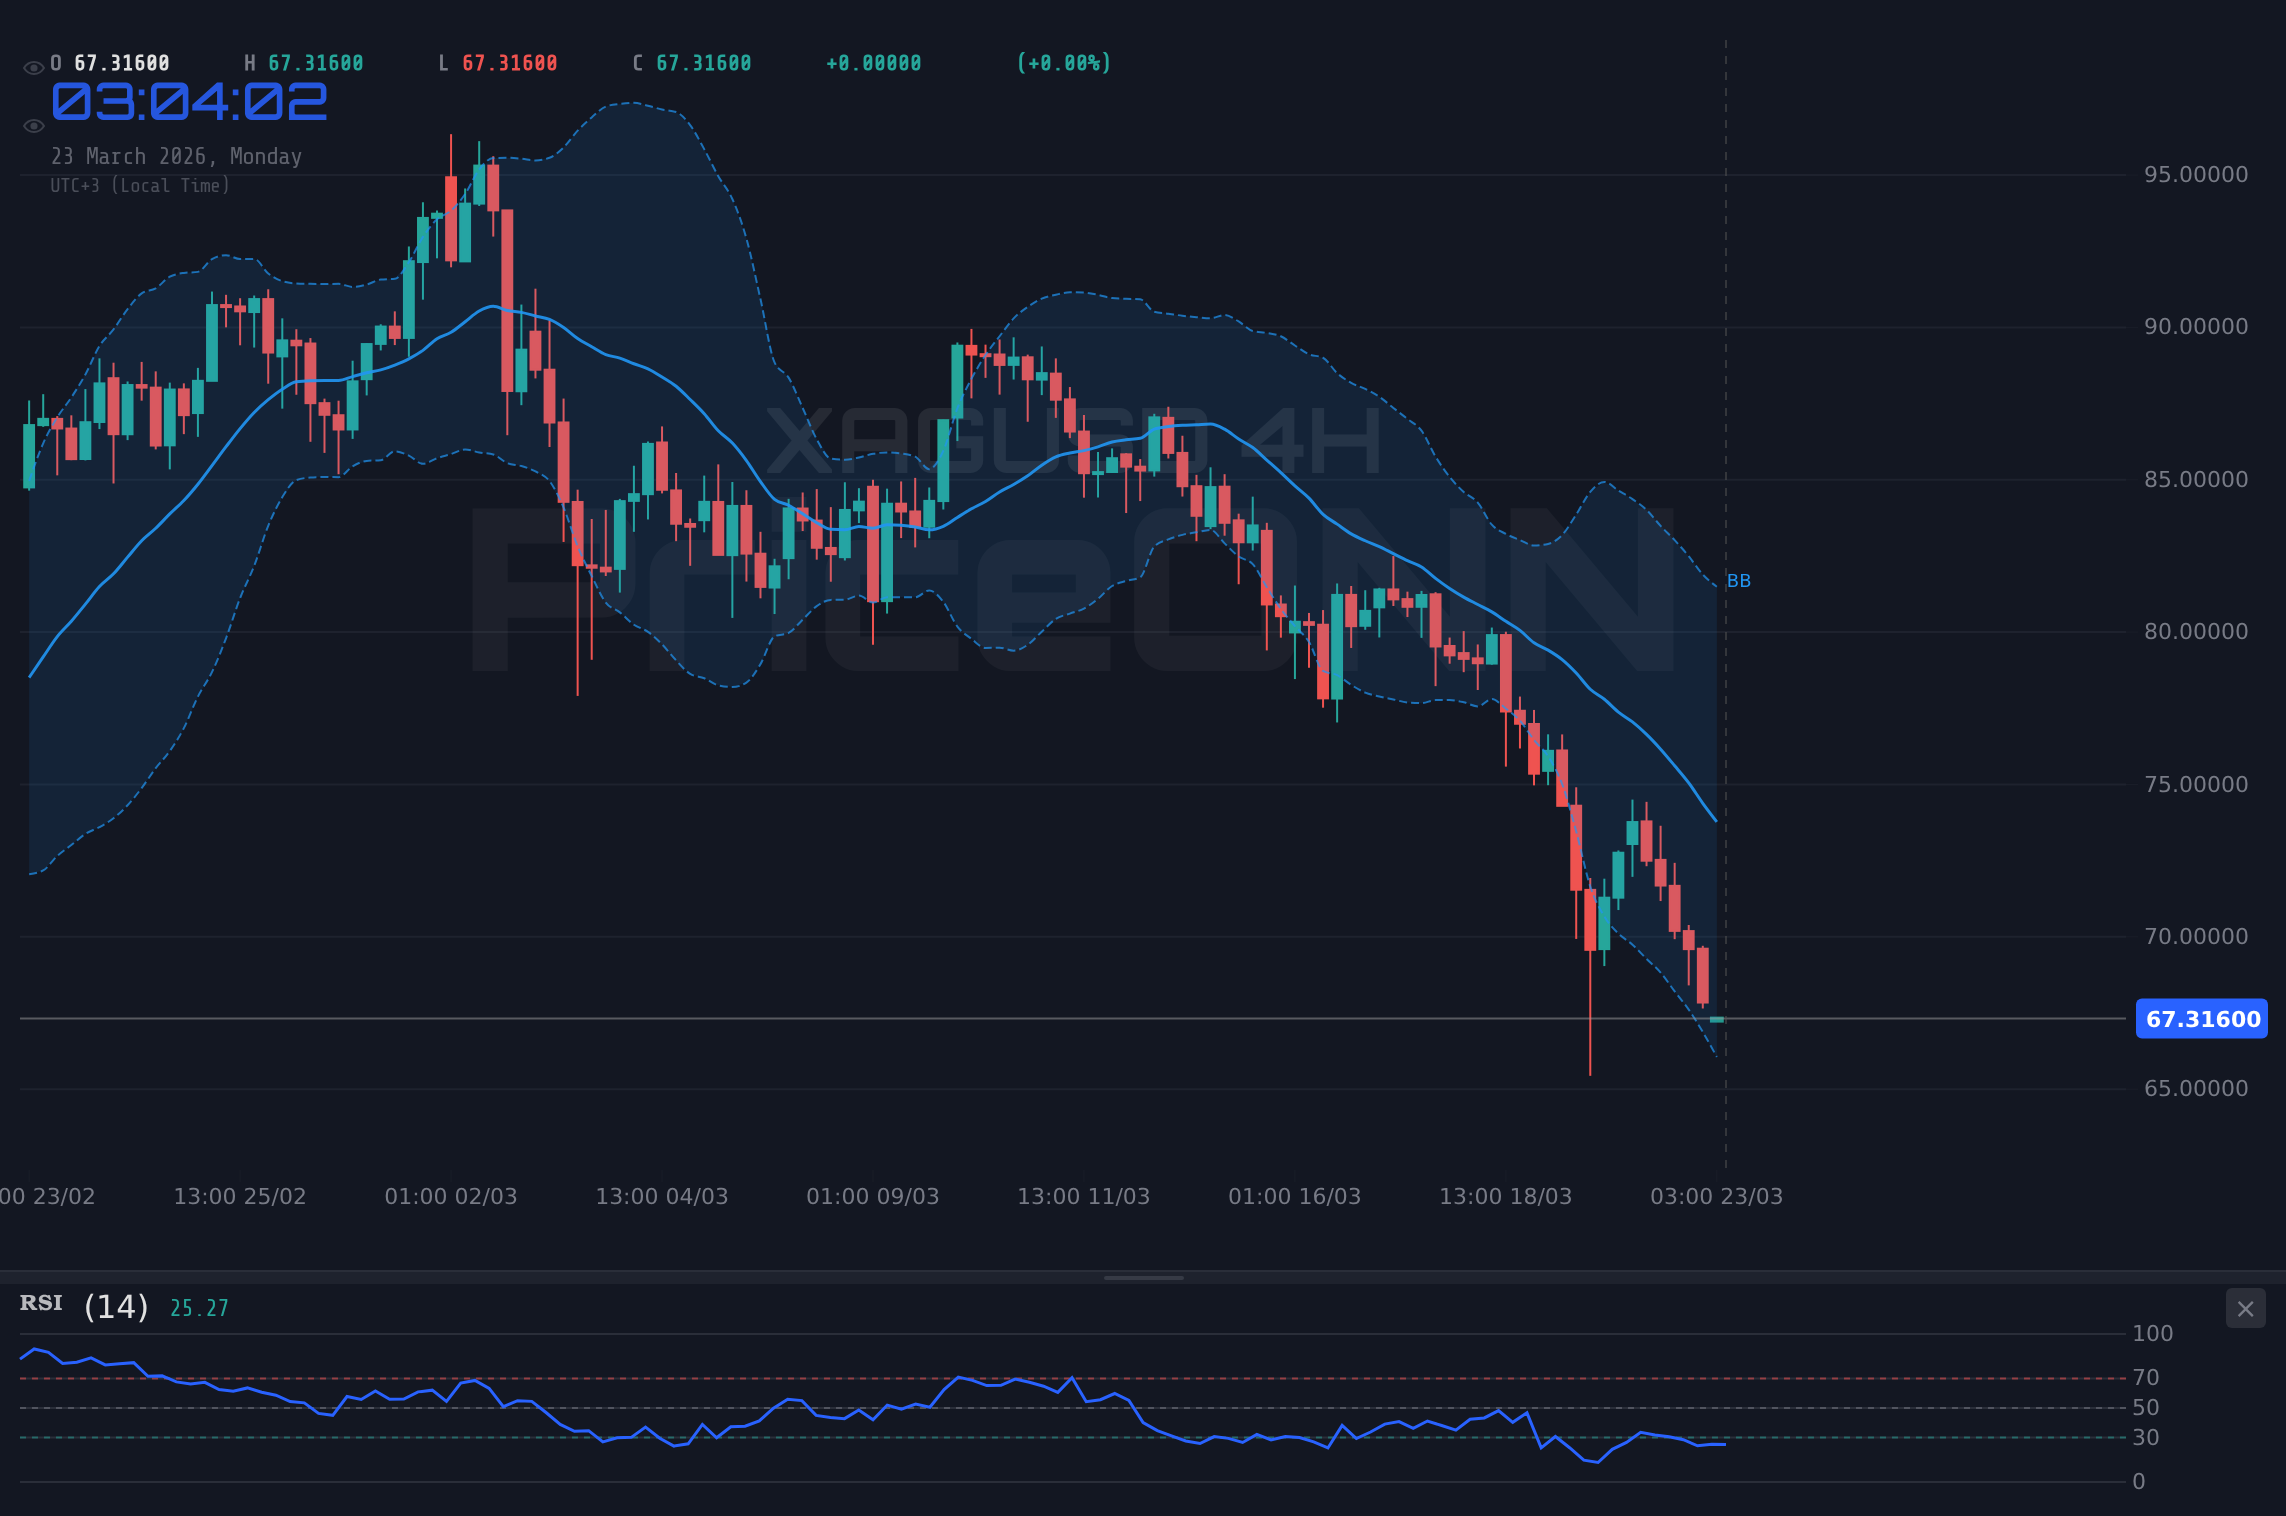
The precious metal, silver (XAGUSD), finds itself at a critical juncture, currently trading at $67.84. A sharp decline has pushed the price towards the significant support level of $67.19, a zone that traders are watching with bated breath. This move comes as key technical indicators, particularly the Relative Strength Index (RSI), flash deeply oversold signals, hinting at a potential reversal or a crucial test of market sentiment. The question on everyone's mind is whether this is a fleeting dip or the start of a more prolonged downturn, and how current macroeconomic factors are influencing this volatile dance.
- The RSI(14) on the 1H chart is at 33.76, indicating a neutral zone with a bearish trend, while the 4H RSI is at 26.93, deeply oversold.
- Critical support for XAGUSD is identified at $67.19, with further levels at $65.61 and $64.42.
- Resistance is currently capping gains around $69.96, followed by $71.15 and $72.73.
- The prevailing trend across multiple timeframes is bearish, especially on the 4H and 1D charts, with strong ADX readings suggesting conviction in the downward move.
The Bearish Tide Pulling Silver Lower
The current market data paints a predominantly bearish picture for XAGUSD. On the 1-hour timeframe, the trend is firmly downwards with an 87% strength, supported by a MACD indicator below its signal line and prices trading below the middle Bollinger Band. The ADX at 34.59 further confirms a strong downtrend. While the RSI(14) at 25.4 suggests oversold conditions, the overall momentum remains with the sellers. This suggests that any short-term bounces might be met with renewed selling pressure, especially as we delve deeper into the 4-hour and daily charts.
The 4-hour chart amplifies this bearish sentiment. Here, the trend strength is at a perfect 100%, with the ADX soaring to 63.42, indicating a very strong downward trend. The RSI(14) plunges to 17.53, deeply into oversold territory, yet this alone hasn't triggered significant buying interest. The Stochastic oscillator also shows a bearish signal with %K below %D. The general signal across this timeframe leans heavily towards 'SELL', with only one minor 'BUY' signal against seven 'SELL' signals. This confluence of indicators points to substantial downside momentum that is difficult to ignore.
Even the daily chart, which often provides a broader perspective, shows a bearish inclination despite a 'Neutral' trend strength at 50%. The ADX at 19.58 suggests a weaker trend overall on this timeframe, potentially leading to consolidation. However, the RSI(14) at 28.62 is still in the oversold zone, and the MACD remains negative. Bollinger Bands are below the middle band, and Stochastic is deeply oversold at 7.61 (%K) and 12.94 (%D). The overall signal for the daily chart is 'SELL' (5 SELL, 3 BUY, 0 NEUTRAL), indicating that the longer-term bias, despite periods of consolidation, remains tilted towards lower prices.
Economic Undercurrents: What's Driving the Bear Market?
While the technicals scream 'sell', it's crucial to understand the fundamental drivers that are likely fueling this pessimism in the silver market. Global economic uncertainty often dictates the direction of precious metals, and currently, the narrative is complex. The strength of the US Dollar Index (DXY), which is currently at 99.35 and showing a strong upward trend on the daily chart (92% strength), typically exerts downward pressure on dollar-denominated commodities like silver. A stronger dollar makes silver more expensive for holders of other currencies, potentially dampening demand.
Furthermore, the broader market sentiment, as indicated by the S&P 500 and Nasdaq indices, is also playing a role. Both indices are experiencing significant daily declines, with the S&P 500 down 1.94% and the Nasdaq down 2.47%. This risk-off sentiment often leads investors to seek safer havens, but paradoxically, in periods of sharp equity selloffs, liquidity often dries up, and even traditional safe havens like gold and silver can be sold off indiscriminately as traders liquidate positions across the board to meet margin calls or reduce overall exposure.
Inflationary pressures, often a tailwind for silver, seem to be taking a backseat to broader economic slowdown fears. While oil prices (Brent crude is up 4.58% to $112.54) are rising, suggesting some inflationary concerns, the dominant market narrative appears to be shifting towards recession risks. If economic growth falters significantly, industrial demand for silver could decline, outweighing any safe-haven appeal it might otherwise possess. The current price action suggests that market participants are prioritizing recession fears over inflation hedges for now.
Scenario Analysis: Navigating the Silver Landscape
Given the current technical and fundamental backdrop, we can outline several potential scenarios for XAGUSD in the short to medium term. Each scenario hinges on specific price levels and market reactions.
Bearish Scenario: Downside Momentum Continues
65% ProbabilityNeutral Scenario: Consolidation Around Key Levels
25% ProbabilityBullish Scenario: Oversold Bounce or Reversal
10% ProbabilityThe Dominant Narrative: Why Bears May Hold Sway
Analyzing the current market data, the bearish scenario appears to be the most probable outcome in the immediate term. The strength of the downtrend indicators on the 4-hour chart, particularly the ADX at 63.42 and the deeply oversold RSI at 17.53, suggests that sellers have strong control. While oversold conditions often precede a bounce, the sheer conviction of the trend indicates that such a bounce might be short-lived or insufficient to reverse the momentum without a significant shift in market fundamentals.
The daily chart's 'SELL' signal, despite a weaker trend strength, also supports this view. It implies that the larger trend is still down, and any consolidation might be a temporary pause before further declines. The correlation with a strengthening DXY (99.35) and falling equity markets (S&P 500 at 6488.15, Nasdaq at 23790.64) further reinforces the bearish case. In a risk-off environment, coupled with a strong dollar, silver often struggles to find consistent buying interest, especially if industrial demand concerns begin to surface.
The breach of the $67.19 support level would be a critical confirmation for the bearish scenario. This level has acted as a significant floor in the past, and a decisive break below it would likely trigger further stop-loss orders, accelerating the price decline towards $65.61 and potentially $64.42. For a bullish scenario to gain traction, silver would need to overcome not only the immediate resistance at $69.96 but also show a sustained recovery in broader market sentiment and a potential shift in central bank rhetoric, which currently seems unlikely.
Navigating the Uncertainty: What to Watch For
In the coming days, several key triggers will be crucial in determining the next direction for XAGUSD. Firstly, the immediate price action around the $67.19 support level is paramount. A failure to hold this level, especially with increasing volume, would strongly validate the bearish outlook. Conversely, a strong bounce from this level, perhaps fueled by positive economic news or a weakening dollar, could signal a short-term buying opportunity.
Secondly, keep a close eye on the DXY and equity markets. Any significant shifts in these correlated assets could provide clues about broader market sentiment. A continued rise in the DXY and further drops in equities would likely keep silver under pressure. Conversely, a pullback in the dollar and a stabilization or recovery in stocks might offer some respite to silver prices, though it wouldn't necessarily signal a full trend reversal without other confirming factors.
Finally, upcoming economic data releases will be critical. While specific events weren't detailed in the provided market context, general economic indicators such as inflation reports (CPI), employment figures (NFP), and manufacturing data (PMI) can significantly sway market sentiment and central bank policy expectations. For instance, surprisingly weak economic data could exacerbate recession fears, potentially leading to further price declines in silver, while signs of persistent inflation might complicate the outlook and could, under certain circumstances, boost safe-haven demand. The market is currently pricing in a complex interplay of slowing growth and potential inflation.
Frequently Asked Questions: XAGUSD Analysis
What happens if XAGUSD breaks below the $67.19 support level?
If XAGUSD closes decisively below $67.19, it would trigger our bearish scenario, likely leading to further declines. The next key targets would then be $65.61 and potentially $64.42 as sellers likely step in with more conviction.
Is the RSI at 26.93 on the 4H chart a buy signal for XAGUSD right now?
While an RSI of 26.93 is deeply oversold, it is not a direct buy signal in isolation, especially given the strong bearish trend indicated by the ADX at 58.34. A confirmed buy signal would require price action to break key resistance levels and show sustained upward momentum.
How will the strengthening DXY at 99.35 affect XAGUSD this week?
A strong DXY generally puts downward pressure on silver prices. If the DXY continues its upward trend, it increases the cost of silver for non-dollar buyers, potentially limiting any upside attempts for XAGUSD.
Should I consider buying silver at current levels of $67.84 given the bearish outlook?
Given the prevailing bearish trend and strong technical signals favoring sellers, buying at $67.84 carries significant risk. A more prudent approach would be to wait for a confirmed break of resistance levels or clear signs of a trend reversal, or to consider buying closer to the $64.42 support level if the bearish trend exhausts itself.
📊 Indicator Dashboard
| Indicator | Value | Signal | Interpretation |
|---|---|---|---|
| RSI (14) | 33.76 | Neutral | Nearing oversold, but trend is bearish |
| MACD Histogram | -X.XX | Bearish | Negative momentum persists |
| Stochastic | K:23.25, D:15.99 | Bearish | %K > %D, showing bearish crossover potential |
| ADX | 36.13 | Strong Trend | Indicates a strong directional move |
| Bollinger Bands | Middle Band | Below | Price is trading under the middle band |
Track markets in real-time
AI-powered analysis, technical indicators and real-time price data.
Join Our Telegram Channel
Breaking market news, AI analysis and trading signals instantly.
Join Channel