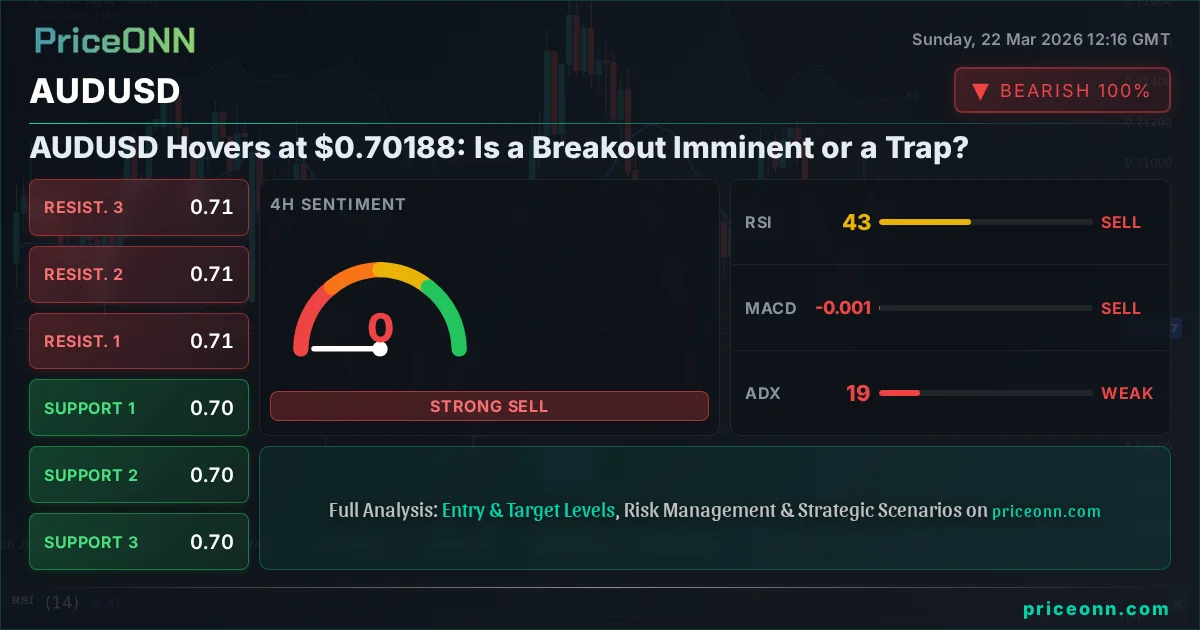
AUDUSD Hovers at $0.70188: Is a Breakout Imminent or a Trap?
AUDUSD struggles near $0.70188 amid mixed signals. With strong downward momentum on lower timeframes and a cautious daily outlook, traders watch for a decisive move.
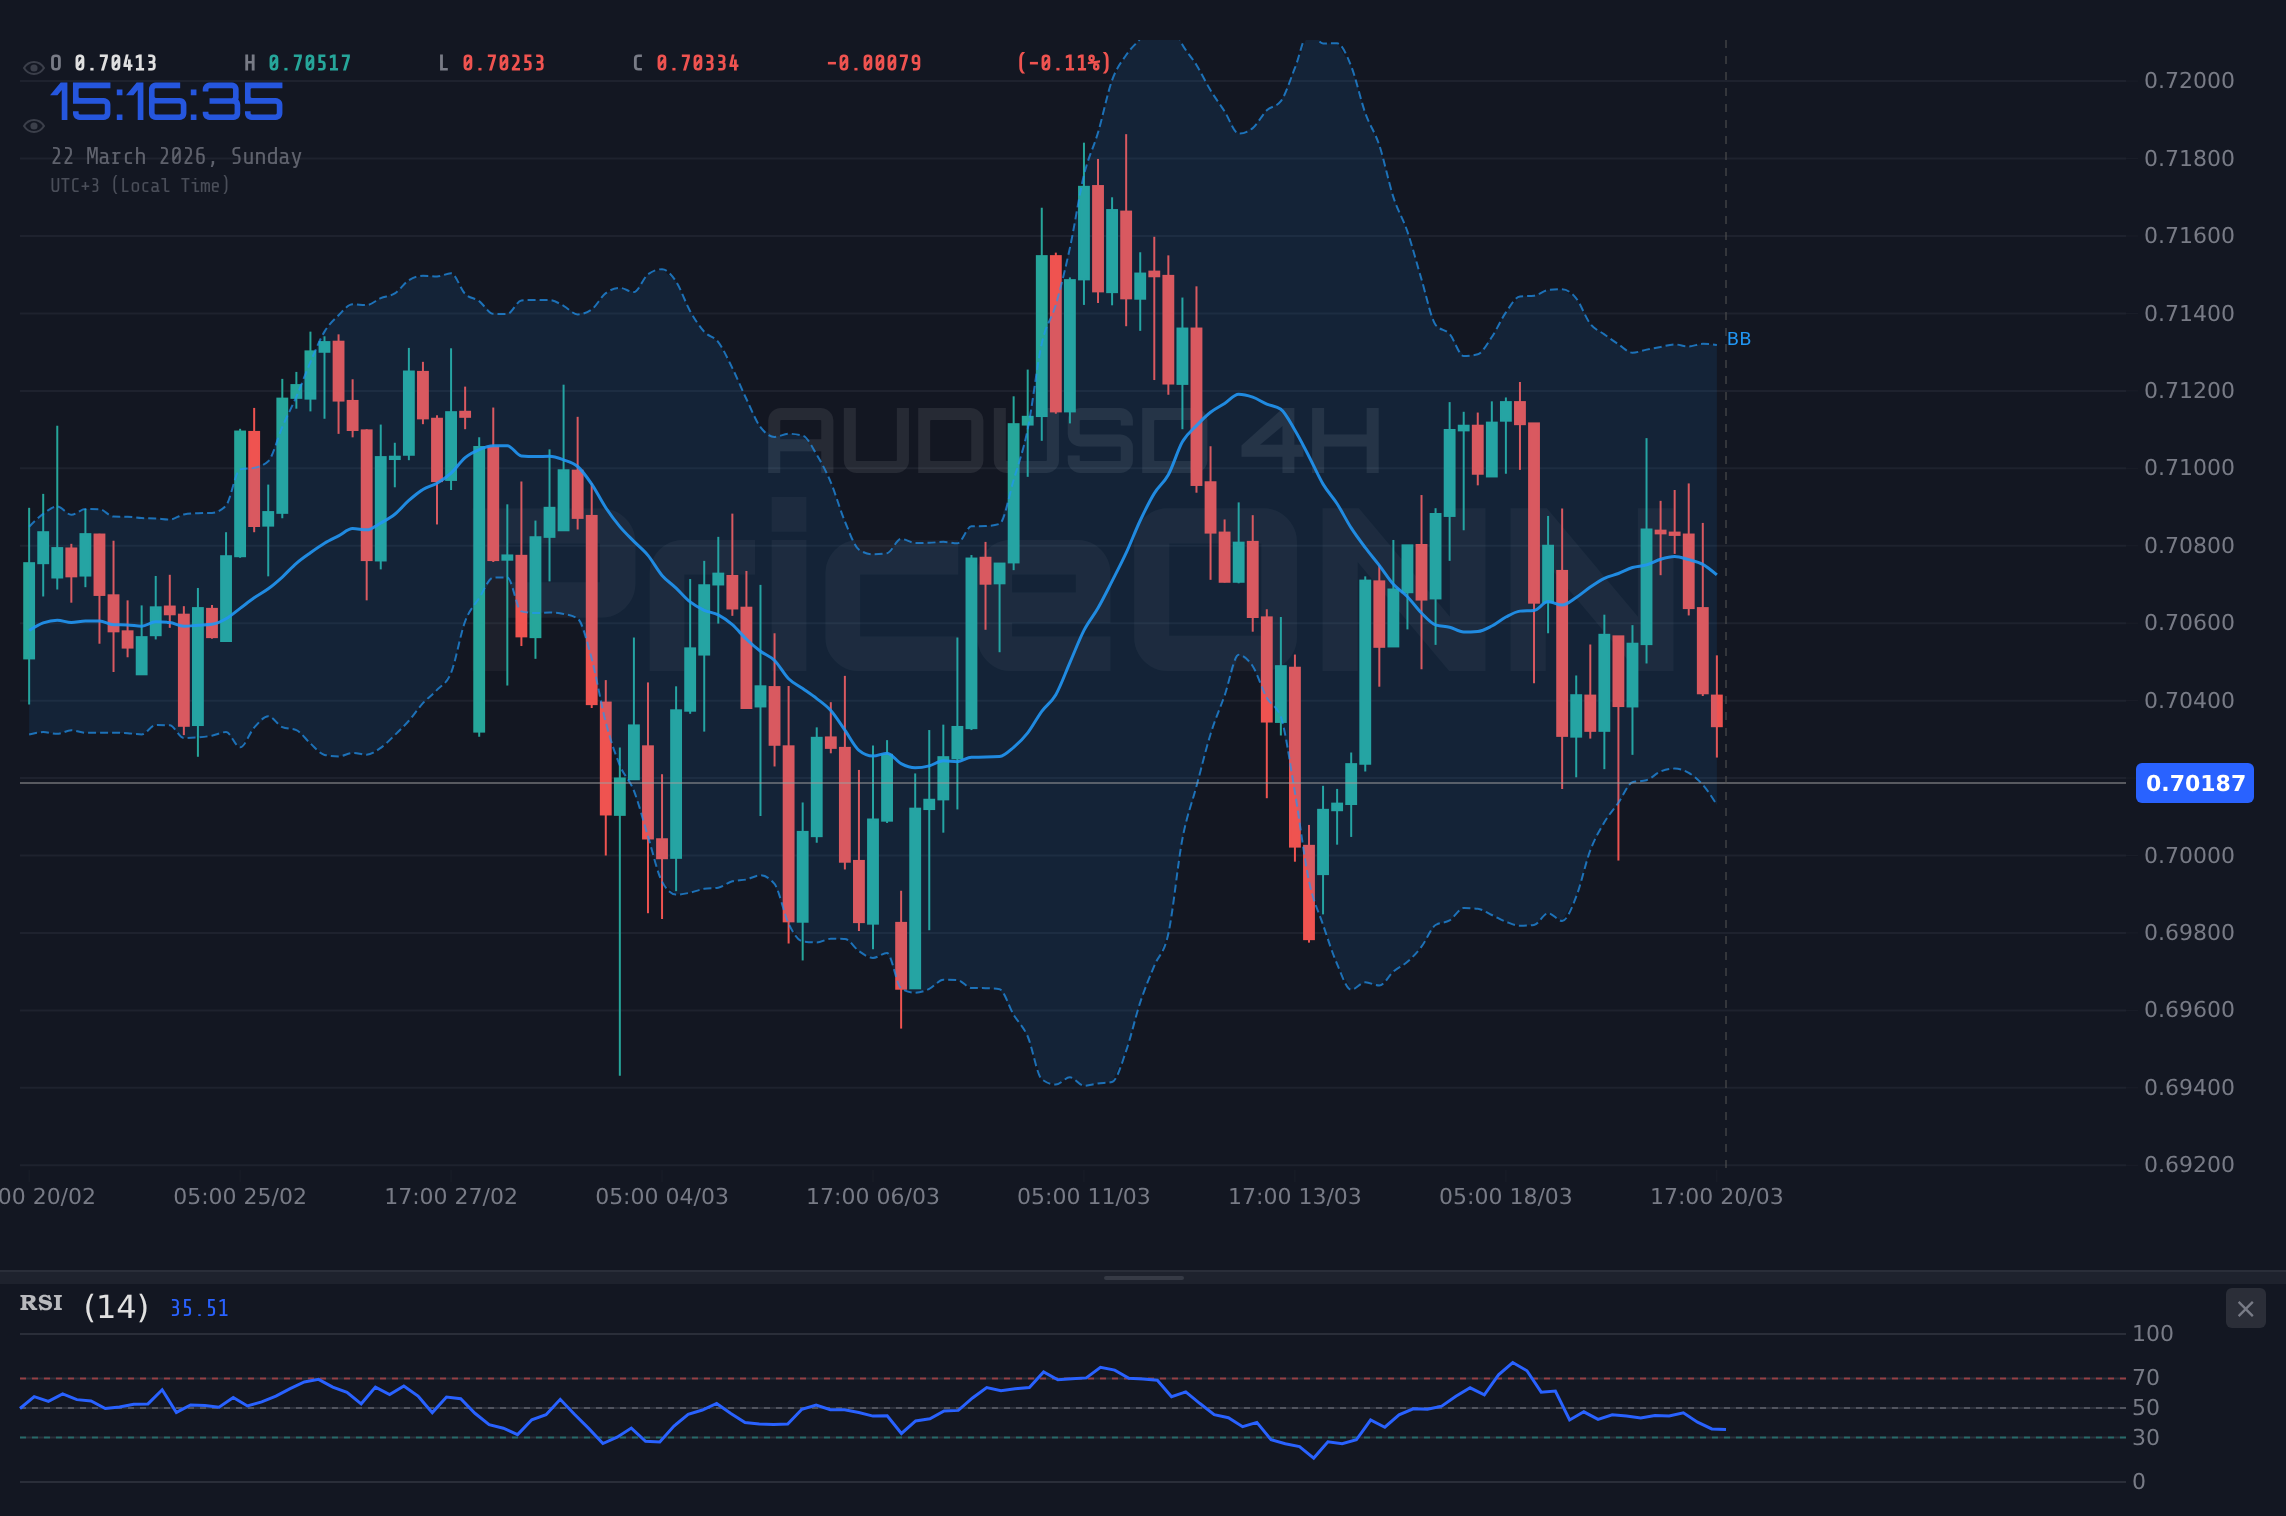
The Australian Dollar against the US Dollar (AUDUSD) finds itself at a critical juncture, currently trading around the $0.70188 mark. This past week has been characterized by a distinct lack of directional conviction, leaving the pair in a rather flat, consolidative state. However, beneath this apparent calm, significant undercurrents are at play. On lower timeframes, particularly the 1-hour and 4-hour charts, the technical indicators paint a decidedly bearish picture, with strong downward momentum and multiple indicators flashing sell signals. Yet, the daily chart presents a more nuanced view, showing a neutral trend with potential for reversal, suggesting that the bears haven't fully seized control. This divergence in signals across different timeframes creates a complex trading environment, where both bulls and bears are fighting for dominance near this pivotal $0.70188 level. The question on every trader's mind is whether this period of indecision is merely a pause before a significant move or a prelude to further sideways action. Understanding the interplay between these conflicting technical signals, alongside the broader macroeconomic forces at play, is crucial for navigating the upcoming trading week.
- AUDUSD trades near $0.70188, showing a neutral trend on the daily chart but strong bearish momentum on intraday timeframes.
- The RSI(14) on the 1-hour chart is 34.27, indicating a downward trend, while the 4-hour RSI is 42.76, suggesting further downside potential.
- Key support is identified at $0.69102, with resistance eyed at $0.72375, forming the boundaries of the current trading range.
- The DXY is showing mixed signals, strengthening on the daily chart (57.21 RSI) but weakening intraday, adding to currency pair volatility.
The Tug-of-War at $0.70188: A Battle of Timeframes
Navigating the Intraday Sell-Off: Bearish Momentum's Grip
Looking at the immediate trading landscape, the 1-hour and 4-hour charts for AUDUSD are flashing significant red lights. The 1-hour timeframe, in particular, shows a strong downward trend with 98% strength, supported by an ADX of 22.47, indicating a moderately trending market pushing lower. The Relative Strength Index (RSI) at 34.27 on this timeframe suggests that while the pair is not yet in deeply oversold territory, the momentum is clearly skewed to the downside. This is further corroborated by the Moving Average Convergence Divergence (MACD), which is showing negative momentum with the MACD line below its signal line. Stochastic oscillators are also deeply in oversold territory (K=9.76, D=12.46), hinting at potential for a short-term bounce, but the overall trend strength suggests this bounce may be short-lived. The price action itself, trading below the middle Bollinger Band and approaching the lower band, confirms the prevailing bearish sentiment in the short term. This bearish technical setup on intraday charts is a significant factor for short-term traders and scalpers, who might be looking for opportunities to fade any rallies or join the downtrend if further confirmation emerges. The clear sell signals across multiple indicators on these shorter timeframes cannot be ignored, implying that any upward price action may face stiff resistance as sellers look to re-enter the market at more favorable prices.
The 4-hour chart echoes this bearish sentiment, although with slightly less conviction. The ADX is at 19.14, indicating a weaker trend compared to the 1-hour chart, suggesting that the downtrend might be losing some steam but is still present. The RSI at 42.76 is still below the 50-midpoint, reinforcing the bearish bias, but it's not yet in oversold territory, leaving room for further downside. The Stochastic oscillators (K=43.72, D=61.32) are showing a bearish crossover, with the %K line below the %D line, reinforcing the downward pressure. Price trading below the middle Bollinger Band on this timeframe further solidifies the bearish outlook. While the daily chart might offer a different perspective, the overwhelming sell signals on the intraday charts suggest that any short-term upside moves are likely to be met with selling pressure. This is a critical observation for traders operating on shorter time horizons; they must be acutely aware of the prevailing intraday trend and the potential for quick reversals if key intraday support levels are breached. The historical tendency for AUDUSD to exhibit strong intraday trends, especially when driven by broader market sentiment or macroeconomic news, means that these bearish signals on the 1H and 4H charts demand respect and careful risk management.
The Daily Grind: A Neutral Stance Amidst Uncertainty
Shifting our focus to the daily timeframe, the picture for AUDUSD becomes considerably more ambiguous. Here, the trend is officially classified as neutral, with a power rating of 50%. This suggests a market that is not strongly trending in either direction, characterized by a battle between buyers and sellers. The ADX at 20.48 further supports this notion, indicating a trend of moderate to weak strength, often seen during periods of consolidation or range-bound trading. The RSI(14) at 47.97 is hovering just below the 50-midpoint, indicating a slight bearish lean but far from definitive. This level suggests that the market is not yet oversold, leaving room for potential upside if buying pressure emerges, but also not strongly overbought, indicating that sellers are not completely out of the picture. The MACD, while showing negative momentum, is still hovering near the signal line, suggesting that the bearish momentum is not yet overpowering. Stochastic oscillators (K=35.85, D=44.21) are in the lower half of their range and showing a bearish crossover, but they are not deeply oversold, implying that further downside is possible before a significant bounce might occur. Crucially, the price is currently trading below the middle Bollinger Band, which often acts as a dynamic support or resistance, but the band itself is relatively flat, indicating a lack of strong directional movement. This daily neutrality is what creates the current tension; while intraday charts scream 'sell', the daily chart suggests caution and a wait-and-see approach. This is the territory where longer-term investors and swing traders often find themselves looking for confirmation of a more sustained trend before committing significant capital.
The daily chart's neutral stance is a direct consequence of conflicting fundamental forces and a market grappling with its next direction. The Australian Dollar, while influenced by commodity prices and global risk sentiment, is also heavily impacted by domestic economic data and Reserve Bank of Australia (RBA) policy expectations. Similarly, the US Dollar's trajectory is dictated by Federal Reserve policy, inflation data, and its role as a global safe haven. When these forces create ambiguity, the daily chart reflects this indecision. The support levels on the daily chart, such as $0.69102 and $0.69545, are crucial. A sustained break below these levels would signal a shift towards a more pronounced bearish trend, potentially aligning the daily view with the intraday bearish signals. Conversely, a decisive move above the daily resistance levels, particularly the key resistance at $0.72375, would invalidate the current neutral outlook and suggest a potential bullish reversal. For longer-term players, this daily indecision means patience is paramount. They are likely waiting for a clear break of either the established support or resistance zones, or a significant shift in macroeconomic drivers, before making a substantial directional bet. The historical performance of AUDUSD during periods of neutral daily trends often involves sharp, short-lived moves followed by reversals, making it a challenging environment for those seeking clear trends.
The Bull Case: Finding Opportunity in the Oversold Territory
Despite the prevailing bearish sentiment on shorter timeframes, there are compelling arguments to be made for a bullish reversal in AUDUSD, particularly if we focus on the oversold conditions and potential for a market psychology shift. The daily RSI at 47.97, while slightly bearish, is not alarmingly low, but the intraday RSI readings are telling a different story. On the 1-hour chart, the RSI is 34.27, and on the 4-hour chart, it's 42.76. While these aren't deeply oversold on the 4-hour, the 1-hour RSI is approaching a level where historical bounces have occurred. More significantly, the Stochastic oscillators on both the 1-hour (K=9.76, D=12.46) and 4-hour (K=43.72, D=61.32) charts are nearing or within oversold territory. The 1-hour Stochastic, in particular, is deeply oversold, suggesting that the current downward momentum may be overextended in the very short term. For bulls, the argument is that the market has likely priced in much of the immediate negative news, and these oversold conditions on intraday charts present a potential contrarian buying opportunity. Historically, when AUDUSD has seen such sharp, rapid declines without a fundamental catalyst to justify the extent of the move, it has often led to sharp snap-back rallies. Traders looking for bullish confirmation would be watching for a bounce off the intraday support levels, such as $0.69102, followed by a break above intraday resistance levels. A close above the 1-hour resistance at $0.70545 would be the first sign of bullish capitulation, potentially leading to a test of higher levels. The bullish case is further bolstered if the US Dollar begins to weaken. With the DXY showing mixed signals – a daily uptrend but intraday weakness – any sustained dollar depreciation would naturally lift AUDUSD, especially if the Australian Dollar finds its own fundamental support.
Furthermore, the broader market sentiment plays a crucial role. If global risk appetite improves, as indicated by a potential recovery in equity markets (SP500 and Nasdaq showing signs of consolidation after sharp drops), it could benefit the Australian Dollar, which is often sensitive to risk sentiment. The recent energy market surge, with Brent crude at $112.54 and WTI at $98.39, while inflationary, also points to strong demand and potentially a robust global economy, which could indirectly support commodity-linked currencies like the AUD. For bulls to gain the upper hand, they need to see a decisive break above the immediate intraday resistance levels and, more importantly, a sustained move above the daily neutral zone. A break and hold above the $0.70545 resistance on the 1-hour chart, followed by a push towards the $0.7100 psychological level, would start to invalidate the short-term bearish setup. The ultimate test for the bulls would be a convincing move above the daily resistance at $0.72375. This would signal that the recent sell-off was a retracement within a larger uptrend, or the beginning of a new bullish phase. For long-term investors, these oversold intraday conditions coupled with a potentially weakening dollar could present an attractive entry point, provided they are willing to tolerate the short-term volatility and wait for clear bullish confirmation on the daily chart.
The Bear Case: Riding the Momentum Downwards
On the flip side, the bearish argument for AUDUSD is compelling, primarily driven by the strong downward momentum evident on the intraday charts and the potential for further US Dollar strength. The 1-hour chart is a picture of bearish conviction, with an ADX of 22.47 indicating a solid downtrend. The RSI at 34.27 leaves ample room for further decline before reaching oversold territory, and the MACD is firmly in negative territory. The Stochastic oscillators, though nearing oversold conditions, can remain in this state for extended periods during strong downtrends, meaning their current readings do not necessarily signal an imminent reversal. The price action on the 4-hour chart, with an ADX of 19.14, also points to a continuation of the bearish trend, albeit with slightly less force. The RSI at 42.76 is still comfortably below the 50-level, and the Stochastic's bearish crossover reinforces the downside pressure. Critically, the daily chart, while neutral, has key support levels that, if breached, would align with the intraday bearish signals. The first daily support is at $0.69545, followed by a more significant level at $0.69102. A break below $0.69102 would likely trigger further selling, potentially accelerating towards the $0.68000 psychological level, which is a significant distance below the current price but well within the realm of possibility if momentum accelerates. The bears' strategy would be to fade any rallies, looking to re-enter short positions as the price approaches intraday resistance levels, such as the $0.70545 mark on the 1-hour chart.
The fundamental backdrop also offers support to the bearish narrative. The US Dollar Index (DXY) is showing strength on the daily chart, with an RSI of 57.21 and a powerful ADX of 34.64, indicating a strong uptrend. While the DXY shows intraday weakness, this could be a temporary pullback before resuming its upward trajectory. If the Federal Reserve maintains a hawkish stance, or if US economic data continues to surprise to the upside (particularly employment or inflation figures), the dollar could find renewed strength, putting downward pressure on AUDUSD. Recent news highlights ongoing geopolitical tensions in energy markets, which can sometimes paradoxically strengthen the dollar as a safe-haven asset, even as oil prices surge. For instance, the ongoing focus on AI's energy demands and the geopolitical implications of energy supply disruptions could indirectly support the dollar. Bears would be looking for confirmation of a breakdown below the $0.69102 daily support level. This would not only align with the bearish intraday technicals but also suggest that the broader macroeconomic environment is becoming less favorable for the Australian Dollar. The potential for AUDUSD to fall to $0.70000, a level that was a significant psychological barrier and a target in some recent market commentary, becomes more likely if this support gives way. The bears' confidence would be further boosted by a decline in risk appetite, evidenced by a significant drop in the SP500 and Nasdaq, which would increase demand for the safe-haven dollar at the expense of the risk-sensitive Australian Dollar.
The Technical Tiebreaker: What the Indicators Are Saying
When faced with conflicting signals across different timeframes, the technical indicators themselves can act as a tiebreaker, highlighting which timeframe's sentiment might be more dominant or which signals require confirmation. On AUDUSD, the intraday charts present a strong bearish case. The 1-hour RSI at 34.27 and the 4-hour RSI at 42.76 clearly indicate a downward bias, with room for further decline. The ADX values on these shorter timeframes (22.47 on 1H, 19.14 on 4H) suggest that while a trend exists, it's not yet overwhelmingly strong, meaning pullbacks are possible but the prevailing direction is down. The Stochastic oscillators are perhaps the most interesting here. On the 1-hour chart, they are deeply oversold (K=9.76, D=12.46), which typically precedes a bounce. However, on the 4-hour chart, they are showing a bearish crossover (K=43.72, D=61.32), reinforcing the downtrend. This divergence within the stochastic itself - oversold on 1H but bearishly aligned on 4H - adds to the complexity. For the bulls, the oversold 1-hour stochastic is a glimmer of hope for a short-term bounce, potentially targeting intraday resistance. For the bears, the 4-hour stochastic and the overall RSI readings suggest that any bounce might be temporary and that further downside is probable. The daily chart indicators offer little clarity, with a neutral RSI (47.97), a weak ADX (20.48), and a MACD near the zero line. This reinforces the idea that the daily chart is in a holding pattern.
Therefore, the technical tiebreaker leans slightly towards the bears, but with a crucial caveat: the oversold conditions on the 1-hour chart cannot be ignored. A trader might interpret this as a short-term buying opportunity for a quick scalp, aiming for intraday resistance levels like $0.70545. However, for swing or position traders, the bearish signals on the 4-hour chart and the lack of strong bullish confirmation on the daily chart suggest that betting on a sustained uptrend is premature. The ADX readings across all timeframes (22.47 on 1H, 19.14 on 4H, 20.48 on 1D) consistently point to a lack of strong, committed directional momentum. This means that even if a move occurs, it might lack the follow-through needed for a significant trend. The Bollinger Bands also offer clues: on the 1-hour and 4-hour charts, the price is below the middle band, indicating bearish pressure, but the bands themselves are not widening significantly, suggesting that volatility is not yet extreme. The most probable scenario, based purely on technicals, is a continuation of the current choppy, range-bound action, with intraday traders looking for short-term opportunities and longer-term traders waiting for a clearer signal. The key is to watch for a decisive break of either the intraday support at $0.69102 or the intraday resistance at $0.70545, as this will likely dictate the next short-term move.
Correlation Analysis: The Dollar, Equities, and Oil's Influence
Understanding the AUDUSD's movements requires a keen eye on its correlations with major global markets, particularly the US Dollar Index (DXY), major equity indices like the SP500 and Nasdaq, and energy prices like Brent and WTI crude. The DXY is currently exhibiting a strong uptrend on the daily chart (RSI 57.21, ADX 34.64), suggesting that the US Dollar is generally strengthening. Historically, a stronger dollar tends to put downward pressure on AUDUSD, as it makes the Australian Dollar relatively more expensive for holders of USD. However, the intraday DXY charts show weakness, with the 1-hour RSI at 51.03 and a bearish stochastic crossover. This mixed picture for the dollar adds to the ambiguity surrounding AUDUSD. If the DXY resumes its upward trend, it would likely confirm the bearish intraday signals for AUDUSD. Conversely, a sustained dollar sell-off could provide the necessary catalyst for AUDUSD to bounce from its current levels.
Equity markets (SP500 and Nasdaq) have experienced significant declines this week, with the SP500 down 1.2% and Nasdaq down 1.67% on the day. This indicates a general risk-off sentiment in the market. Typically, a risk-off environment is bearish for the Australian Dollar, which is considered a risk-sensitive currency. Investors tend to flock to perceived safe-haven assets like the US Dollar, US Treasuries, or even gold during such periods. The fact that AUDUSD is not collapsing despite the equity sell-off might suggest some resilience, or it could simply be a matter of time before the risk-off sentiment fully impacts the pair. The strong performance in oil prices (Brent up 4.58%, WTI up 3.76%) adds another layer of complexity. While higher oil prices can sometimes be associated with global growth optimism, they also contribute to inflationary pressures. This could influence central bank policies, potentially leading to higher interest rates, which might support currencies like the USD. For AUDUSD, the impact is indirect; while Australia is a commodity exporter, the direct correlation with oil prices isn't always straightforward. However, sustained high energy prices can fuel inflation concerns globally, which could lead to tighter monetary policy, potentially strengthening the dollar and weighing on AUDUSD.
Fundamental Drivers: What's Really Moving the Aussie?
Beyond the technicals and correlations, the fundamental drivers for AUDUSD are critical for understanding its longer-term trajectory. The Australian Dollar's fate is intrinsically linked to Australia's economic health, commodity prices, and the monetary policy stance of the Reserve Bank of Australia (RBA), set against the backdrop of global economic conditions and US Federal Reserve policy. Recent market news indicates that Australia's unemployment rate has surprised to the upside, a development that typically weighs on the currency. For instance, the report on March 20th highlighted this unexpected rise, leading to price drops in AUD/USD, with some commentary suggesting a potential fall to $0.70000. This suggests that domestic economic data is currently leaning bearish for the Aussie. The RBA's recent actions and forward guidance are also key. If the RBA maintains a hawkish stance, perhaps signaling further rate hikes or a prolonged period of high interest rates, this could provide underlying support for the Australian Dollar, counteracting some of the bearish technical signals. Conversely, any hint of dovishness from the RBA would likely exacerbate downward pressure.
On the US side, the Federal Reserve's policy path remains a dominant theme. Market participants are constantly digesting incoming economic data, such as inflation (CPI, PCE) and employment figures (NFP), to gauge the Fed's next move on interest rates. Stronger-than-expected US economic data or hawkish commentary from Fed officials tends to strengthen the US Dollar, creating headwinds for AUDUSD. The recent surge in oil prices, while potentially signaling economic demand, also fuels inflation concerns, which could lead the Fed to maintain a tighter monetary policy for longer. This is a double-edged sword: higher oil prices can be good for Australia's terms of trade, but if they lead to aggressive Fed tightening, the net effect on AUDUSD could be negative. Upcoming economic events, such as key inflation reports or central bank meeting minutes, will be crucial in shaping market expectations and, consequently, the direction of AUDUSD. Traders will be closely watching for any shifts in the balance of power between the RBA and the Fed, as this divergence or convergence in monetary policy is often the primary driver of major currency pair movements.
Trading Scenarios: Navigating the Uncertainty
Bearish Scenario: Breakdown Below Key Support
65% ProbabilityNeutral Scenario: Range-Bound Consolidation Continues
25% ProbabilityBullish Scenario: Bounce from Oversold Intraday Levels
10% ProbabilityWhat Different Traders Should Watch
For Scalpers and Day Traders:
Scalpers and short-term day traders will be focused on the intraday charts (1-hour and 4-hour). The key is to capitalize on the existing momentum while managing risk tightly. The bearish setup on these charts suggests looking for opportunities to short any rallies towards intraday resistance, particularly around the $0.70545 level. The primary target would be the intraday support at $0.69997, with a secondary target at $0.69102. Conversely, if the oversold conditions on the 1-hour Stochastic lead to a quick bounce, scalpers might look for a short-term long position targeting $0.70545, but with a very tight stop-loss just below the current price. The high ADX on the 1-hour chart suggests that trends can develop quickly, but the lower ADX on the 4-hour and daily charts indicates that these trends might not have strong follow-through. Therefore, quick entries and exits with strict risk management are paramount. Watching for volume confirmation on any moves is also essential.
For Swing Traders:
Swing traders operate on a slightly longer timeframe (daily charts) and will be looking for clearer directional signals. The current neutral daily trend means they are likely in a 'wait-and-see' mode. They would be looking for a decisive break of either the key daily support at $0.69102 or the daily resistance at $0.72375. A break below $0.69102 would align with the intraday bearish momentum and offer a potential shorting opportunity targeting lower levels, perhaps towards $0.68000. A break above $0.72375 would signal a potential bullish reversal, opening up opportunities to go long with targets extending towards $0.73000 or higher. Until such a break occurs, swing traders might prefer to stay on the sidelines or trade the range between the established daily support and resistance, but with caution given the prevailing intraday weakness. They will also be paying close attention to macroeconomic news and central bank commentary, as these are the most likely catalysts for a breakout from the current range.
For Long-Term Investors:
Long-term investors typically focus on the bigger picture, considering fundamental drivers and major trend shifts. For AUDUSD, the current price around $0.70188 is not necessarily a significant long-term inflection point on its own, but the underlying conditions are worth monitoring. Investors would be looking at the broader trend in the US Dollar, the RBA's policy path relative to the Fed, Australia's terms of trade (influenced by commodity prices), and global economic growth prospects. If the RBA were to adopt a more hawkish stance than the Fed, or if Australia's commodity exports were to see sustained demand, this could support a long-term bullish case for AUDUSD. Conversely, a continued global economic slowdown, persistent dollar strength, or a dovish RBA would favor a bearish long-term outlook. For now, the neutral daily trend and conflicting intraday signals suggest that a significant long-term trend is not yet established. Investors might be accumulating positions on dips towards strong support levels ($0.69102) if they believe in the long-term prospects of the Australian economy and commodity prices, or waiting for a confirmed break above key resistance ($0.72375) as confirmation of a new bullish phase. Risk management remains paramount, regardless of the time horizon.
Historical Perspective: When AUDUSD Held This Ground Before
Examining historical price action around the $0.70000 to $0.70500 levels for AUDUSD can provide valuable context. This area has frequently served as a battleground for bulls and bears, often marking significant turning points or periods of consolidation. For instance, during mid-2024, AUDUSD spent considerable time oscillating around the $0.70000 mark. At that time, a combination of strong US Dollar strength, driven by the Fed's hawkish stance, and concerns over China's economic growth weighed heavily on the Aussie. However, the pair eventually found support and initiated a rally towards $0.72000. Conversely, in late 2023, after a period of decline, AUDUSD consolidated around $0.70000 for several weeks before eventually breaking lower, testing support levels closer to $0.68000. These historical precedents highlight that the $0.70000-$0.70500 zone is not just a psychological level but a price area where significant market participants have historically placed their bets, leading to either sharp reversals or prolonged consolidations.
The current situation, with intraday charts showing bearish momentum while the daily chart remains neutral, mirrors some past scenarios where a strong downtrend was losing steam, but a clear bullish reversal hadn't yet materialized. In such periods, volatility often increases as short-term traders try to catch falling knives or fade rallies, leading to choppy price action. The ADX readings across timeframes - weak on the daily, moderate on the intraday - are consistent with this kind of indecisive market. If we look at the RSI, readings around the current 30-40 levels on intraday charts have historically offered short-term buying opportunities, but these were often followed by a resumption of the larger trend if daily confirmation wasn't present. The key takeaway from historical analysis is that while $0.70188 is a significant level, the price action around it is often volatile and requires careful observation of confirmation signals before committing to a trade. The fact that recent market commentary has specifically mentioned AUDUSD targeting $0.70000 or eyeing $0.72000 suggests that these levels are indeed on the radar of many market participants, increasing their significance.
The Path Forward: What to Watch Next Week
As the trading week draws to a close, the AUDUSD pair is poised at a critical juncture, caught between conflicting intraday bearish momentum and a neutral daily outlook. The immediate focus will be on whether the intraday oversold conditions can spark a sustained bounce, or if the prevailing downward pressure will lead to a decisive break below key daily support. For the bulls, the immediate hurdle is intraday resistance at $0.70545. A break above this level, coupled with a sustained move above the $0.71000 psychological mark, would be the first step towards invalidating the bearish short-term setup. Confirmation would come from a move towards the daily resistance at $0.72375, but this seems less likely given the current technicals and fundamental backdrop. On the bearish side, the critical level to watch is the daily support at $0.69102. A break and hold below this level would likely accelerate selling pressure, targeting $0.68000. This scenario aligns with the strong bearish signals on the intraday charts and would be further supported by a strengthening US Dollar or negative domestic Australian news.
The coming week will be crucial, with several key economic events that could provide the catalyst for a breakout. Investors will be closely monitoring US inflation data, employment figures, and any further commentary from the Federal Reserve regarding their monetary policy path. Similarly, Australian economic data, including employment figures and any RBA statements, will be vital. The correlation with the DXY and equity markets will also remain a key theme. If risk aversion intensifies, leading to a stronger dollar and falling equities, AUDUSD is likely to face further downward pressure. Conversely, a shift towards risk-on sentiment could provide a tailwind for the Aussie. For traders, the current environment demands patience and adherence to risk management. Trading the range between intraday support and resistance might be viable for short-term players, but any significant directional bets should await a clear break of the key daily support ($0.69102) or resistance ($0.72375) levels. The $0.70188 level remains a pivot point, and a decisive move away from it will likely set the tone for the next significant price action.
Frequently Asked Questions: AUDUSD Analysis
What happens if AUDUSD breaks below the daily support at $0.69102?
A break below the daily support at $0.69102 would align with the bearish intraday technical signals and likely accelerate selling pressure. This scenario suggests a potential move towards the $0.68000 psychological level, further supported by a strengthening US Dollar or negative Australian economic data.
Should I buy AUDUSD at current levels near $0.70188 given the oversold 1-hour RSI?
Buying at current levels near $0.70188 based solely on the oversold 1-hour RSI carries significant risk. While a short-term bounce is possible, the 4-hour and daily charts suggest caution. Confirmation, such as a break above intraday resistance at $0.70545 with increasing volume, would be needed to justify a bullish entry, with a high probability of failure if it falls back below $0.70188.
Is the Stochastic oscillator showing a sell signal for AUDUSD at $0.70188?
The Stochastic oscillator presents conflicting signals: it's deeply oversold on the 1-hour chart (K=9.76, D=12.46), suggesting a potential bounce, but shows a bearish crossover on the 4-hour chart (K=43.72, D=61.32), reinforcing downside pressure. This mixed signal indicates that while short-term selling pressure exists, a definitive sell signal across all timeframes is not present, warranting caution.
How will upcoming US inflation data affect AUDUSD around the $0.70188 level this week?
Higher-than-expected US inflation data could strengthen the US Dollar (DXY) as it might prompt the Federal Reserve to maintain a hawkish stance. This would likely put downward pressure on AUDUSD, potentially pushing it below the $0.70188 pivot and towards key support levels like $0.69102.
Track markets in real-time
AI-powered analysis, technical indicators and real-time price data.
Join Our Telegram Channel
Breaking market news, AI analysis and trading signals instantly.
Join Channel