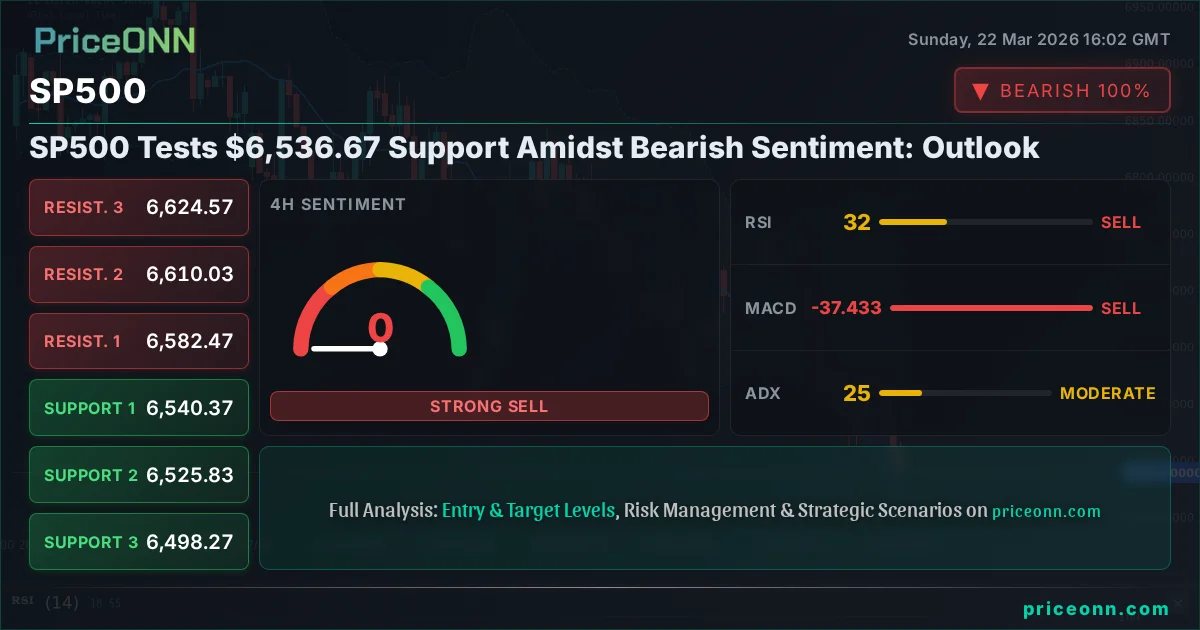
SP500 Tests $6,536.67 Support Amidst Bearish Sentiment: Outlook
The S&P 500 is currently testing the $6,536.67 level. Bears are prevailing as indicators flash sell signals, but crucial support lies ahead. What's next?
The S&P 500 finds itself at a critical juncture, hovering around the $6,536.67 mark as the trading week concludes. The relentless march of the bears has pushed the index lower, painting a predominantly bearish picture across multiple timeframes. With key technical indicators flashing sell signals and broader market sentiment leaning negative, the question on every trader's mind is whether this crucial support level will hold, or if further declines are inevitable. This analysis delves into the current technical landscape, explores the fundamental drivers at play, and assesses the potential scenarios for the week ahead, aiming to decipher the market's next move.
- The S&P 500 is trading at $6,536.67, with the 1-hour RSI at 37.71 indicating bearish momentum is building.
- Critical support levels are identified at $6,491.30 (S1), $6,476.40 (S2), and $6,450.90 (S3), all below the current price.
- The MACD on the 1-hour chart shows negative momentum, and the ADX at 37.97 confirms a strong downtrend is in play.
- The current market environment is characterized by risk-off sentiment, with the DXY index rising and major indices like Nasdaq experiencing significant drops.
The past week has been a stark reminder of market volatility, with the S&P 500 experiencing a significant downturn. The index closed the week near the $6,536.67 level, a considerable drop from recent highs and now hovering precariously above critical support zones. This decline is not occurring in a vacuum; it is deeply intertwined with a broader shift in market sentiment, driven by macroeconomic concerns and geopolitical undercurrents. The strength in the Dollar Index (DXY), which rose to 99.25, further adds to the pressure on risk assets like equities. As investors reassess their risk exposure, the appeal of safe-haven assets may grow, potentially weighing on the S&P 500's prospects in the short term. The correlation between rising yields, a strengthening dollar, and falling stock prices is a narrative that has dominated recent market action, and this week was no exception.
The Bearish Tide: Why the S&P 500 is Under Pressure
The technical indicators across various timeframes paint a consistently bearish picture for the S&P 500. On the 1-hour chart, the Relative Strength Index (RSI) sits at 37.71. While not yet in oversold territory, this reading suggests that momentum is firmly with the sellers, indicating a potential for further downside. The Moving Average Convergence Divergence (MACD) also supports this bearish outlook, with its histogram showing negative momentum and the MACD line trading below the signal line. This configuration often precedes further price declines. Furthermore, the Average Directional Index (ADX) at 37.97 confirms a strong downtrend is in play on this shorter timeframe, implying that the current move has significant conviction behind it.
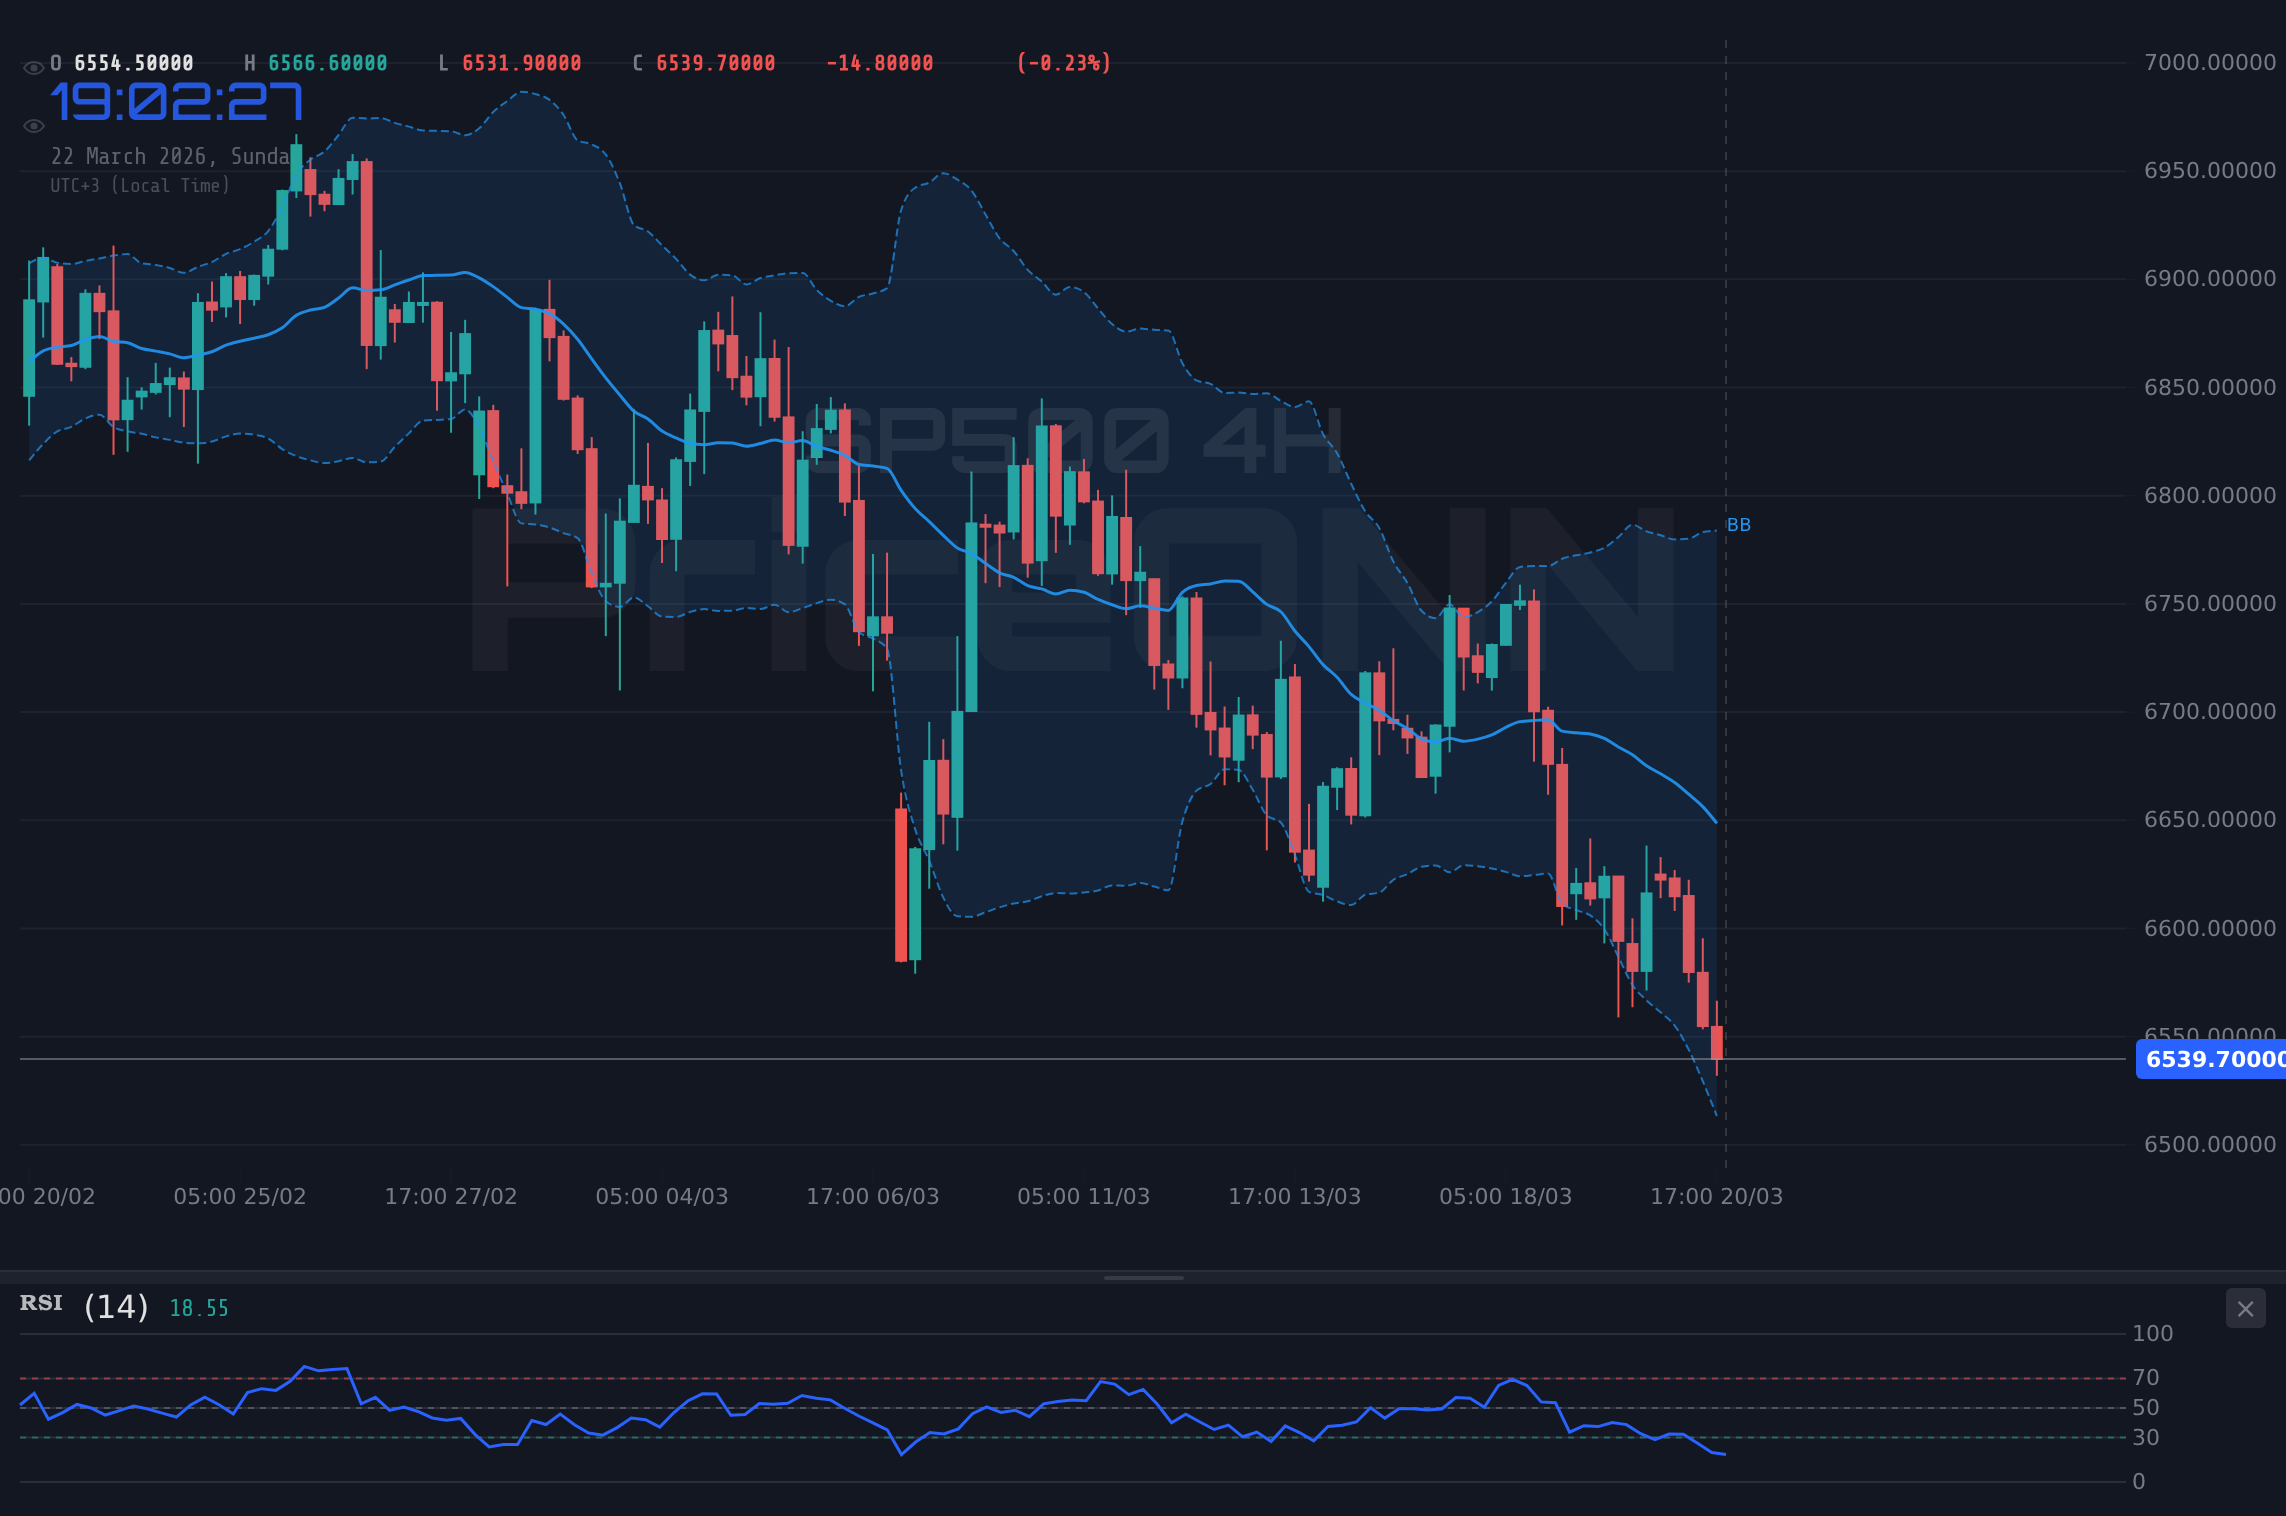
Looking at the 4-hour chart, the bearish sentiment intensifies. The RSI dips further to 32.35, moving closer to the oversold threshold, while the MACD continues to signal negative momentum. The Stochastic Oscillator, with %K at 10.52 and %D at 26.57, clearly indicates a downtrend and suggests that the market is not yet oversold but has room to fall further before a potential bounce. The ADX on this timeframe, though slightly lower at 24.88, still points to a moderately strong trend. The Bollinger Bands also show price trading below the middle band, reinforcing the downward pressure. These shorter-to-medium term indicators collectively suggest that the path of least resistance for the S&P 500 remains to the downside.
Even the daily timeframe, often considered more resilient, is showing signs of weakness. The RSI stands at 32.52, firmly in the bearish territory and approaching oversold conditions. The MACD is negative, and the Stochastic Oscillator (%K at 16.28, %D at 27.82) is signaling further weakness. The ADX at 44.59 is particularly concerning, indicating a very strong downtrend on the daily chart. This suggests that the selling pressure is not just a short-term phenomenon but has established a more significant foothold. The price is trading below the middle Bollinger Band, and on the daily chart, it has even dipped below the lower band, signaling extreme bearishness and potential for a sharp reversal, but only after a significant oversold condition is met. The current price of $6,536.67 is finding itself teetering above the first support level at $6,491.30, with further support at $6,476.40 and $6,450.90. A break below these levels would confirm the daily bearish trend.
The Case for the Bears: Macroeconomic Headwinds
The current bearish trend in the S&P 500 is not solely driven by technical factors; a confluence of macroeconomic headwinds is providing a strong fundamental basis for the sell-off. Inflation remains a persistent concern, despite some moderating signs in certain sectors. The sticky nature of core inflation, particularly in services and energy, continues to keep central banks, especially the Federal Reserve, on edge. The latest economic data, while mixed, has not provided enough comfort for policymakers to signal an imminent pivot towards aggressive rate cuts. In fact, recent commentary from Fed officials has emphasized a data-dependent approach, leaving the door open for prolonged higher interest rates if inflation does not recede more convincingly towards the 2% target.
This hawkish stance from the Fed, or at least the reluctance to signal imminent easing, has a direct impact on equity valuations. Higher interest rates increase the cost of capital for businesses, potentially dampening corporate earnings growth. Moreover, they make fixed-income investments more attractive relative to equities, drawing capital away from the stock market. The yield on the 10-year Treasury, a key benchmark, has been sensitive to inflation data and Fed expectations, and any upward movement in yields tends to put a lid on stock market gains, or in this case, exacerbate declines. The market is now pricing in a higher probability of fewer rate cuts than initially anticipated at the start of the year, a sentiment that is directly translating into lower stock prices.
Geopolitical tensions also continue to play a significant role in market sentiment. Ongoing conflicts and trade disputes create uncertainty, prompting investors to seek safer assets. The energy markets, for instance, remain volatile. Recent news regarding attacks on energy hubs and the ongoing global energy crunch, as highlighted by reports on nuclear power's resurgence and Alaska's oil lease sales, underscores the persistent supply-side risks. While rising oil prices (Brent at $112.54, WTI at $98.39) can sometimes signal economic strength, they also fuel inflation concerns, further complicating the central bank's task and adding another layer of risk aversion to the market. This complex interplay of inflation, interest rate policy, and geopolitical instability creates a challenging environment for equities, reinforcing the bearish narrative.
The Bullish Counter-Argument: Can Support Hold?
Despite the overwhelming bearish signals, there are reasons to believe that the current sell-off might present a buying opportunity, especially if key support levels hold. The S&P 500 is currently trading at $6,536.67, hovering just above significant support at $6,491.30. Historically, strong support levels, particularly those that have been tested multiple times, can act as a floor, leading to a bounce. On the daily chart, the RSI is approaching oversold territory at 32.52, and the Stochastic Oscillator is showing signs of bottoming out. While the ADX indicates a strong downtrend, such conditions can sometimes precede sharp reversals if the underlying conditions change or if the market overshoots to the downside.
One of the key arguments for a potential bullish reversal lies in the resilience of the US economy. Despite inflation concerns and interest rate hikes, economic growth has remained relatively robust. Recent PMI data, for example, has shown resilience in manufacturing and services sectors, suggesting that the economy may be able to withstand higher borrowing costs without tipping into a deep recession. Corporate earnings, while facing headwinds, have also shown pockets of strength, particularly in certain sectors less sensitive to interest rate hikes. If corporate America can continue to deliver solid results, it could provide a fundamental underpinning for a market recovery, even in a higher interest rate environment.
Furthermore, market sentiment can shift rapidly. If upcoming economic data surprises to the upside, or if central bank communication signals a less hawkish stance than currently anticipated, risk appetite could quickly return. For instance, a cooler-than-expected inflation report or a significant slowdown in job growth could lead markets to reprice the likelihood of earlier rate cuts, providing a significant tailwind for equities. The current bearish sentiment might also be overextended, creating a fertile ground for a sharp short-covering rally. Traders who have bet on further declines might rush to close their positions if the market shows signs of stabilizing, leading to a rapid upward price movement. The $6,536.67 level, being a significant psychological and technical level, could be the pivot point for such a shift.
Technical Confluence: Support at $6,491.30
The primary support level to watch for the S&P 500 is $6,491.30. This level has been identified on the 1-hour chart and is the first line of defense against further declines. If the price holds above this level, it could signal a temporary reprieve for the bulls, potentially leading to a retest of the intraday resistance at $6,531.70. A decisive break and hold above this resistance could then pave the way for a move towards the next resistance at $6,557.20, and subsequently $6,572.10. On the 4-hour chart, $6,498.27 is the first significant support, followed by $6,476.40. A failure to hold $6,491.30 on the 1-hour chart would likely see price gravitate towards these 4-hour support levels, increasing the probability of a deeper correction.
The daily support levels offer a more substantial floor, with the first major support at $6,569.53. However, the current price of $6,536.67 is already below this level, indicating that the bearish momentum is strong. The subsequent daily support levels are $6,522.87 and $6,486.83. If the price breaches these levels, it would signal a more significant breakdown, potentially leading to a sharp decline towards the lower end of the trading range. The confluence of support levels across different timeframes is crucial. A hold at $6,491.30, especially if accompanied by signs of bullish divergence on shorter timeframes or a shift in the daily RSI from oversold conditions, could be the trigger for a short-term bounce. However, the strong daily ADX of 44.59 suggests that any bounce might be met with selling pressure as traders look to exit positions.
It's important to note the conflicting signals from different indicators. While MACD and ADX on shorter timeframes are strongly bearish, the Stochastic on the 1-hour chart shows a potential for a bounce as %K is above %D and moving out of oversold territory. This divergence between indicators highlights the current uncertainty and the potential for a whipsaw move. A sustained move above the 1-hour resistance at $6,531.70 would be the first indication that the bears are losing control. Conversely, a decisive close below the $6,450.90 level on the 1-hour chart would confirm the continuation of the downtrend, targeting further downside. The market is at a critical pivot, and the price action around the $6,536.67 level and subsequent support zones will be key to determining the short-to-medium term direction.
The Verdict: Bears in Control, But Support Beckons
The prevailing technical and fundamental landscape suggests that the bears currently hold the upper hand in the S&P 500. The confluence of negative momentum across multiple timeframes, strong ADX readings indicating a firm downtrend, and macroeconomic concerns like persistent inflation and hawkish central bank rhetoric create a challenging environment for the bulls. The DXY's strength further exacerbates the risk-off sentiment, putting additional pressure on equity markets. The price action around the $6,536.67 mark, and its proximity to key support levels like $6,491.30 and $6,476.40, indicates that a breakdown is a tangible risk.
However, markets are rarely one-sided. The oversold conditions developing on the daily RSI and the potential for stochastic divergence on shorter timeframes suggest that a bounce is possible, especially if key support levels manage to hold. The resilience of the US economy and the possibility of a rapid shift in market sentiment cannot be entirely discounted. A significant break above the 1-hour resistance at $6,531.70, followed by a sustained move above $6,536.67, would be the first signal that the bearish momentum is faltering. Such a move would likely be short-covering driven, and its sustainability would depend on subsequent fundamental catalysts.
For now, the most probable scenario leans towards continued bearish pressure, with traders watching closely to see if the $6,450.90 level can stem the tide. A decisive break below this level would open the door to more significant downside targets. Conversely, a failure of the bears to push through the current support zone could lead to a short-term relief rally, but the overall trend bias remains negative until key resistance levels are convincingly reclaimed. The market is at a critical juncture, and risk management should be paramount for all participants as we navigate these choppy waters.
Navigating the Week Ahead: Key Levels and Events
As we look towards the upcoming trading week, several key levels and economic events will be crucial in shaping the S&P 500's trajectory. The immediate focus will remain on the $6,536.67 price point and the support cluster starting at $6,491.30. A break below $6,450.90 would signal further downside and likely target the daily support at $6,522.87, followed by $6,486.83. On the upside, a reclaim of $6,531.70 would be the first step for bulls, with a more significant hurdle at the $6,572.10 resistance level. A decisive move above $6,652.23 (daily resistance) would be needed to challenge the broader bearish narrative.
From a fundamental perspective, all eyes will be on upcoming economic data releases. Key indicators such as Consumer Price Index (CPI) and Non-Farm Payrolls (NFP) reports will be critical in shaping the Federal Reserve's next move and, consequently, market sentiment. If inflation data comes in hotter than expected or employment figures remain robust, it could reinforce the Fed's hawkish stance and lead to further selling pressure on equities. Conversely, any signs of cooling inflation or a significant slowdown in job creation could fuel hopes for earlier rate cuts, potentially triggering a bullish reversal. Traders will also be closely monitoring speeches from Fed officials for any hints about the future path of monetary policy.
The geopolitical landscape will continue to be a background driver, with any escalation of existing tensions or new flare-ups likely to increase volatility and favor safe-haven assets. The correlation with the DXY will remain important; a sustained rise in the dollar could continue to weigh on the S&P 500. Given the current strong downtrend signals, particularly on the daily timeframe with an ADX of 44.59, caution is advised. Any rallies should be treated with skepticism until stronger bullish confirmation emerges, such as a clear break of key resistance levels and a shift in momentum indicators. The market is clearly in a risk-averse phase, and until that narrative changes, the bears are likely to remain in control.
Bullish Scenario: A Bounce from Support?
Bullish Rebound: Testing the Resistance at $6,531.70
25% ProbabilityConsolidation: Range-Bound Action
40% ProbabilityBearish Continuation: Downside Breakout
35% Probability| Indicator | Value | Signal | Interpretation |
|---|---|---|---|
| RSI (14) | 37.71 | Bearish | Declining momentum, potential for oversold |
| MACD | Negative | Bearish | Below signal line, negative momentum |
| Stochastic | K:21.93, D:17.22 | Bullish (divergence) | Moving out of oversold, potential bounce signal |
| ADX | 37.97 | Bearish | Strong downtrend confirmation |
| Bollinger Bands | Below Middle | Bearish | Downward pressure confirmed |
Frequently Asked Questions: SP500 Analysis
What happens if SP500 breaks below the $6,450.90 support level?
A confirmed break below $6,450.90 on the 1-hour chart would invalidate the immediate bullish potential and likely trigger further downside. This bearish scenario would then target the next significant support levels identified on the daily chart, potentially extending the current downtrend.
Should I consider buying SP500 at current levels of $6,536.67 given the bearish signals?
Buying at current levels carries significant risk due to the prevailing bearish sentiment and strong downtrend confirmation from indicators like ADX. A more prudent approach would be to wait for a clear bullish signal, such as a hold of the $6,491.30 support and a break above intraday resistance at $6,531.70, indicating a potential shift in momentum.
Is the RSI at 37.71 a sell signal for SP500 right now?
An RSI of 37.71 on the 1-hour chart is not an outright sell signal but indicates bearish momentum is in play and the market is moving away from overbought conditions. While it suggests sellers are in control, it is not yet in oversold territory, implying room for further declines before a potential bounce.
How will upcoming economic data, like CPI and NFP, affect SP500 this week?
Stronger-than-expected CPI or NFP data could reinforce hawkish Fed expectations, potentially leading to further downside for the SP500 as higher rates become more probable. Conversely, weaker data could fuel hopes for rate cuts, possibly triggering a bullish reversal, especially if key support levels hold.
Track markets in real-time
AI-powered analysis, technical indicators and real-time price data.
Join Our Telegram Channel
Breaking market news, AI analysis and trading signals instantly.
Join Channel