SP500 Tests $6,490 Amidst Bearish Trend and Dollar Strength
The SP500 is currently trading at $6,494.90, testing key support as the dollar index (DXY) shows renewed strength. Read the analysis for critical levels and outlook.
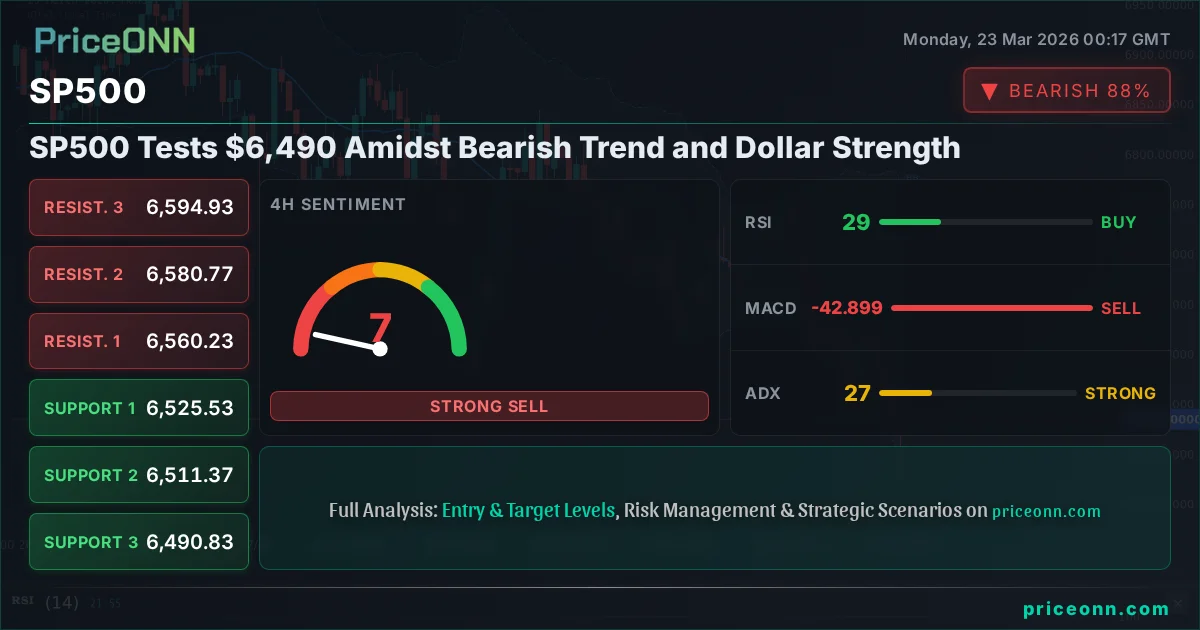
The relentless march upwards for the SP500 has finally hit a significant snag, with the index currently trading at $6,494.90. This level is not just a number; it represents a critical juncture where the prevailing bullish sentiment is being challenged by a confluence of bearish technical signals and strengthening macroeconomic headwinds, particularly from the US dollar. The sharp decline of -1.83% on the day, wiping out $121.30 from its value, signals a potential shift in market dynamics, prompting a closer examination of what lies ahead for US equities. This isn't just a minor pullback; it's a test of resilience that could define the near-term trajectory of the broader market.
- The SP500 is currently trading at $6,494.90, with key support at $6,490.83 being tested.
- The RSI(14) at 30.6 suggests oversold conditions on the 1H chart, while the 4H RSI at 28.35 indicates potential for a bounce.
- The Dollar Index (DXY) is showing renewed strength, currently at 99.34, which typically exerts downward pressure on risk assets like the SP500.
- A break below $6,490.83 could trigger further downside towards $6,486.83, while a sustained move above $6,515.27 is needed for a bullish confirmation.
Navigating the Shifting Sands: SP500's Technical Picture
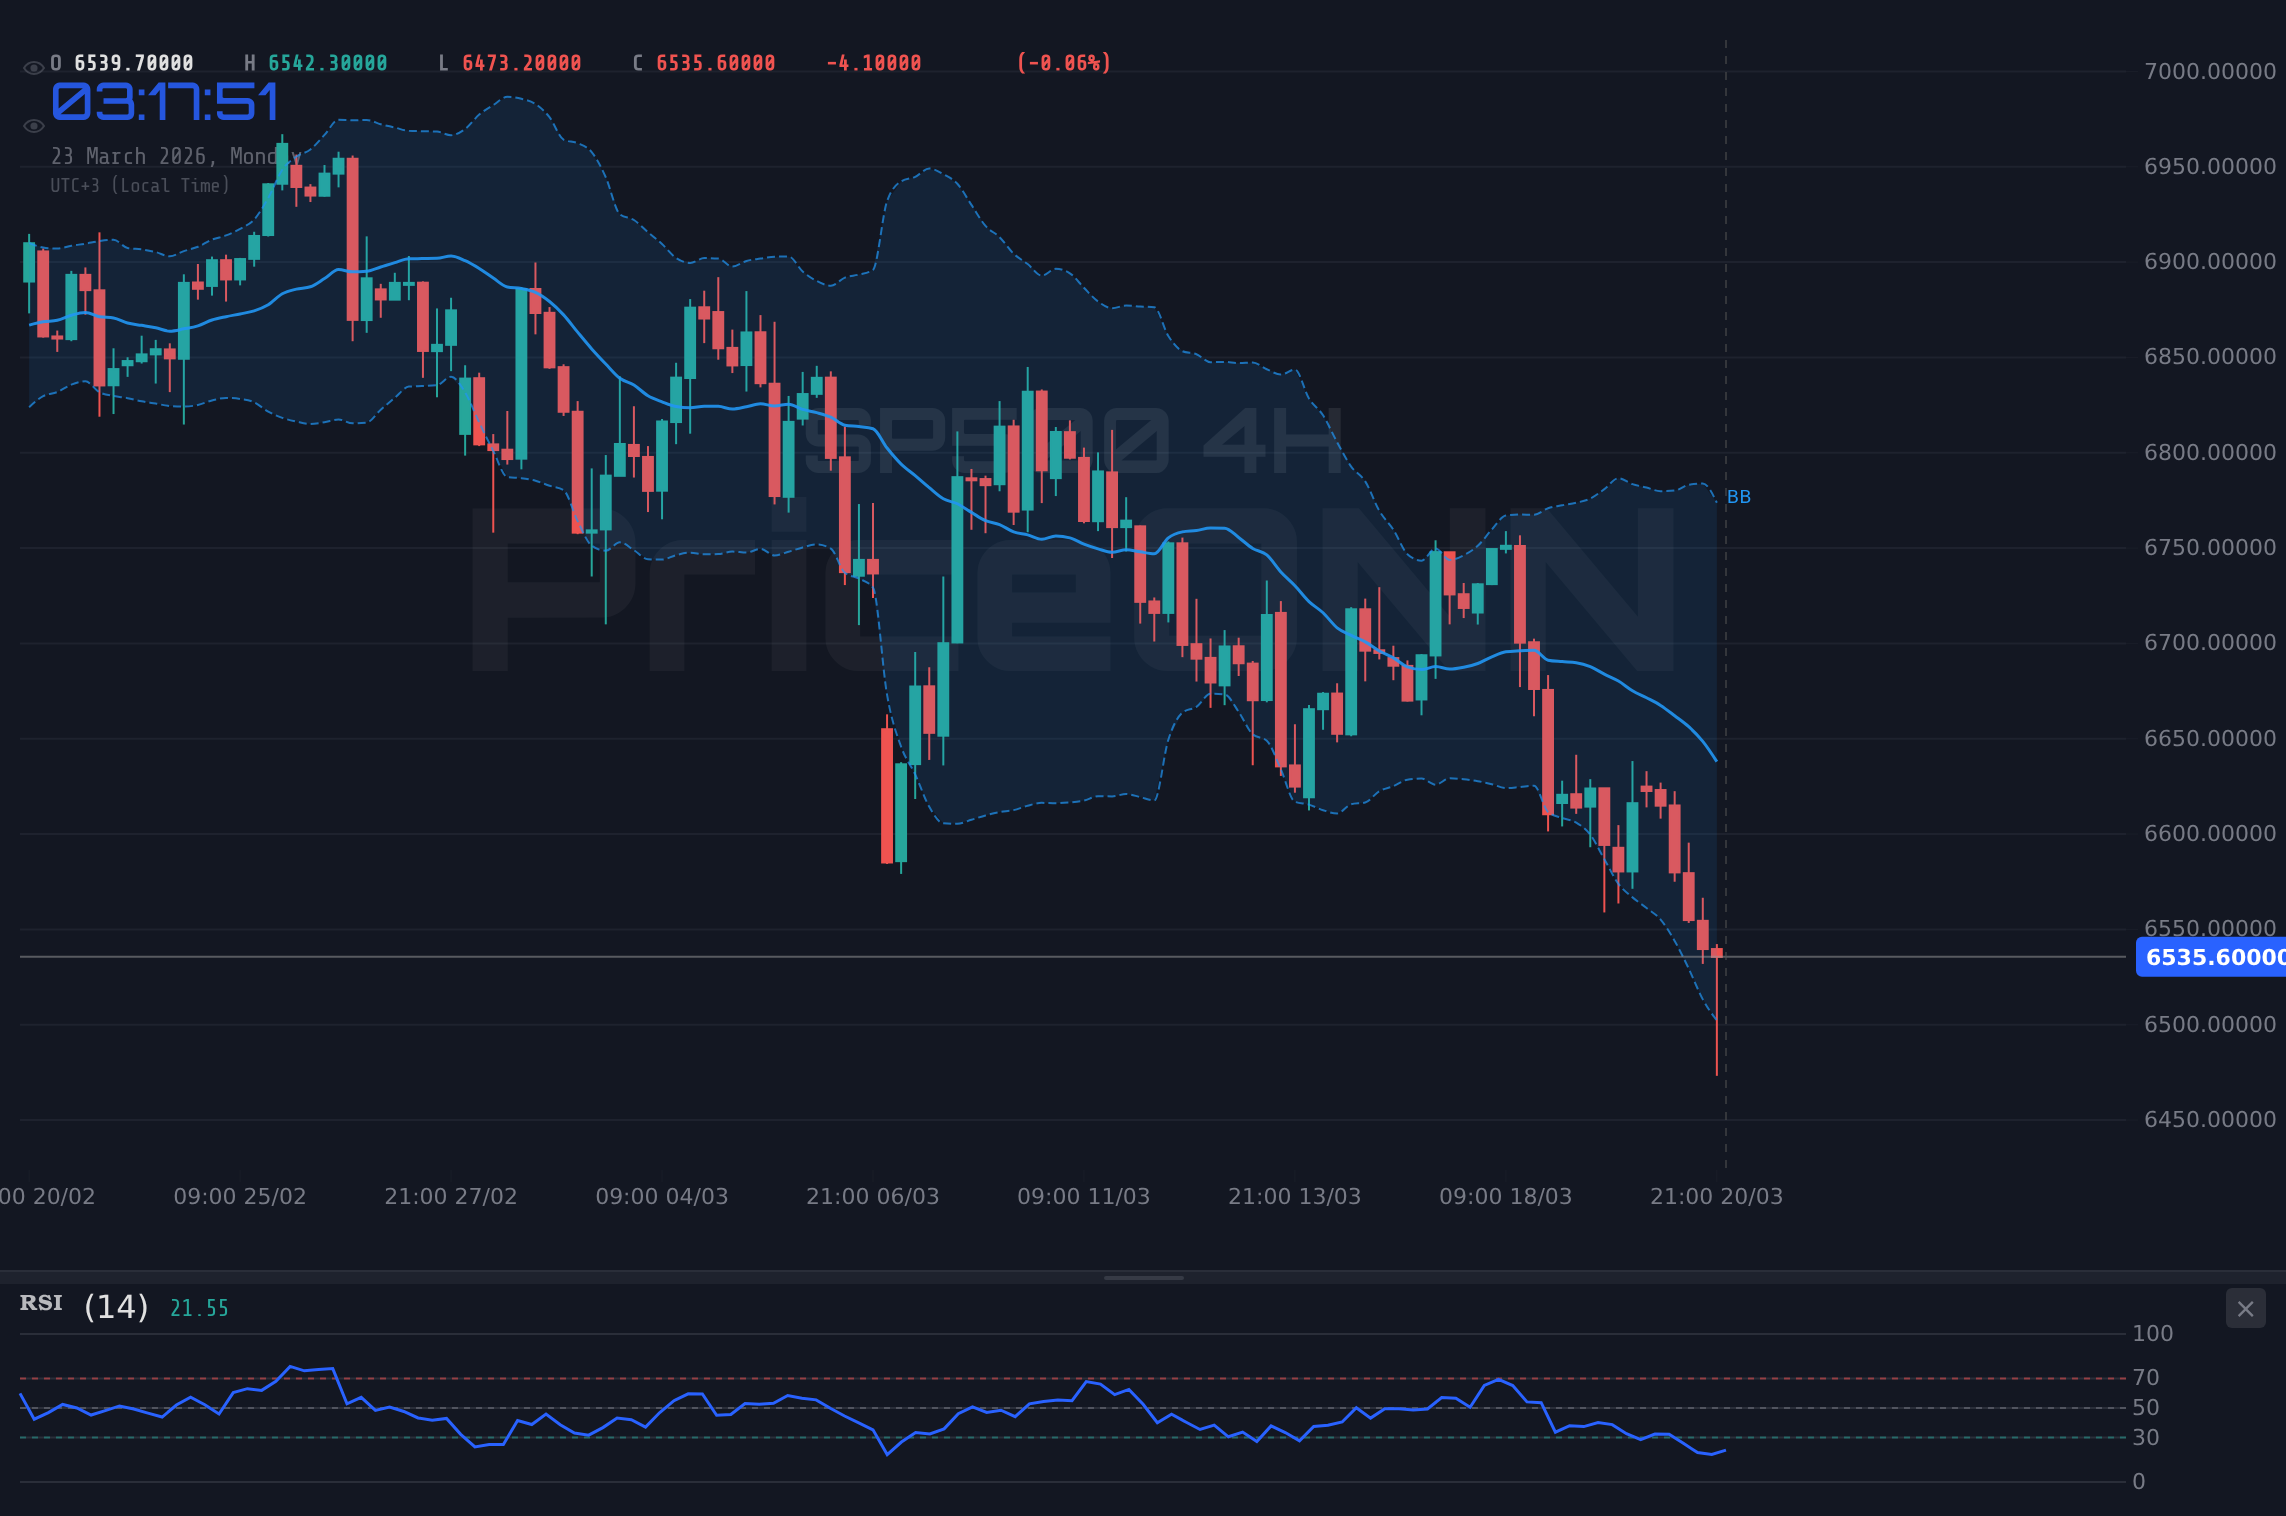
The 4-Hour Chart: A Bearish Engulfing Pattern in Play
On the 4-hour chart, the SP500 paints a decidedly bearish picture. The trend is firmly established as bearish, with a strength of 93%, and the price action has decisively broken below the middle Bollinger Band. This band, typically acting as a mean reversion level, is now serving as a resistance point. The RSI(14) is sitting at a concerning 28.35, deep in oversold territory. While oversold conditions can sometimes precede a bounce, the ADX at 26.97 confirms a strong bearish trend, suggesting that this oversold reading might simply indicate a deeper capitulation rather than an immediate buying opportunity. Stochastic indicators are also flashing a bearish signal, with the %K line at 7.39 well below the %D line at 24.77, further reinforcing the downward momentum. The immediate support level to watch is $6,490.83, a level that has been tested multiple times today. A close below this critical support on the 4-hour chart would validate the bearish thesis and likely accelerate selling pressure.
The Daily Chart: Trend Confirmation and Potential Capitulation
Extending the analysis to the daily timeframe, the bearish sentiment is undeniable, with the trend strength pegged at a perfect 100%. The SP500 is trading below the middle Bollinger Band, and the RSI(14) at 30.69, while not as extreme as the shorter timeframes, still suggests a market that is heavily weighted towards sellers. The MACD histogram is deeply negative, and the MACD line remains below the signal line, confirming the persistent selling pressure. The ADX at 44.59 is particularly noteworthy; such a high reading indicates an extremely strong trend, meaning that attempting to catch a falling knife here is a high-risk strategy. The Stochastic Oscillator, with %K at 12.54 and %D at 27.2, is in deeply oversold territory, mirroring the 4-hour chart. This extreme oversold condition on the daily chart, coupled with the strong trend, suggests that while a short-term relief rally might be possible, the path of least resistance remains downwards until a significant shift in market structure occurs. The key daily support level to monitor is $6,486.83, followed by $6,422.07. A decisive break below these levels would signal a significant acceleration of the downtrend.
The 1-Hour Chart: Short-Term Dynamics and Divergence Clues
Looking at the 1-hour timeframe, we see a more nuanced picture, though still predominantly bearish. The trend is classified as bearish with 95% strength, but the RSI(14) at 30.6 is bordering on oversold, hinting at potential short-term exhaustion for sellers. The MACD is negative, but the histogram seems to be narrowing slightly, which could be an early sign of waning bearish momentum. The ADX at 40.39 still points to a strong trend, but the Stochastic Oscillator offers a glimmer of hope for bulls, with %K at 35.05 crossing above %D at 23.55, indicating a potential bullish divergence or at least a pause in the selling. The immediate resistance on this timeframe is at $6,515.27, and a confirmed break and hold above this level would be the first sign of a potential short-term reversal, targeting higher resistance levels. However, given the strength of the daily and 4-hour trends, traders are likely to remain cautious, waiting for more substantial confirmation before committing to long positions.
Macroeconomic Undercurrents: The Dollar's Ascendancy and Equity Selloff
The Mighty Dollar: A Headwind for Global Risk Assets
The surge in the Dollar Index (DXY) to 99.34 is a critical factor underpinning the current weakness in the SP500. A stronger dollar generally makes US assets more expensive for foreign investors and can signal tighter global liquidity conditions or a flight to safety, both of which are negative for equities. Currently, the DXY is showing a strong upward trend on the daily chart, powered by a 0.44% daily gain. On the 1-hour chart, the DXY's trend is technically bearish (90% strength) but showing positive momentum, with RSI at 55.06 and MACD positive. However, the 1-day chart paints a more dominant picture of strength, with an ADX of 34.64 indicating a robust uptrend. This dollar strength acts as a significant headwind for the SP500, as it increases the cost of dollar-denominated assets for holders of other currencies, potentially dampening foreign investment appetite. Furthermore, a strong dollar can sometimes be a precursor to capital outflows from emerging markets, which can indirectly impact global risk sentiment and US equity valuations.
Interest Rate Expectations and Fed Policy: The Lingering Uncertainty
While specific Fed policy announcements are not detailed in the provided market data, the broader market narrative heavily influences equity performance. The current market environment, characterized by significant equity selloffs and dollar strength, often implies that interest rate expectations are shifting. If inflation remains stubbornly high, or if economic data continues to surprise to the upside, the Federal Reserve might be forced to maintain a hawkish stance for longer than initially anticipated, or even consider further tightening. This would increase the cost of capital, make borrowing more expensive for corporations, and reduce the present value of future earnings – all negative catalysts for stock prices. Conversely, if this selloff is seen as a precursor to a broader economic slowdown, markets might begin pricing in earlier rate cuts. However, the current strength in the dollar and the bearish trend in the SP500 suggest that the former narrative, or at least a 'higher for longer' interest rate scenario, is currently dominating market sentiment. Traders will be keenly watching upcoming economic data releases, such as inflation reports and employment figures, for any signals that might sway the Fed's policy direction.
Correlation Analysis: DXY, SP500, and the Inverse Relationship
The inverse correlation between the Dollar Index (DXY) and risk assets like the SP500 is a well-established phenomenon in financial markets. When the DXY strengthens, it typically signals increased demand for the US dollar, often driven by factors like higher US interest rates, geopolitical uncertainty, or a general 'risk-off' sentiment. This increased demand for dollars can lead to capital flowing out of other assets, including equities. Currently, with the DXY at 99.34 and showing a daily increase, this dynamic is clearly at play. The SP500's fall to $6,494.90 aligns perfectly with this inverse relationship. On the 1-hour chart, the DXY's RSI is at 55.06, indicating a neutral to slightly bullish bias, while the daily chart shows a strong upward trend. This suggests that the dollar's strength is a significant contributing factor to the equity market's current woes. Any sustained move higher in the DXY will likely continue to put pressure on the SP500, making it harder for bulls to regain control. Conversely, a sharp reversal in the DXY could provide some much-needed relief for equity markets, but this would require a fundamental shift in market drivers.
Market Sentiment and Geopolitical Undercurrents
Risk Appetite Deterioration: A Flight to Safety?
The sharp decline in the SP500, coupled with the strengthening dollar, strongly suggests a deterioration in global risk appetite. Investors are moving away from riskier assets like equities and cryptocurrencies towards perceived safe-haven assets. While the provided data doesn't explicitly show flows into safe havens like gold or US Treasuries, the pattern is classic. The significant daily drop in the SP500 (-1.83%) and Nasdaq (-2.32%) indicates a broad-based selloff across US stock markets. This risk-off sentiment can be triggered by a myriad of factors, including persistent inflation concerns, geopolitical tensions, or unexpected economic data. The current data, showing strong bearish trends in metals like XAUUSD and XAGUSD, also supports the idea of a flight to safety, although these metals are also experiencing sharp declines, which is an anomaly that warrants further investigation – perhaps indicating a broader liquidity crunch rather than a simple risk-off move into traditional safe havens. The focus remains on whether this is a temporary pullback or the beginning of a more prolonged deleveraging cycle.
Geopolitical Factors: The Unseen Hand?
While the provided market data doesn't offer specific geopolitical news, it's crucial to acknowledge their pervasive influence on market sentiment. Events such as escalating international conflicts, trade disputes, or major political instability can quickly shift market dynamics, triggering risk aversion and impacting asset prices. For instance, any news related to increased tensions in major geopolitical hotspots could exacerbate the current downward pressure on the SP500 and bolster demand for safe-haven assets. Given the current bearish sentiment, any geopolitical 'bad news' is likely to be amplified by market participants, leading to sharper price movements. Conversely, de-escalation of tensions or positive diplomatic developments could provide a much-needed catalyst for a market recovery. Without explicit news in the provided context, we must assume that current price action is driven by technical and macroeconomic factors, but remain vigilant for geopolitical events that could rapidly alter the landscape.
Scenario Analysis: Charting Potential Paths Forward
Bearish Scenario: The Path of Least Resistance
65% ProbabilityNeutral Scenario: Consolidation and Waiting Game
25% ProbabilityBullish Scenario: A Relief Rally Emerges
10% ProbabilityThe Trader's Perspective: What to Watch Next
Short-Term Trading: Patience and Confirmation are Key
For short-term traders, the current environment demands extreme caution. The 1-hour chart shows oversold RSI and a potential Stochastic divergence, hinting at a possible short-term bounce. However, the overwhelming bearish trend on the 4-hour and daily charts cannot be ignored. A break below $6,490.83 on the 4-hour chart would be a strong signal for bearish continuation trades, targeting $6,486.83 and potentially lower. Conversely, a confirmed break above $6,515.27 on the 1-hour chart, especially if accompanied by a pickup in volume and a shift in broader market sentiment (e.g., DXY pullback), could offer a short-term long opportunity targeting $6,561.87. The key here is to wait for clear confirmation – a decisive price action signal that aligns with the broader trend or signals a significant shift. Attempting to anticipate the bottom in such a strong downtrend is a perilous strategy.
Swing Trading: Waiting for Structure Break or Confirmation
Swing traders typically look for more established trends or clear structural breaks. In the current SP500 environment, the immediate priority is to observe if the key support at $6,490.83 holds. If it breaks decisively, the focus shifts to identifying potential downside targets and waiting for signs of stabilization before considering any bearish positions. If, however, the SP500 manages to hold this level and shows signs of forming a base, swing traders might look for opportunities to enter long positions on a confirmed breakout above resistance levels like $6,515.27 or $6,561.87, especially if accompanied by positive macroeconomic news or a weakening dollar. The high ADX readings across multiple timeframes suggest that any bounce might be short-lived unless there's a fundamental change in the market's narrative. Patience will be rewarded; entering prematurely in a strong downtrend often leads to significant drawdowns.
Long-Term Investing: Assessing the Macroeconomic Landscape
For long-term investors, the current technical picture, while concerning, should be viewed within the broader macroeconomic context. The SP500's decline at $6,494.90 could be presenting attractive entry points for those with a long-term horizon, provided the underlying economic fundamentals remain sound. However, the persistent strength of the dollar and the clear bearish trends in equities and potentially other risk assets suggest that caution is still warranted. Investors should assess whether this selloff is a healthy market correction or the beginning of a more significant downturn driven by factors like persistent inflation, restrictive monetary policy, or a global economic slowdown. The ability of the Federal Reserve to navigate inflation without inducing a deep recession remains a key variable. Long-term investors might consider dollar-cost averaging into positions if they believe the current levels offer a favorable risk-reward profile, but they should be prepared for continued volatility and potentially lower levels before a sustained recovery takes hold.
Frequently Asked Questions: SP500 Analysis
What happens if the SP500 breaks below the $6,490.83 support level?
A decisive break below the 4-hour support at $6,490.83 would invalidate the current consolidation pattern and likely trigger further selling pressure. The next key daily support level to watch would be $6,486.83, followed by $6,422.07, indicating a continuation of the bearish trend.
Should I consider buying the SP500 at current levels around $6,494.90 given the oversold RSI?
While the RSI(14) on the 1-hour chart is at 30.6 and on the 4-hour chart at 28.35, indicating oversold conditions, the strong bearish trend (ADX 44.59 on daily) suggests caution. A confirmed break above the 1-hour resistance at $6,515.27 would be needed for a higher probability long entry, otherwise, further downside is likely.
Is the MACD histogram's negative momentum a strong sell signal for the SP500 right now?
The deeply negative MACD histogram and the MACD line being below the signal line on all observed timeframes confirm persistent bearish momentum. While the histogram may be narrowing slightly on the 1-hour chart, it's not yet a buy signal and reinforces the overall bearish outlook until a crossover or significant divergence appears.
How will the strengthening Dollar Index (DXY) at 99.34 affect the SP500's outlook this week?
The DXY's current level of 99.34 and its strong daily uptrend presents a significant headwind for the SP500. This inverse correlation means a stronger dollar typically weighs on US equities by increasing costs for foreign investors and potentially signaling tighter global liquidity. Expect continued pressure on the SP500 as long as the DXY remains buoyant.
| Indicator | Value | Signal | Interpretation |
|---|---|---|---|
| RSI (14) | 30.6 | Bearish | Oversold on 1H, nearing oversold on Daily; potential for bounce but trend is strong. |
| MACD Histogram | -ve | Bearish | Strong negative momentum across all timeframes. |
| Stochastic | K:35.05 D:23.55 | Bullish | Bullish crossover on 1H, but overall trend may limit upside. |
| ADX | 40.39 | Bearish | Strong downtrend confirmed on 1H. |
| Bollinger | Below Mid | Bearish | Price is below the middle band, indicating bearish pressure. |
The current technical and macroeconomic landscape paints a bearish picture for the SP500, with the index testing critical support at $6,494.90. The strengthening dollar and the confirmed downtrend across multiple timeframes suggest that further downside is probable, especially if key support levels are breached. However, oversold conditions on shorter timeframes offer a slight possibility for a short-term relief rally. For now, the prudent approach is to respect the prevailing trend and wait for clear signals of either a continuation of the downtrend or a confirmed reversal.
Track markets in real-time
AI-powered analysis, technical indicators and real-time price data.
Join Our Telegram Channel
Breaking market news, AI analysis and trading signals instantly.
Join Channel