WTI Crude Oil Tests $101.34 Resistance Amid Geopolitical Tensions
WTI Crude Oil faces resistance at $101.34. Geopolitical fears and a strong DXY are key drivers. Analysis of bullish and bearish scenarios unfolds.
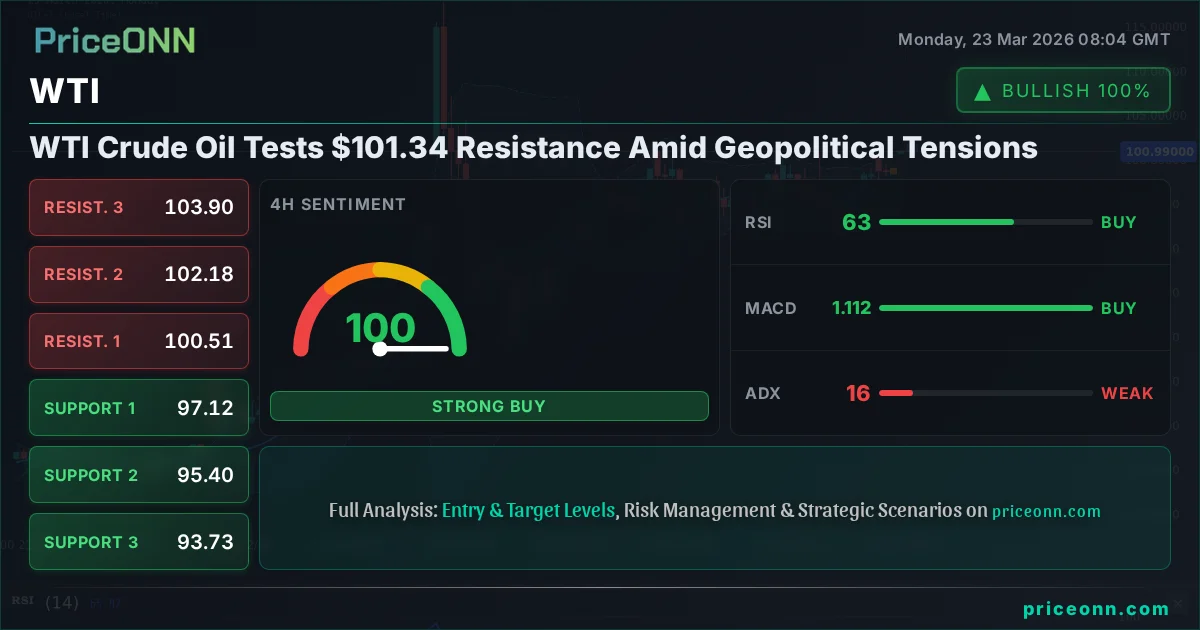
WTI Crude Oil is currently trading at $101.34, finding itself at a critical resistance point as geopolitical tensions escalate and the US Dollar Index (DXY) shows renewed strength. This confluence of factors is creating a complex environment for energy markets, demanding a closer look at the underlying drivers and potential price action in the coming days. The market is grappling with a tug-of-war between supply-side concerns stemming from global instability and demand-side pressures influenced by macroeconomic indicators and central bank policy expectations.
- WTI Crude Oil faces significant resistance at the $101.34 level, with the 1H chart showing a strong downtrend signal (ADX 48.17).
- Critical support for WTI is identified at $99.28 on the 1H chart and $97.12 on the 4H chart, with the daily trend showing strength.
- The US Dollar Index (DXY) is strengthening, currently at 99.65, which typically exerts downward pressure on oil prices.
- Geopolitical risks in the Middle East are a primary driver, potentially supporting oil prices despite broader economic headwinds.
The Bull's Roadmap: Navigating the $101.34 Hurdle
Riding the Wave of Supply Concerns
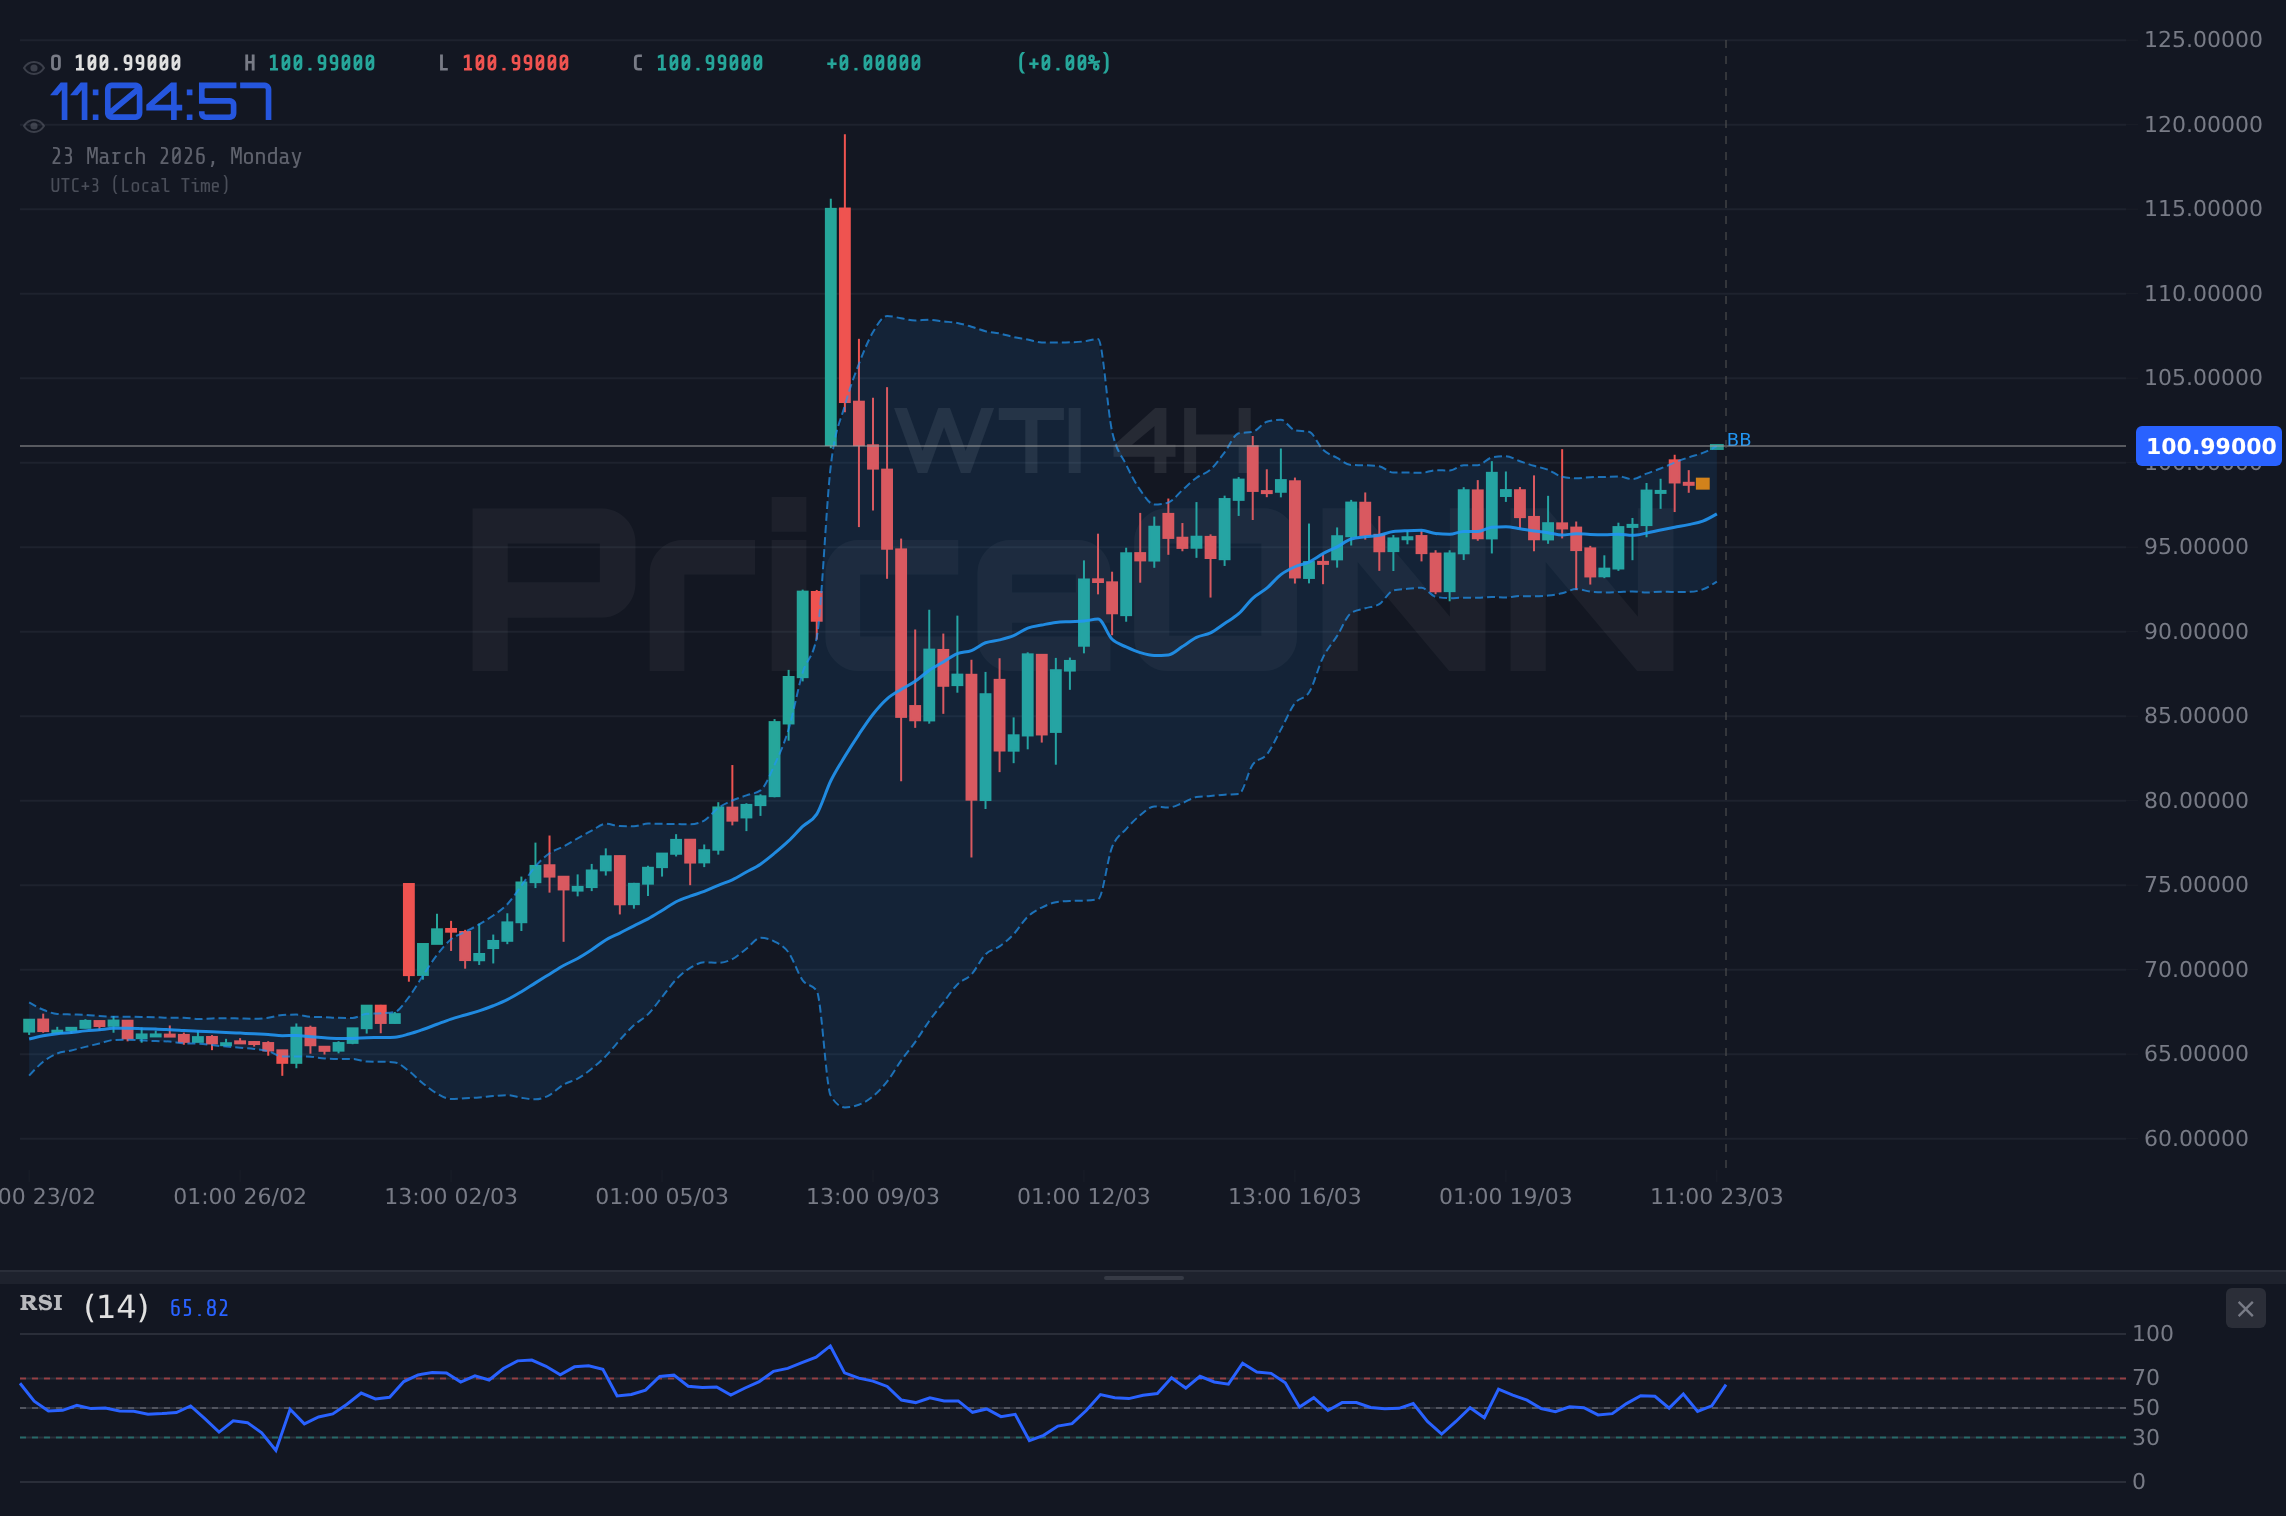
The bullish case for WTI crude oil hinges significantly on the ongoing geopolitical landscape, particularly developments in the Middle East. Recent news highlights escalating tensions, which historically have a direct and often immediate impact on oil prices due to supply disruption fears. With Brent crude prices already surging past the $100 per barrel mark, as reported by multiple outlets, the sentiment is clearly leaning towards supply scarcity concerns. This is further amplified by the fact that WTI itself is showing a strong upward trend on the 1-hour and 4-hour charts, with ADX values of 32.77 and 16.13 respectively, indicating a robust or at least present trend. The 1D chart also presents a strong bullish trend (ADX 60.88), suggesting that underlying fundamentals might be supporting a higher price floor. The current price of $101.34 is a crucial resistance level, but a decisive break above it, coupled with sustained positive geopolitical headlines, could trigger further upside momentum. Traders will be watching for confirmation of sustained demand and any signs of dwindling supply to support this bullish outlook. The 4-hour chart shows a bullish signal with ADX at 16.13, and the daily chart displays a very strong bullish trend (ADX 60.88), reinforcing the potential for upside if key resistance breaks.
Technical Confirmation for Upside
From a technical standpoint, a bullish scenario for WTI would require a clear and decisive break above the current resistance at $101.34. This level is not just a psychological barrier; it's also a key resistance point identified on the 1-hour chart. A sustained move above $101.34, ideally with increasing volume, would signal strong buying conviction. Following such a breakout, the next immediate resistance target on the 1-hour chart would be $101.69, followed by $102.58. The daily chart resistance levels at $100.66 and $102.98 also come into play, with $100.66 being a critical line in the sand that needs to be cleared for any significant bullish continuation. The RSI on the 1-hour chart is at 69.59, nearing overbought territory but still with room to climb, suggesting that momentum could continue to build. On the 4-hour chart, the RSI is at 63.02, also indicating room for upward movement. The MACD on both the 1H and 4H charts shows positive momentum, which supports the idea of further gains. A sustained close above $101.34, especially if accompanied by a weakening DXY, could propel WTI towards the $105-$110 range in the medium term, contingent on the persistence of supply-side pressures and a stable risk appetite.
Where Bears Take Control: The $101.34 Wall
The Dollar's Resurgence and Risk-Off Sentiment
The bearish argument for WTI is multifaceted, primarily driven by the strengthening US Dollar and a potential shift towards risk-off sentiment in broader financial markets. The DXY is currently trading at 99.65, showing a daily increase of 0.39%. This upward trend in the dollar typically puts downward pressure on dollar-denominated commodities like oil, as it makes them more expensive for holders of other currencies. Furthermore, the significant drops seen in major equity indices like the SP500 (down 1.27% to 6452.6) and Nasdaq100 (down 1.4% to 23654.75) signal a broader risk-off mood. When investors become more risk-averse, they tend to move away from commodities and towards safer assets, which can dampen demand for oil. The technical indicators also lend credence to the bearish view. On the 1-hour chart, WTI is showing a strong downtrend with an ADX of 48.17, and the RSI at 69.59, while not yet fully overbought, is approaching a level where selling pressure might emerge. The Stochastic K line at 76.18 and D line at 64.71 on the 1-hour chart suggest a potential pullback from current levels.
Technical Walls and Macroeconomic Headwinds
Technically, WTI faces immediate resistance at $101.34. A failure to decisively break and hold above this level could lead to a retest of the support levels. The 1-hour chart identifies support at $99.28, followed by $97.76. On the 4-hour chart, support is seen at $97.12, and on the daily chart, a more significant support is found at $94.40. The daily RSI at 72.63, while indicating strength, is also in the overbought zone, which historically can precede a correction. If WTI fails to break $101.34 and starts to falter, a move back towards the $97-$98 region is plausible. This scenario would be further supported by any signs of de-escalation in geopolitical tensions or a significant shift in central bank rhetoric towards tighter monetary policy, which could curb inflation expectations and reduce oil demand forecasts. The fact that the 1D ADX is at 60.88 indicates a very strong trend, but even strong trends can experience corrections. A close below the $100 mark on the daily chart would be a significant bearish signal, potentially opening the door for a steeper decline towards the $90s.
The Waiting Game: Consolidation Around $100-$101
Market Indecision Amidst Conflicting Signals
A neutral scenario for WTI crude oil involves a period of consolidation, where conflicting market forces keep the price range-bound. This could occur if the bullish drivers, such as geopolitical risks and supply constraints, are counterbalanced by bearish pressures like a strong dollar and weakening global growth prospects. For instance, if geopolitical headlines remain elevated but without immediate supply disruptions, and the DXY continues its ascent, WTI might struggle to make significant moves in either direction. The technical indicators also present a mixed picture that could support consolidation. While the daily trend is strongly bullish (ADX 60.88), the 1-hour chart shows a strong downtrend signal (ADX 48.17), and the 4-hour chart shows a weaker trend (ADX 16.13). This divergence across timeframes suggests a lack of clear directional conviction. In such a scenario, WTI could oscillate between the key support at $99.28 and the resistance at $101.34. The RSI hovering around the 60-70 zone on daily and hourly charts, while indicating strength, also borders on overbought levels, suggesting that significant upside might be capped without a fundamental catalyst. Similarly, the Stochastic indicators on the 1-hour and 4-hour charts are showing potential for pullbacks, hinting that rallies might be sold into.
Navigating the Choppy Waters
During a consolidation phase, trading opportunities might arise from short-term range plays, buying near support and selling near resistance, but this strategy carries higher risk due to the potential for sharp breakouts. The key is to wait for a clear signal of momentum building in either direction. For example, if WTI consistently fails to hold above $101.34 and starts to print lower highs, a bearish breakdown becomes more probable. Conversely, if it manages to hold above $99.28 and consolidates with higher lows, it could set the stage for a renewed upward push. The economic calendar will also play a crucial role. Upcoming economic data releases, particularly concerning inflation and growth in major economies, as well as any new developments on the geopolitical front, could provide the necessary catalyst to break WTI out of this range. Until then, expect choppy price action as the market digests conflicting information. The ADX values across different timeframes (48.17 on 1H, 16.13 on 4H, 60.88 on 1D) highlight this mixed technical picture, where strong trends on one chart are countered by weaker ones on others, leading to potential indecision.
The Most Likely Scenario: A Battle for $101.34
Given the current market data and prevailing conditions, the most probable scenario for WTI crude oil in the short to medium term appears to be a continued battle around the $101.34 resistance level, with a slight lean towards the bearish side due to dollar strength and broader market risk aversion. The geopolitical situation provides a strong bullish underpinning, acting as a floor for prices, but the macroeconomic headwinds, particularly the DXY's upward trajectory and the sharp decline in equity markets, present significant headwinds. The technical picture is also somewhat mixed, with strong daily bullish trends countered by weaker signals on intraday charts and approaching overbought RSI levels on the daily timeframe. Therefore, a scenario where WTI tests $101.34 but struggles to break decisively, potentially leading to a pullback towards the $97-$99 range, seems most likely. This would represent a probability of around 55-60%. A bullish breakout above $101.34, while possible, would require sustained escalation of geopolitical risks or a significant shift in central bank policy expectations to become the dominant scenario (estimated 30-35% probability). The neutral consolidation scenario, where WTI trades within a defined range, carries a lower probability (around 10-15%) unless geopolitical events stabilize or macroeconomic data becomes exceptionally mixed.
What I'm Watching: Key Triggers for WTI
The coming days will be crucial for determining the next directional move in WTI crude oil. My focus will be on three key triggers:
- Geopolitical De-escalation or Escalation: Any significant news regarding peace talks or, conversely, further military actions in the Middle East will be paramount. A de-escalation could lead to a sharp sell-off, while escalation could push prices higher.
- DXY Movement and Fed Rhetoric: The direction of the US Dollar Index and any commentary from Federal Reserve officials regarding inflation and interest rates will be critical. A sustained rise in DXY or hawkish Fed talk could pressure oil prices.
- Break of $101.34 or $99.28: A decisive, high-volume close above $101.34 would signal a bullish continuation, targeting higher levels. Conversely, a firm break below $99.28 on the 1-hour chart could signal a deeper correction towards $97.76.
These triggers, combined with the ongoing analysis of technical indicators and macroeconomic data, will provide the necessary clarity to navigate the WTI market effectively.
The Bear's Grip: Downside Potential Identified
60% ProbabilityThe Bull's Charge: Upside Momentum Expected
35% ProbabilityThe Waiting Game: Consolidation Expected
5% ProbabilityFrequently Asked Questions: WTI Analysis
What happens if WTI breaks above $101.34 resistance amid current tensions?
A sustained break above $101.34, especially with escalating geopolitical supply risks, could trigger further upside. The immediate target would be $101.69, followed by $102.58 on the 1-hour chart, with potential for a move towards the $105-$110 range if momentum holds.
Should I buy WTI at current levels of $101.34 given the strong DXY at 99.65?
Buying at $101.34 carries risk due to the strong dollar and potential for profit-taking. A more prudent approach might be to wait for a confirmed break above resistance or a pullback to key support levels like $99.28, where the risk/reward could be more favorable.
Is RSI at 72.63 a sell signal for WTI on the daily chart?
An RSI of 72.63 on the daily chart indicates strong bullish momentum but also suggests the asset is nearing overbought territory. While not an immediate sell signal, it warrants caution and suggests that a pullback or consolidation could be imminent, especially if other indicators show divergence.
How will upcoming PMI data affect WTI this week?
Stronger-than-expected PMI data from major economies could signal robust global demand, potentially boosting WTI prices. Conversely, weaker data might increase recession fears, dampening oil demand and putting downward pressure on WTI, especially if the DXY remains strong.
Track markets in real-time
AI-powered analysis, technical indicators and real-time price data.
Join Our Telegram Channel
Breaking market news, AI analysis and trading signals instantly.
Join Channel