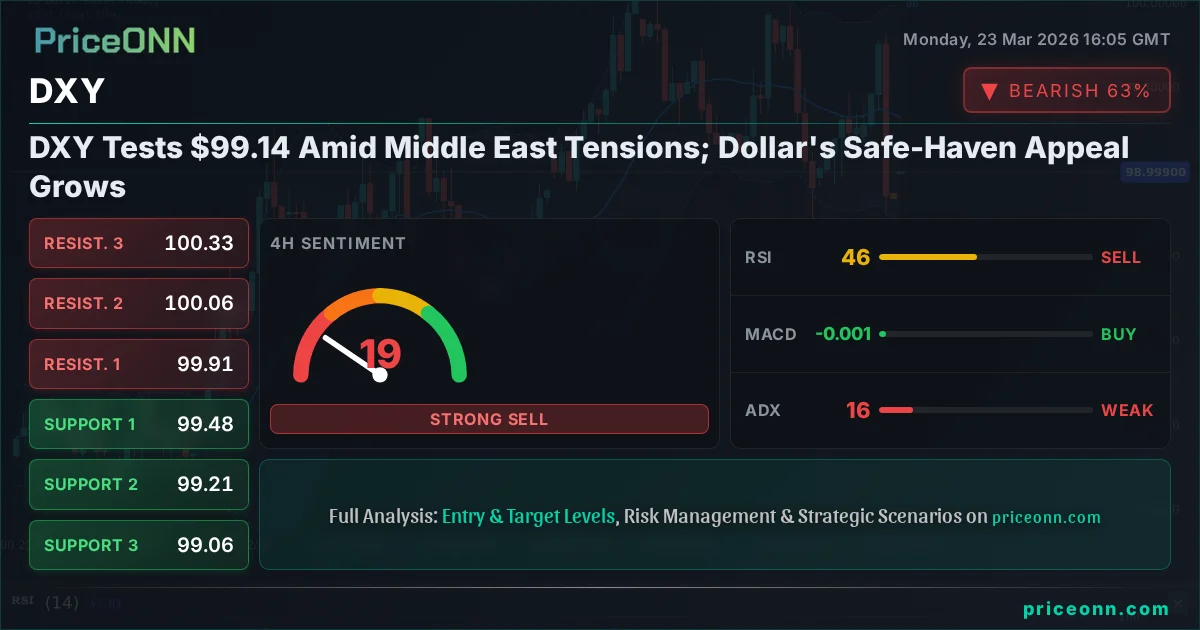
DXY Tests $99.14 Amid Middle East Tensions; Dollar's Safe-Haven Appeal Grows
The US Dollar Index (DXY) holds near $99.14 as geopolitical fears escalate, bolstering safe-haven demand. Analysis of key indicators and correlations.
The DXY, the benchmark index measuring the US dollar's strength against a basket of major currencies, is currently hovering around the critical $99.14 level. This isn't just another trading day for the dollar; it's a moment where geopolitical tremors are translating directly into tangible price action. Escalating tensions in the Middle East are acting as a potent catalyst, reigniting the age-old safe-haven appeal of the US dollar. As global investors recalibrate their risk exposure, the dollar's resilience is becoming a central theme in market narratives. This isn't a time for passive observation; it's a period demanding a deep dive into the underlying drivers and potential trajectory of this pivotal currency index. The question on every trader's mind is whether this geopolitical-fueled demand is sustainable and what it signifies for the broader financial landscape.
- The DXY is currently trading at $99.14, showing a slight daily decline but underpinned by strong safe-haven demand.
- Critical support for the DXY is identified at $98.96, with resistance looming at $99.51 on the daily chart.
- RSI at 55.88 on the daily chart signals neutral momentum with a slight upward bias, while the 1H RSI at 47.15 indicates a neutral, slightly downward leaning momentum.
- Geopolitical tensions in the Middle East are a primary driver, increasing demand for the US dollar as a safe-haven asset.
The narrative surrounding the US dollar is currently dominated by a potent cocktail of geopolitical uncertainty and shifting central bank expectations. The escalating situation in the Middle East has undeniably injected a significant dose of risk aversion into global markets. Historically, such periods of heightened global tension trigger a flight to safety, and the US dollar, with its deep liquidity and established status as the world's reserve currency, is often the primary beneficiary. We've seen this play out repeatedly; as fear permeates, capital flows towards perceived safe havens, pushing up the DXY. This dynamic is currently playing out, with the dollar index finding support even as some underlying economic indicators might suggest otherwise. It’s a classic example of how macro events can override purely fundamental economic data in the short to medium term, creating significant trading opportunities for those who understand these correlations.
Dollar's Resilience Amidst Global Headwinds
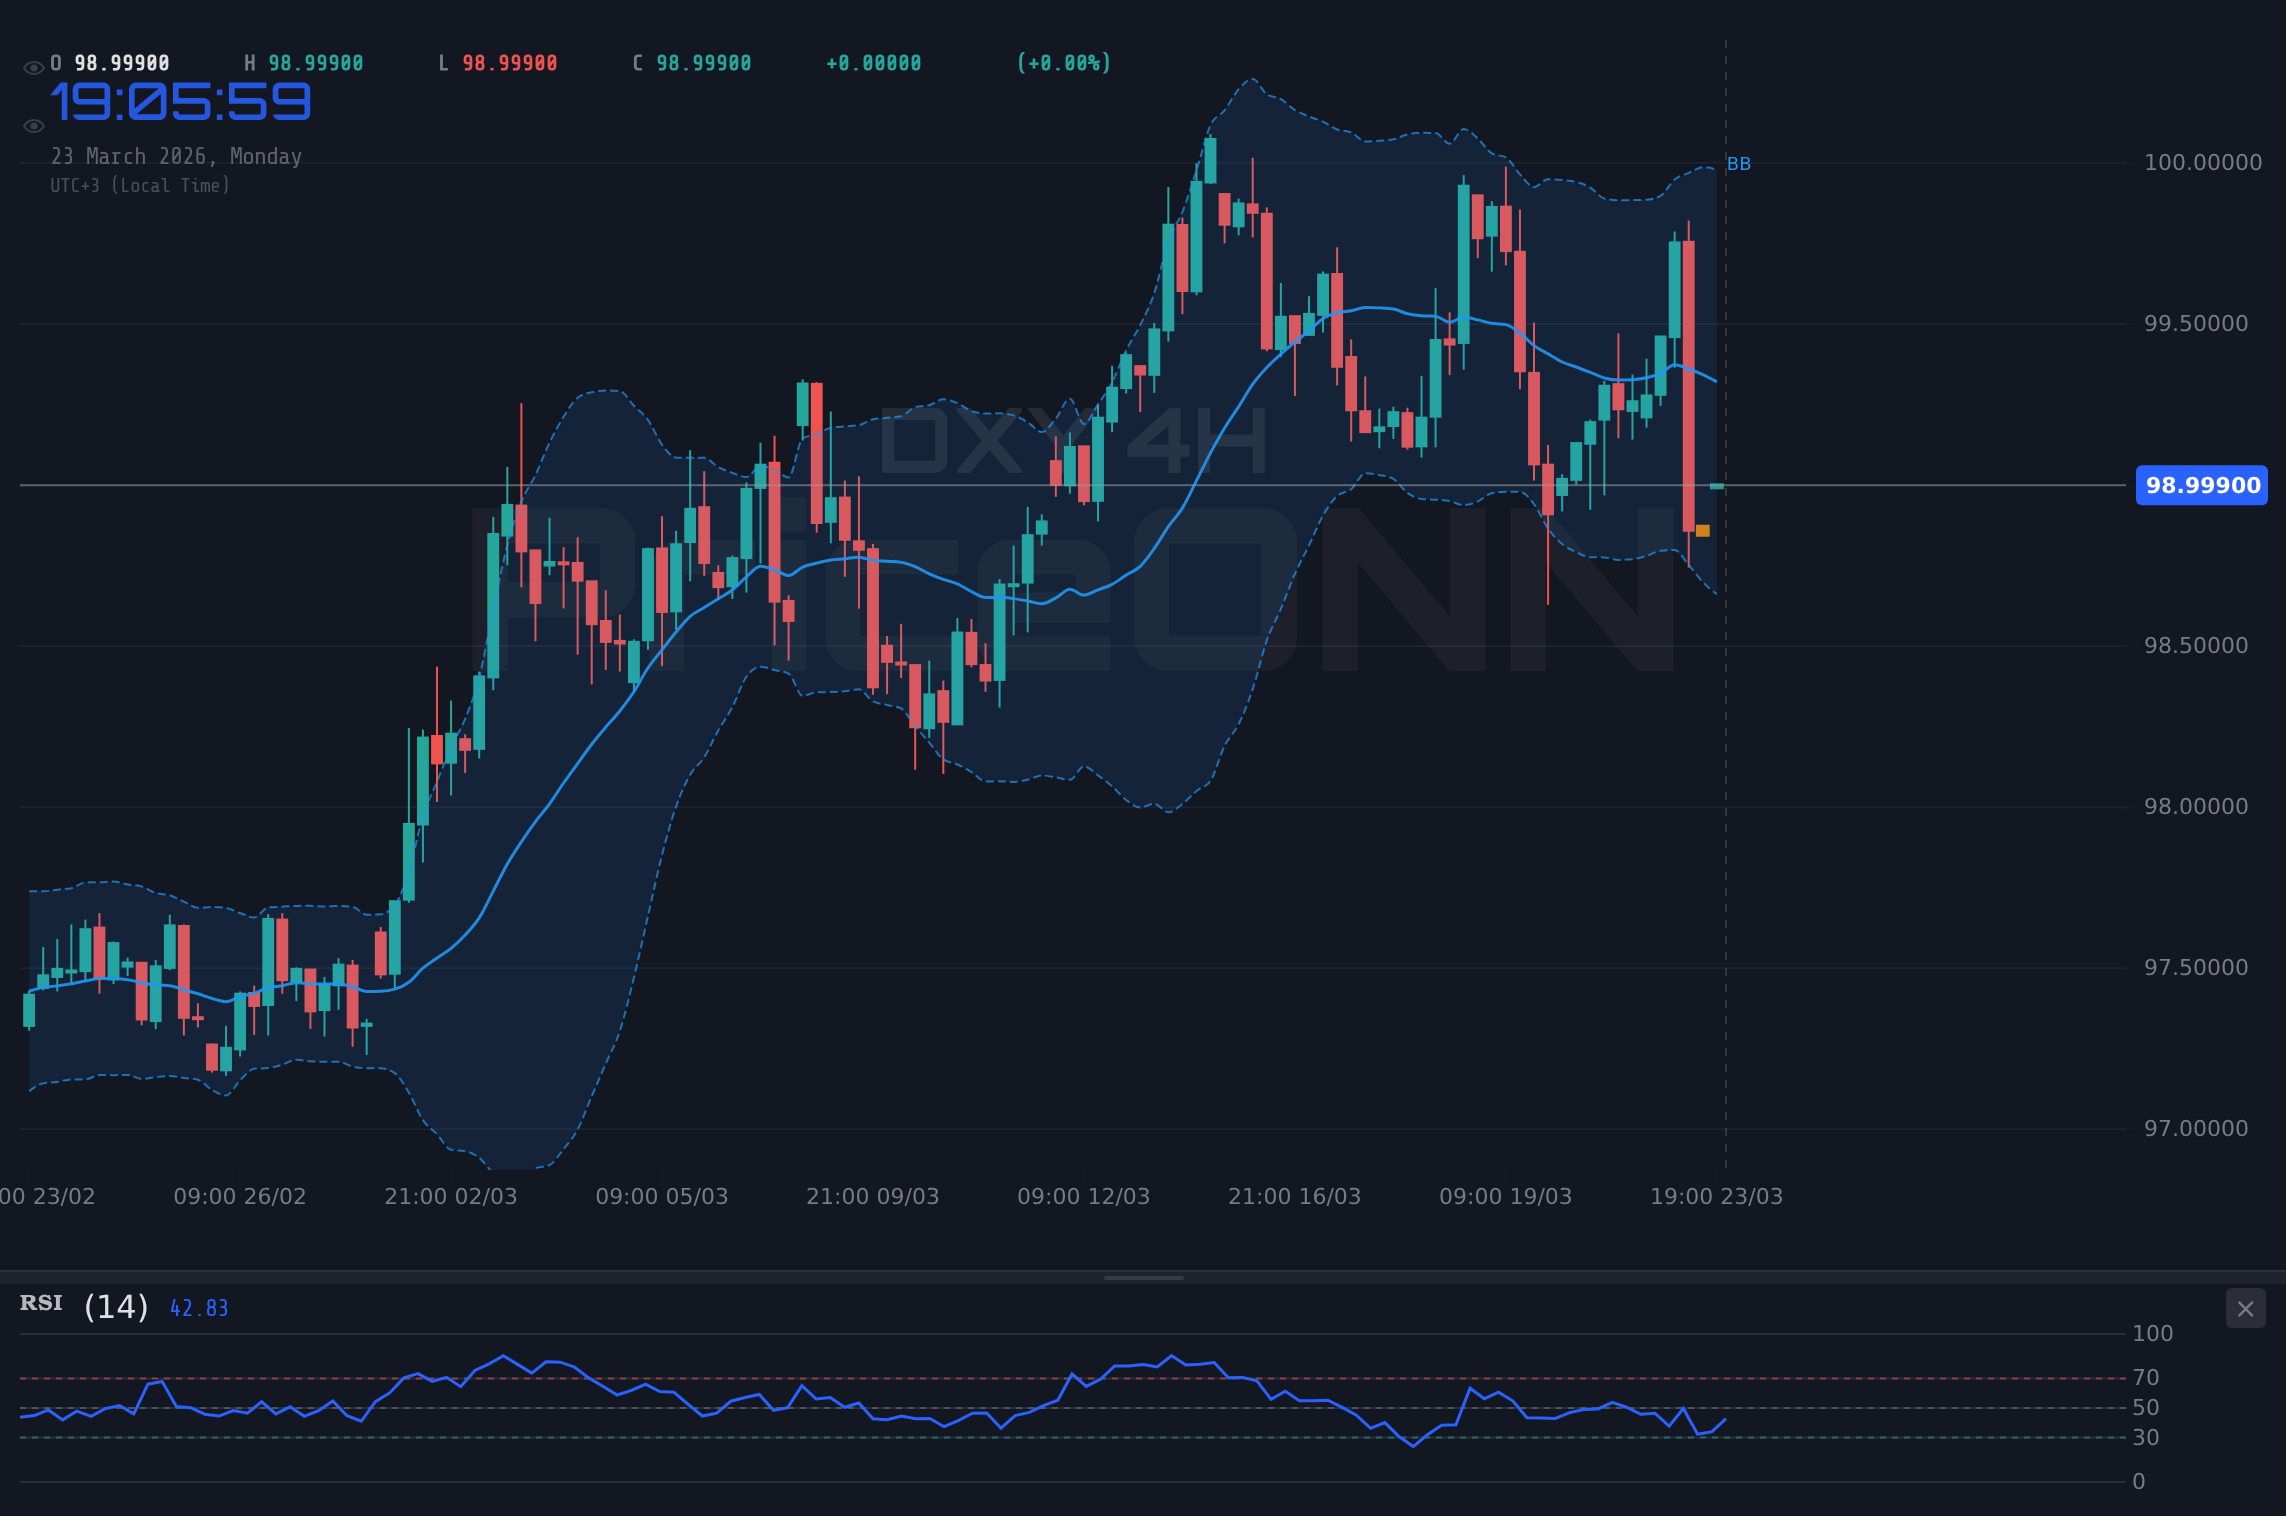
Looking at the DXY's performance across different timeframes, a complex picture emerges. On the 1-hour chart, the trend is described as neutral with a power of 50%, and the RSI(14) at 47.15 suggests a neutral stance leaning slightly downwards. This indicates short-term traders might be pausing or taking profits, but the overall trend hasn't decisively shifted. However, the 4-hour chart paints a different story, labeling the trend as 'Rising' with a power of 98%. The RSI(14) here is 45.73, still in neutral territory but showing a downward inclination. This suggests that while the broader trend might be upward, the immediate pressure is slightly bearish. Yet, the daily chart presents the strongest bullish conviction, with a trend rated as 'Rising' and 92% power. The RSI(14) at 55.88 here is firmly in neutral territory, indicating room for further upward movement before becoming overbought. This multi-timeframe analysis highlights that while short-term fluctuations exist, the medium to long-term outlook for the dollar, driven by external factors, appears to be leaning bullish.
This divergence in signals across timeframes is precisely where experienced traders find their edge. The 1-hour chart might show consolidation or minor pullbacks, but the 4-hour and daily trends are signaling a higher probability for dollar strength. The key is to understand what's driving this. The escalating geopolitical risks in the Middle East are not just headlines; they translate into real-world concerns about oil supply disruptions, which, in turn, fuel inflation fears. When inflation concerns rise, the market often anticipates a more aggressive stance from central banks like the Federal Reserve. This anticipation alone can strengthen the dollar, as higher interest rates make dollar-denominated assets more attractive. The DXY's current position at $99.14, therefore, represents not just a price point, but a nexus of geopolitical fear and potential monetary policy tightening.
The Geopolitical Imperative: Why Oil Matters for the Dollar
The correlation between oil prices and the US dollar is a well-established phenomenon, and it's particularly relevant now. Brent crude is currently trading at $102.8, having seen a significant daily drop of 8.73%, while WTI is at $91.13, down 7.33%. This sharp decline, despite ongoing geopolitical tensions, is intriguing. Typically, Middle East tensions would suggest higher oil prices and, consequently, potentially higher inflation expectations, which would favor a stronger dollar. The fact that oil prices have fallen sharply, even with these tensions, suggests that perhaps the market is pricing in a swift resolution or that other factors, like potential strategic reserve releases mentioned by the IEA, are temporarily overshadowing supply fears. However, the underlying risk of supply disruption remains a significant background factor. If tensions were to escalate further or if actual supply disruptions occurred, oil prices could surge, feeding into inflation concerns and providing a further boost to the DXY. This complex interplay means that oil price movements, even sharp ones, must be monitored closely for their indirect impact on dollar sentiment.
The current price action in oil, despite the geopolitical backdrop, is a crucial point of analysis. The sharp drop from recent highs might be interpreted in a few ways. It could signal that the market believes the geopolitical flare-up is containable, or it could be a precursor to further volatility. The IEA's readiness to release more crude from strategic reserves is a significant factor, acting as a potential ceiling on oil prices for now. However, the fundamental supply/demand picture for oil remains tight, and any sustained escalation in the Middle East could quickly reverse this downward trend. For the DXY, a spike in oil prices would likely translate into renewed dollar strength due to inflation expectations. Conversely, sustained lower oil prices, while seemingly reducing inflation pressure, could also be interpreted as a sign of weakening global demand, which might indirectly support the dollar as a safe haven if it sparks broader risk aversion. It's a delicate balance.
Correlations in Focus: DXY, Equities, and Precious Metals
The relationship between the DXY and other major markets is crucial for understanding the broader financial ecosystem. A rising DXY typically puts pressure on gold (XAUUSD) and silver (XAGUSD), as dollar-denominated commodities become more expensive for holders of other currencies. Currently, XAUUSD is trading at $4365.97, down significantly by 2.92%. This sharp decline, despite the geopolitical uncertainty that usually benefits gold, is a strong indicator of the dollar's current strength and potentially rising bond yields, which often move inversely to gold prices. The 4-hour ADX for XAUUSD at 65.39 signals a very strong downtrend, reinforcing the bearish pressure. Similarly, XAGUSD, at $68.02, is showing a mixed picture with a strong downtrend on the 4H chart (ADX 60.2) despite a slight daily gain. This suggests that the dollar's strength is a dominant factor across precious metals right now.
The correlation with equity markets is also telling. The SP500 is trading at 6590.65, up 0.84% on the day, while the Nasdaq100 is at 24177.01, also up 0.77%. This suggests that despite the geopolitical concerns, risk appetite in the US equity markets remains relatively robust for now. However, the daily charts for both SP500 and Nasdaq100 show a 'Falling' trend with 100% power, and their respective ADX values (46.22 for SP500, 37.63 for Nasdaq100) indicate strong downward trends. This creates a divergence: equities are showing signs of underlying weakness on longer timeframes, yet are managing to eke out gains in the intraday session. If global risk aversion intensifies due to the Middle East situation, we could see a sharp sell-off in equities, which would almost certainly amplify the demand for the DXY as investors seek refuge. This is a key scenario to watch.
Federal Reserve's Shadow: Interest Rate Expectations and the Dollar
Beyond the immediate geopolitical narrative, the underlying economic fundamentals and, crucially, the Federal Reserve's monetary policy stance, continue to shape the dollar's trajectory. While the current geopolitical events are driving short-term flows, the longer-term outlook for the DXY is heavily influenced by interest rate differentials. If inflation remains stubbornly high, as suggested by some recent data points and the persistent rise in oil prices, the market may continue to price in a more hawkish Federal Reserve. This means potentially more interest rate hikes or a longer period of high rates than previously anticipated. The Fed's forward guidance, upcoming economic data releases such as Non-Farm Payrolls (NFP) and Consumer Price Index (CPI), will be critical in shaping these expectations. Any indication of a stronger commitment to fighting inflation would likely bolster the dollar further.
The market is constantly trying to price in the Fed's next move. While the immediate focus might be on geopolitical events, the underlying economic data will eventually reassert its influence. If upcoming US economic data surprises to the upside, reinforcing the narrative of a resilient US economy capable of withstanding higher rates, the Fed might feel more comfortable maintaining a hawkish stance. Conversely, signs of economic slowdown, especially if coupled with persistent inflation (stagflation fears), could complicate the Fed's decision-making. For the DXY, a scenario where the Fed is perceived as falling behind the inflation curve would be dollar-negative, while a perception of proactive policy action would be dollar-positive. Given the current DXY price of $99.14, much of this future policy path is likely already being factored in, but any deviation from expectations could trigger significant moves.
Navigating the Technical Landscape: Key Levels and Indicator Signals
From a technical perspective, the DXY is at an interesting juncture. On the daily chart, we see support levels at $98.96, $98.66, and $98.41, while resistance is identified at $99.51, $99.77, and $100.07. The price is currently trading between the first support and resistance levels, indicating a period of consolidation within a broader trend. The daily RSI at 55.88 suggests there is still room for the index to climb higher before reaching overbought territory, which typically occurs above 70. However, the 1-hour RSI at 47.15 and the 4-hour RSI at 45.73 are more neutral to slightly bearish in the immediate term. This suggests that while the daily trend might be positive, intraday traders might be cautious or expecting a short-term pullback before the next move.
The ADX indicator provides further insight into trend strength. On the daily chart, the ADX is at 34.7, indicating a strong uptrend. This is a significant signal, suggesting that the current upward momentum has substantial backing. However, the 1-hour ADX at 24.56 and the 4-hour ADX at 16.03 are much weaker, pointing to a lack of strong directional conviction in the shorter timeframes. This contrast is important: the long-term trend is strong, but the path higher might not be smooth, with potential for choppy price action in the near term. The Stochastic indicator on the daily chart shows K=48.43 and D=67.96, which is a bearish signal as %K is below %D, suggesting a potential cooling off from current levels. This conflicting signal from Stochastic adds another layer of complexity, highlighting the need for careful risk management.
The Road Ahead: Upcoming Economic Events and DXY Outlook
Looking forward, several key economic events will significantly influence the DXY's path. The upcoming Non-Farm Payrolls (NFP) report, scheduled for release next Friday, will be a major catalyst. Strong NFP numbers would likely reinforce the bullish case for the dollar by signaling economic resilience and potentially pushing the Fed towards a more hawkish stance. Conversely, weaker-than-expected data could prompt a reassessment of rate hike expectations, potentially leading to a dollar pullback. Similarly, CPI data will be closely scrutinized for any signs of persistent inflation, which could further embolden the Fed and support the DXY. The market's reaction to these data points will be crucial in determining whether the current geopolitical-driven strength can be sustained by fundamental economic factors.
Furthermore, any significant developments in the Middle East could rapidly shift market sentiment. A de-escalation of tensions might lead to a decrease in safe-haven demand, potentially causing the DXY to retreat from current levels. Conversely, any further escalation or the involvement of major global powers could amplify risk aversion and drive the dollar higher. Traders should remain vigilant, monitoring both the geopolitical headlines and the economic calendar. The interplay between these factors will dictate the DXY's movement. Currently positioned at $99.14, the index appears to be in a strong uptrend on the daily chart, but the mixed signals from shorter timeframes and conflicting indicators suggest that the path forward may involve significant volatility. Patience and a disciplined approach to risk management will be paramount in navigating these complex market conditions.
Frequently Asked Questions: DXY Analysis
What happens if DXY breaks above the $99.51 resistance level amid Middle East tensions?
If the DXY breaks decisively above the $99.51 resistance, it would likely signal a continuation of the safe-haven rally, potentially targeting the $99.77 and $100.07 levels on the daily chart. This scenario would be further supported by persistent geopolitical fears and strong US economic data, reinforcing a hawkish Fed outlook.
Is the RSI at 55.88 on the daily chart a buy signal for DXY right now, given the current geopolitical climate?
An RSI of 55.88 on the daily chart is in neutral territory, indicating room for upward movement before becoming overbought. While not an immediate buy signal, it supports the potential for further dollar strength, especially if confirmed by bullish price action and positive economic data releases like NFP.
How will upcoming CPI data affect the DXY around the $99.14 current level?
Higher-than-expected CPI data would likely increase inflation concerns, potentially strengthening the DXY as markets anticipate a more hawkish Federal Reserve response. Conversely, surprisingly low CPI could dampen rate hike expectations and lead to a pullback in the dollar from its current $99.14 level.
Should traders consider buying DXY at $99.14 if geopolitical tensions continue to escalate in the Middle East?
Given the escalating geopolitical risks and the DXY's established safe-haven status, buying at $99.14 could be considered, but with caution. The daily chart shows strong uptrend potential towards $99.51 resistance. However, invalidation would occur on a close below $98.96 support, and traders should closely monitor oil price reactions and upcoming US economic data.
Bearish Scenario: Dollar Retreats Amid De-escalation
25% ProbabilityNeutral Scenario: Consolidation Around $99.14
30% ProbabilityBullish Scenario: Geopolitical Fears Sustain Dollar Strength
45% ProbabilityTrack markets in real-time
AI-powered analysis, technical indicators and real-time price data.
Join Our Telegram Channel
Breaking market news, AI analysis and trading signals instantly.
Join Channel