GBPUSD Tests Key Resistance Near $1.34: Bull vs. Bear Showdown
GBPUSD hovers near $1.34, facing critical resistance. Today's analysis dives into the bull and bear arguments, supported by key technicals and macro drivers.
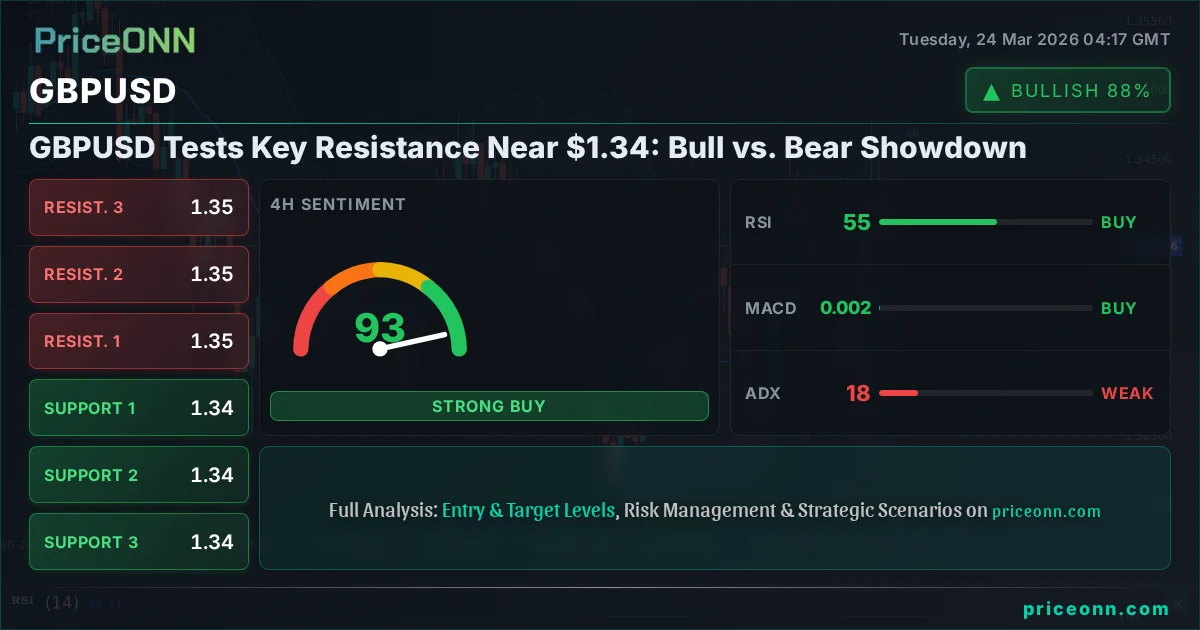
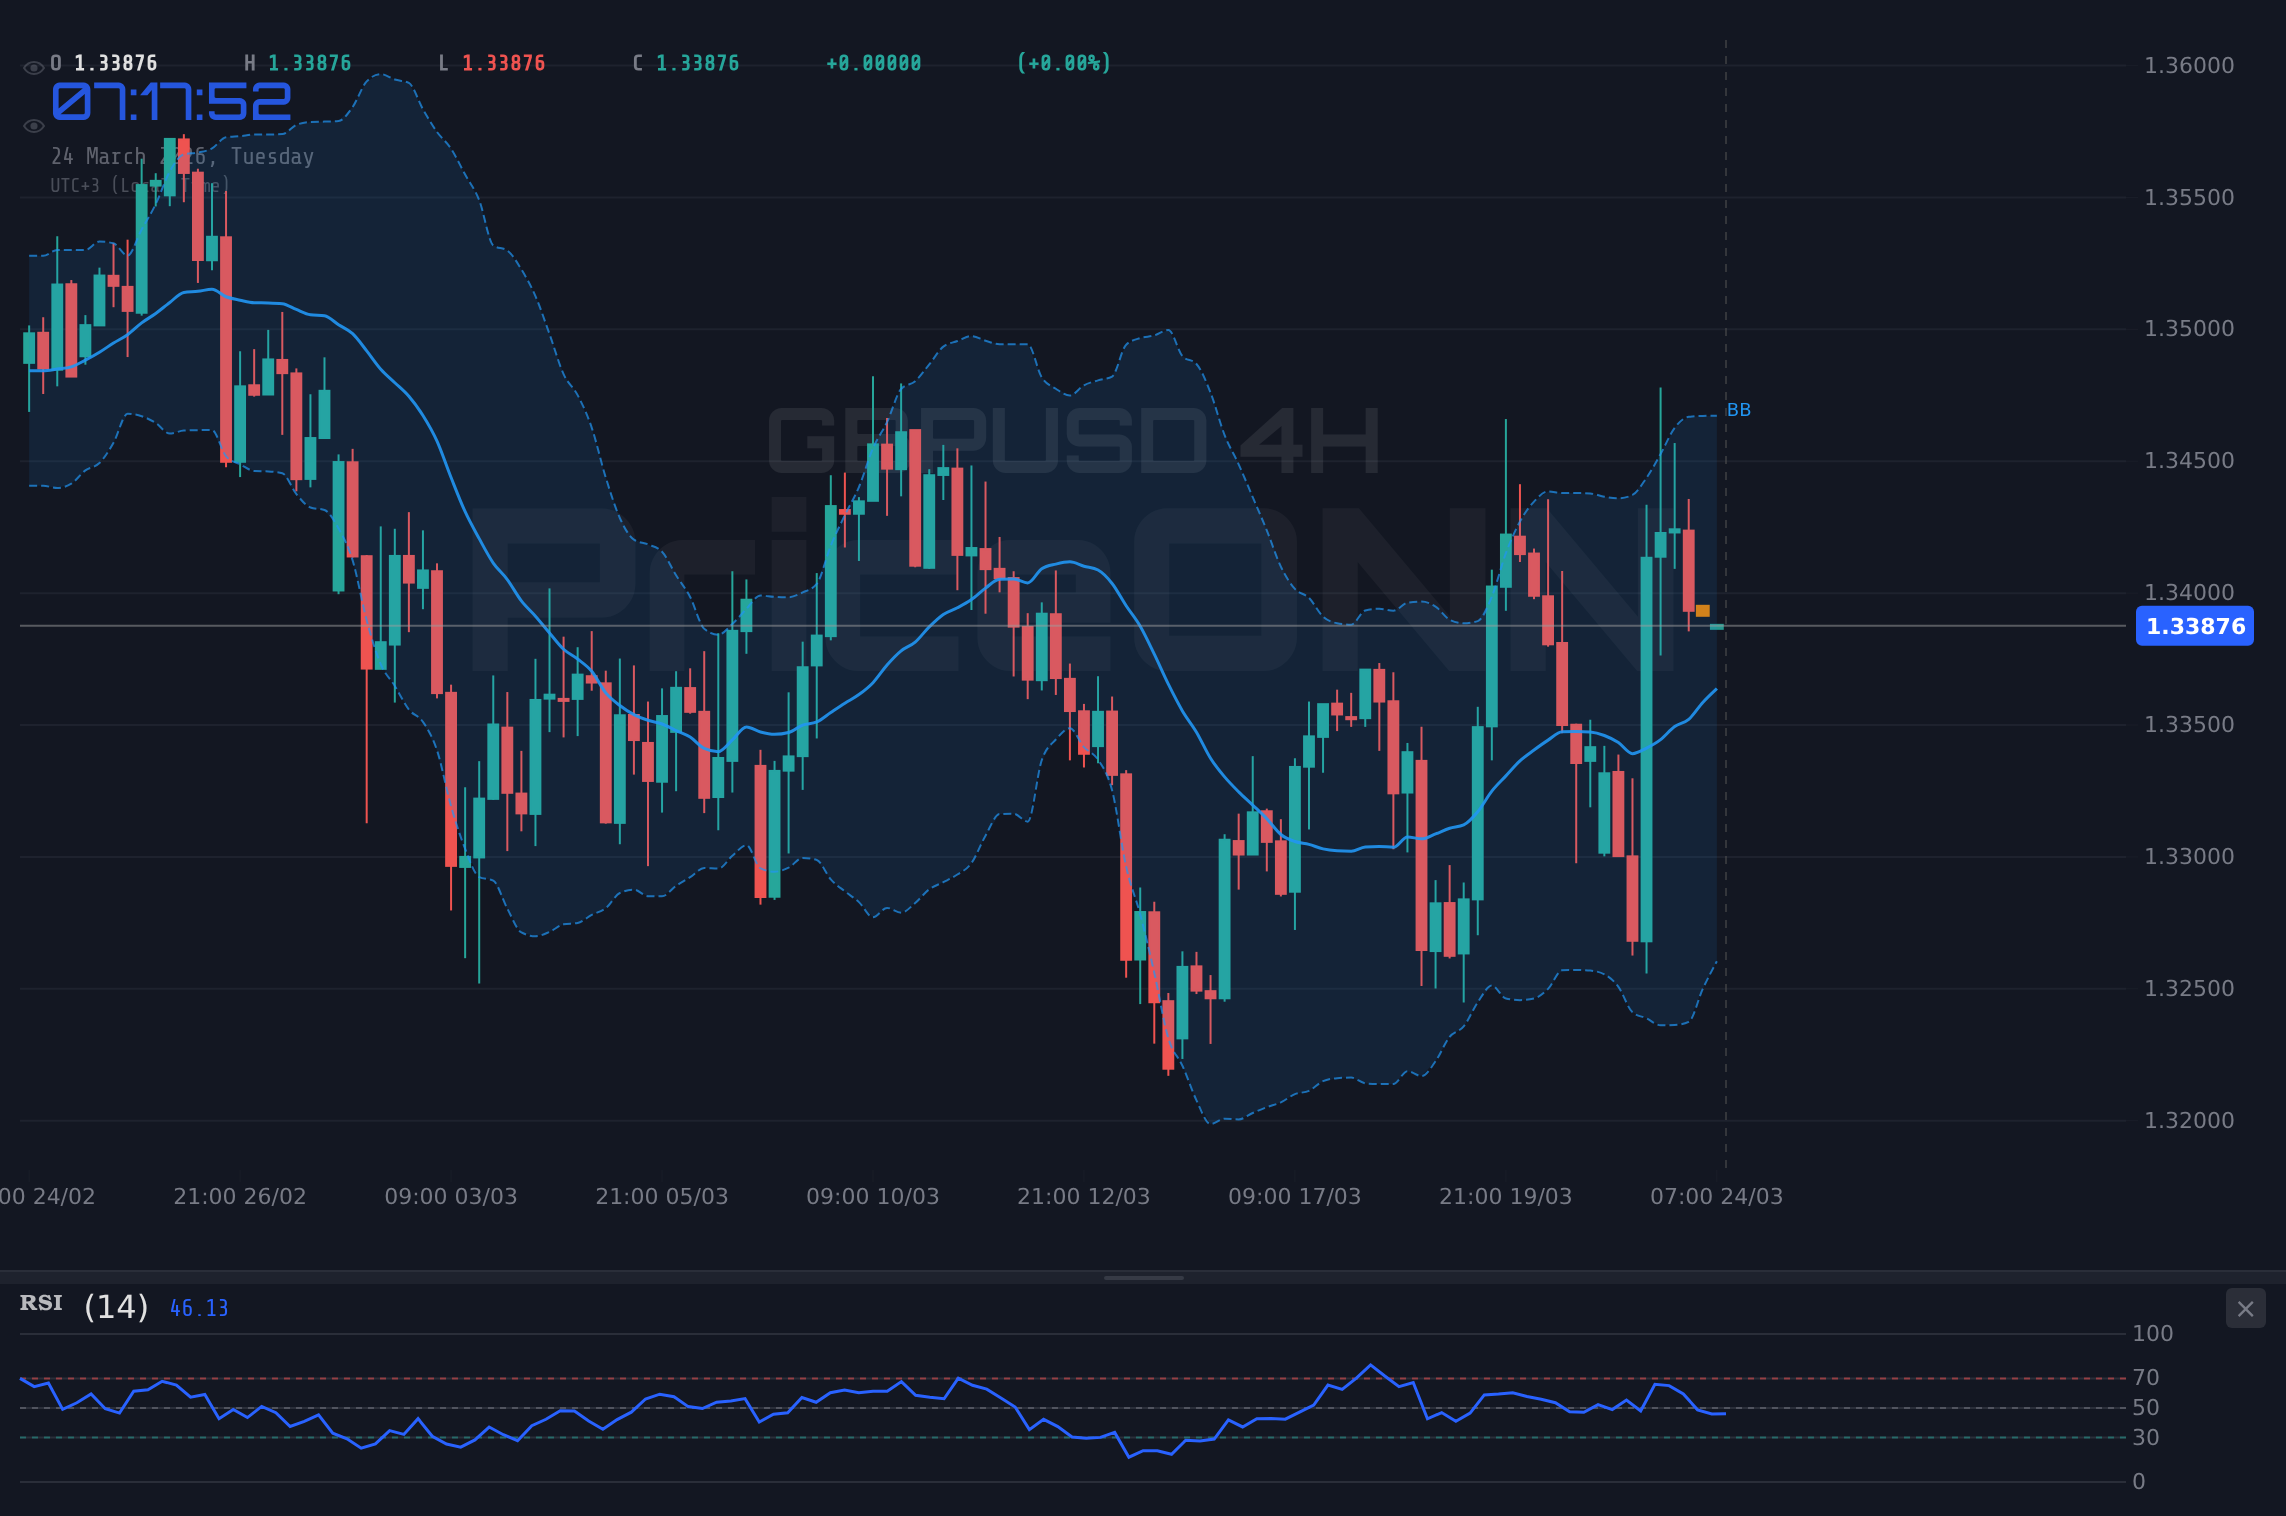
The relentless tug-of-war between bulls and bears has brought GBPUSD to a pivotal juncture, currently testing the waters just above the $1.34 mark. This isn't just another trading day; it's a critical moment where the market sentiment for the British Pound against the US Dollar hangs in the balance. With the latest market data showing GBPUSD trading at $1.33892, the pair is dancing around a significant resistance level, specifically eyeing the $1.35162 mark. The question on every trader's mind is: will this resistance hold, leading to a renewed downtrend, or will the bulls finally break through, signaling a more substantial rally? This analysis will dissect the competing forces at play, examining the fundamental drivers, technical signals, and macroeconomic correlations shaping this crucial currency pair's trajectory.
- GBPUSD is currently trading at $1.33892, hovering near significant resistance.
- The 1-hour RSI at 52.3 indicates neutral momentum with a slight upward bias, while the 4-hour RSI at 55.03 suggests similar neutral conditions.
- Key support levels for GBPUSD are identified at $1.33824 (S1) and $1.33556 (S2), with resistance eyed at $1.3451 (R1) and $1.34778 (R2).
- Geopolitical easing, as hinted by recent news, could support risk appetite, potentially benefiting GBPUSD if it translates into sustained dollar weakness.
The current market environment is a complex tapestry woven with threads of geopolitical developments, central bank policy expectations, and shifting risk appetite. Recent news suggests a potential easing of geopolitical tensions, which typically boosts market sentiment and encourages a move away from safe-haven assets like the US Dollar. Reports indicate that President Trump's Iran truce has bolstered the Euro, and while not directly GBPUSD, it hints at a broader trend of de-escalation that could impact the dollar's strength. This backdrop provides a fertile ground for the bulls to make their case, arguing that any sustained dip in the dollar index (DXY), currently at 99.23, could propel GBPUSD higher. The 1-hour chart shows DXY at 99.23, with a neutral-to-bullish signal, but the 4-hour chart presents a bearish outlook for the dollar. This divergence in DXY signals adds another layer of complexity to the GBPUSD picture.
The Bull Case: A Breakout Above $1.3451?
For the bulls, the narrative hinges on the idea that the British Pound is poised for a rebound, driven by improving global risk sentiment and potentially a less hawkish stance from the Bank of England. The latest market data paints a mixed but ultimately encouraging picture for the pound in the short term. On the 1-hour chart, GBPUSD shows a neutral trend with a 50% strength score, but the RSI(14) is at 52.3, suggesting a slight upward momentum. More compellingly, the 4-hour chart displays a neutral trend with a bullish signal (7 Buy, 1 Sell), and the RSI(14) at 55.03 further supports this positive bias. The Stochastic oscillator on the 4-hour timeframe shows K=70.94 and D=34.06, a clear bullish crossover signaling potential upside. This suggests that while the daily trend remains bearish, the intraday and short-term momentum could be shifting.
Furthermore, the bulls will point to the broader economic context. If global geopolitical tensions continue to ease, as suggested by recent headlines about a potential Iran truce, this could lead to reduced demand for the safe-haven US Dollar. The DXY, currently at 99.23, shows mixed signals across timeframes, but a sustained move lower would undoubtedly benefit GBPUSD. The bulls argue that the market has already priced in much of the negative sentiment, and any positive surprises from upcoming UK economic data, such as PMI or employment figures, could provide the catalyst for a move above the $1.3451 resistance level. They are looking for a decisive break above the R1 resistance at $1.3451, with a secondary target at $1.34778 (R2), as confirmation of a bullish reversal. The ADX on the 1-hour chart at 28.47 indicates a strong uptrend, which, if sustained, could fuel further gains.
Technical Underpinnings for the Bulls
Delving deeper into the technicals, the 1-hour MACD is currently negative but showing signs of potentially crossing its signal line, which would add to the bullish case. The Bollinger Bands on the 1-hour chart are below the middle band, indicating a bearish short-term trend, but the price is hovering near the middle band, suggesting a potential inflection point. The key here is the confluence of signals: while the daily trend is bearish, the shorter timeframes show increasing bullish momentum. The bulls are essentially betting on a short-term trend continuation that could eventually challenge the longer-term bearish outlook. They need to see price action consistently hold above the $1.33892 level and push decisively through the $1.3451 resistance. A close above this level on the 4-hour chart would be a strong signal, potentially targeting higher resistance levels.
The ADX value of 28.47 on the 1-hour chart, while indicating a strong uptrend, needs to be viewed in conjunction with other indicators. The overall market sentiment, influenced by global events and central bank rhetoric, will be crucial. If the US Dollar continues to weaken across the board, it will provide a tailwind for GBPUSD. The bulls are looking for confirmation that the current uptrend on the shorter timeframes is not just a temporary bounce but the start of a more sustained move. They would be reassured by increasing trading volumes accompanying any upward price action, suggesting genuine buying interest rather than just short-covering.
The Bear Case: Resistance Holds, Downtrend Resumes
On the flip side, the bears see the current price action as a temporary reprieve before the established downtrend reasserts itself. Their argument is grounded in the persistent strength of the US Dollar, driven by a resilient US economy and a Federal Reserve that may maintain a hawkish stance for longer than anticipated. Despite the easing of geopolitical tensions, the fundamental economic picture in the US often takes precedence. The DXY's overall strength, particularly its 1-day trend showing a 91% bullish strength, cannot be ignored. Even with mixed signals on shorter timeframes, the long-term outlook for the dollar remains robust according to many analysts, which inherently puts downward pressure on GBPUSD.
Technically, the bears are drawing attention to the daily timeframe, which presents a more bearish picture. The 1D trend for GBPUSD is classified as 'Düşüş' (Downtrend) with 90% strength. The daily RSI(14) is at 48.5, indicating a slight bearish inclination. The MACD on the daily chart shows positive momentum but remains below the signal line, suggesting that while there's underlying buying pressure, it hasn't yet translated into a full bullish reversal. Crucially, the price is trading below the middle Bollinger Band on the daily chart, a bearish signal. The bears are focused on the $1.33892 current price acting as a resistance, and they anticipate a rejection from the nearby resistance levels, particularly $1.3451 (R1) and $1.34778 (R2). A failure to break higher here would likely lead to a retest of the support levels, starting with S1 at $1.33824 and potentially S2 at $1.33556.
Technical Hurdles for the Bulls
The bears highlight the conflicting signals across different timeframes as a sign of indecision and potential reversal. While the 1-hour and 4-hour charts might show some bullish flickers, the dominant daily trend is bearish. The Stochastic oscillator on the daily chart shows K=64.38 and D=49.11, a bullish crossover, but this occurs in the neutral zone and needs to be confirmed by other indicators. The ADX on the daily chart at 29.21 indicates a strong downtrend, suggesting that any upward moves might be short-lived counter-trend rallies. They are looking for a clear failure at the resistance levels, followed by a break below the $1.33824 support, as confirmation that the downtrend is resuming. The lack of strong bullish conviction on longer timeframes is their primary technical argument.
Moreover, the bears are watching for any shifts in central bank rhetoric. Should the Bank of England signal a more dovish outlook, or if Fed officials reiterate a commitment to higher-for-longer interest rates, it would strengthen the case for a weaker GBPUSD. The market's reaction to upcoming economic data will be paramount. If key UK economic indicators, such as inflation or retail sales, come in weaker than expected, it could quickly extinguish any bullish hopes and send GBPUSD lower. They are particularly wary of the current price action being a 'bear trap' – a temporary upward move designed to lure buyers before a sharp decline.
The Verdict: A Precarious Balance at $1.34
Currently, GBPUSD is caught in a classic bull vs. bear tug-of-war around the $1.34 psychological level and the immediate resistance zone. The technical picture is fragmented, with shorter timeframes showing some bullish signs while the daily chart maintains a bearish bias. The bulls have the immediate momentum on their side, fueled by potential easing geopolitical risks and mixed DXY signals. They are targeting a break above $1.3451 to confirm their thesis. However, the bears have the backing of a stronger daily trend and the overarching fundamental strength often associated with the US Dollar. They are waiting for a rejection at resistance and a subsequent fall below $1.33824 to confirm their bearish outlook.
The critical factor will be how the market digests upcoming economic data and any further central bank commentary. If the US Dollar continues to weaken and risk appetite holds firm, GBPUSD could indeed push higher. However, any sign of renewed dollar strength or concerning UK economic data could quickly reverse the current sentiment. For now, the $1.34 level represents a crucial battleground. Traders should exercise caution, as the conflicting signals suggest a period of consolidation or a sharp move in either direction is possible. The probability seems to lean slightly towards the bears given the daily trend, but the short-term momentum cannot be entirely dismissed. Patience and risk management are paramount as the market navigates this indecisive phase.
Bearish Scenario: Downtrend Resumes
65% ProbabilityBullish Scenario: Resistance Breakout
25% ProbabilityNeutral Scenario: Consolidation Phase
10% ProbabilityFrequently Asked Questions: GBPUSD Analysis
What happens if GBPUSD breaks above the $1.3451 resistance level?
A sustained break above $1.3451 (R1) on a 4-hour chart, supported by strong volume, would invalidate the immediate bearish outlook. This scenario, with a 25% probability, targets $1.34778 (R2) as the next key level, potentially opening the door for further upside towards $1.35162.
Should I consider buying GBPUSD at current levels near $1.33892 given the mixed signals?
Buying at current levels carries risk due to the daily bearish trend and strong resistance nearby. The bullish scenario requires confirmation above $1.3451. If you are considering a long position, wait for a clear breakout or a confirmed bounce from support around $1.33556, managing risk tightly with a stop below $1.33300.
Is the RSI at 52.3 on the 1-hour chart a buy signal for GBPUSD?
An RSI of 52.3 is in neutral territory, indicating a slight upward bias but not a definitive buy signal on its own. While it supports the short-term bullish momentum, it needs to be corroborated by other indicators and a confirmed break of resistance. The daily chart's bearish undertones suggest caution with relying solely on this RSI reading.
How will upcoming UK employment data potentially affect GBPUSD this week?
Stronger-than-expected UK employment figures could bolster the GBPUSD's bullish case, potentially driving it above resistance levels. Conversely, weaker data would reinforce the daily downtrend and could lead to a sell-off towards support at $1.33556. The market's reaction will depend on how these figures influence Bank of England rate expectations.
Track markets in real-time
AI-powered analysis, technical indicators and real-time price data.
Join Our Telegram Channel
Breaking market news, AI analysis and trading signals instantly.
Join Channel