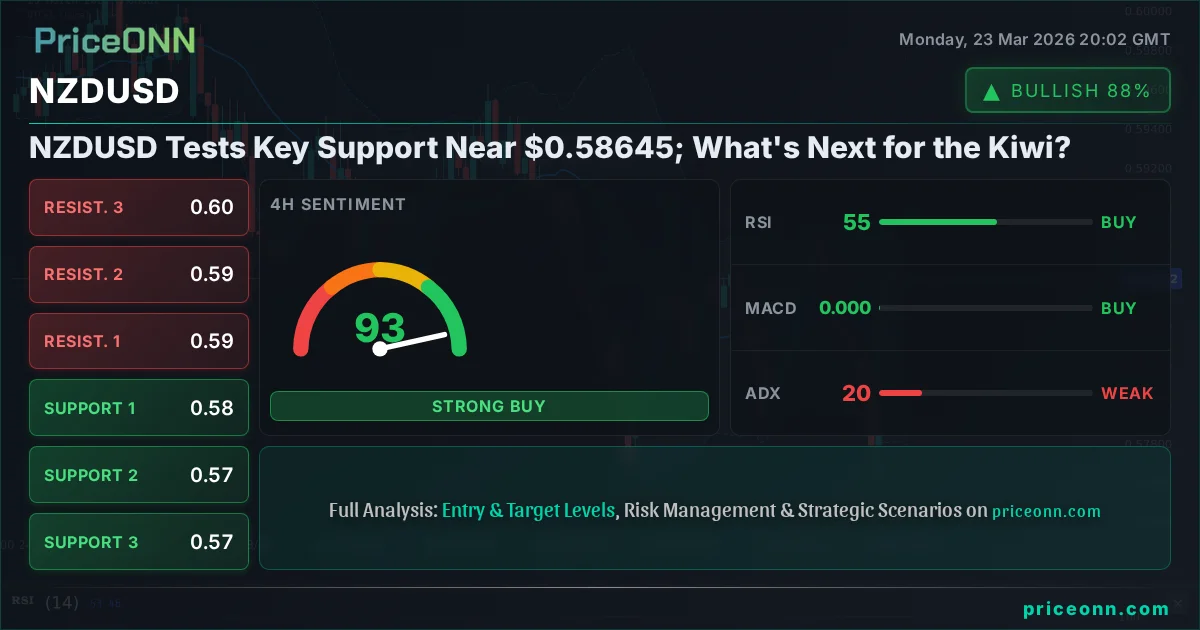
NZDUSD Tests Key Support Near $0.58645; What's Next for the Kiwi?
NZDUSD hovers around $0.58645, testing critical support. With a mixed technical outlook and upcoming economic data, traders watch for clear direction.
The New Zealand Dollar (NZDUSD) is currently navigating a pivotal juncture, trading precariously close to the $0.58645 mark. After a period of volatility, the pair has retreated, bringing it to a significant support level that warrants a closer look from traders and analysts alike. This consolidation phase, occurring amidst shifting global economic winds and central bank policy whispers, presents a complex picture, demanding a deep dive into both the technical charts and the underlying fundamental drivers. The question on many minds is whether this support level will hold, paving the way for a potential recovery, or if the bearish pressures will prevail, pushing the Kiwi further down.
- NZDUSD is currently trading at $0.58645, testing key support levels.
- The 1-Day RSI reading of 41.86 suggests a bearish trend, but the Stochastic Oscillator shows a potential buy signal from oversold territory.
- Key support is identified at $0.57991, with resistance looming at $0.58731.
- Upcoming economic events, particularly from the US and New Zealand, could significantly influence the pair's direction.
The recent price action for NZDUSD has been characterized by a noticeable downturn, a trend that has brought it to a critical support zone. On the 1-Day chart, the Relative Strength Index (RSI) sits at 41.86. While this is not yet in oversold territory, it indicates a prevailing bearish sentiment that has been building. However, the Stochastic Oscillator offers a contrasting signal. With %K at 35.50 and %D at 30.39, it's showing a potential bullish crossover from oversold conditions, hinting that the downward momentum might be exhausting. This divergence between the RSI and Stochastic is a classic example of the nuanced signals traders often face, requiring careful interpretation rather than a blind adherence to any single indicator. The ADX at 28.96 on the daily chart further reinforces the idea of a strong trend, albeit a downward one, suggesting that any move against this trend needs significant conviction.
Delving into the shorter timeframes provides more granular insights. On the 1-hour chart, the NZDUSD pair is showing a slightly more constructive picture, with an RSI of 58.04 and a positive MACD momentum. The Stochastic Oscillator, flashing K=85.78 and D=83.15, is in overbought territory, suggesting a potential pullback in the immediate short term, even as the overall trend on this timeframe appears to be consolidating around the mid-band of the Bollinger Bands. The ADX at 28.2 indicates a strong trend, which could be a continuation of the bearish move or the start of a new bullish phase if key resistance levels are breached. This interplay between different timeframes highlights the importance of multi-timeframe analysis; what looks like a short-term opportunity might be counter-trend on a larger scale.
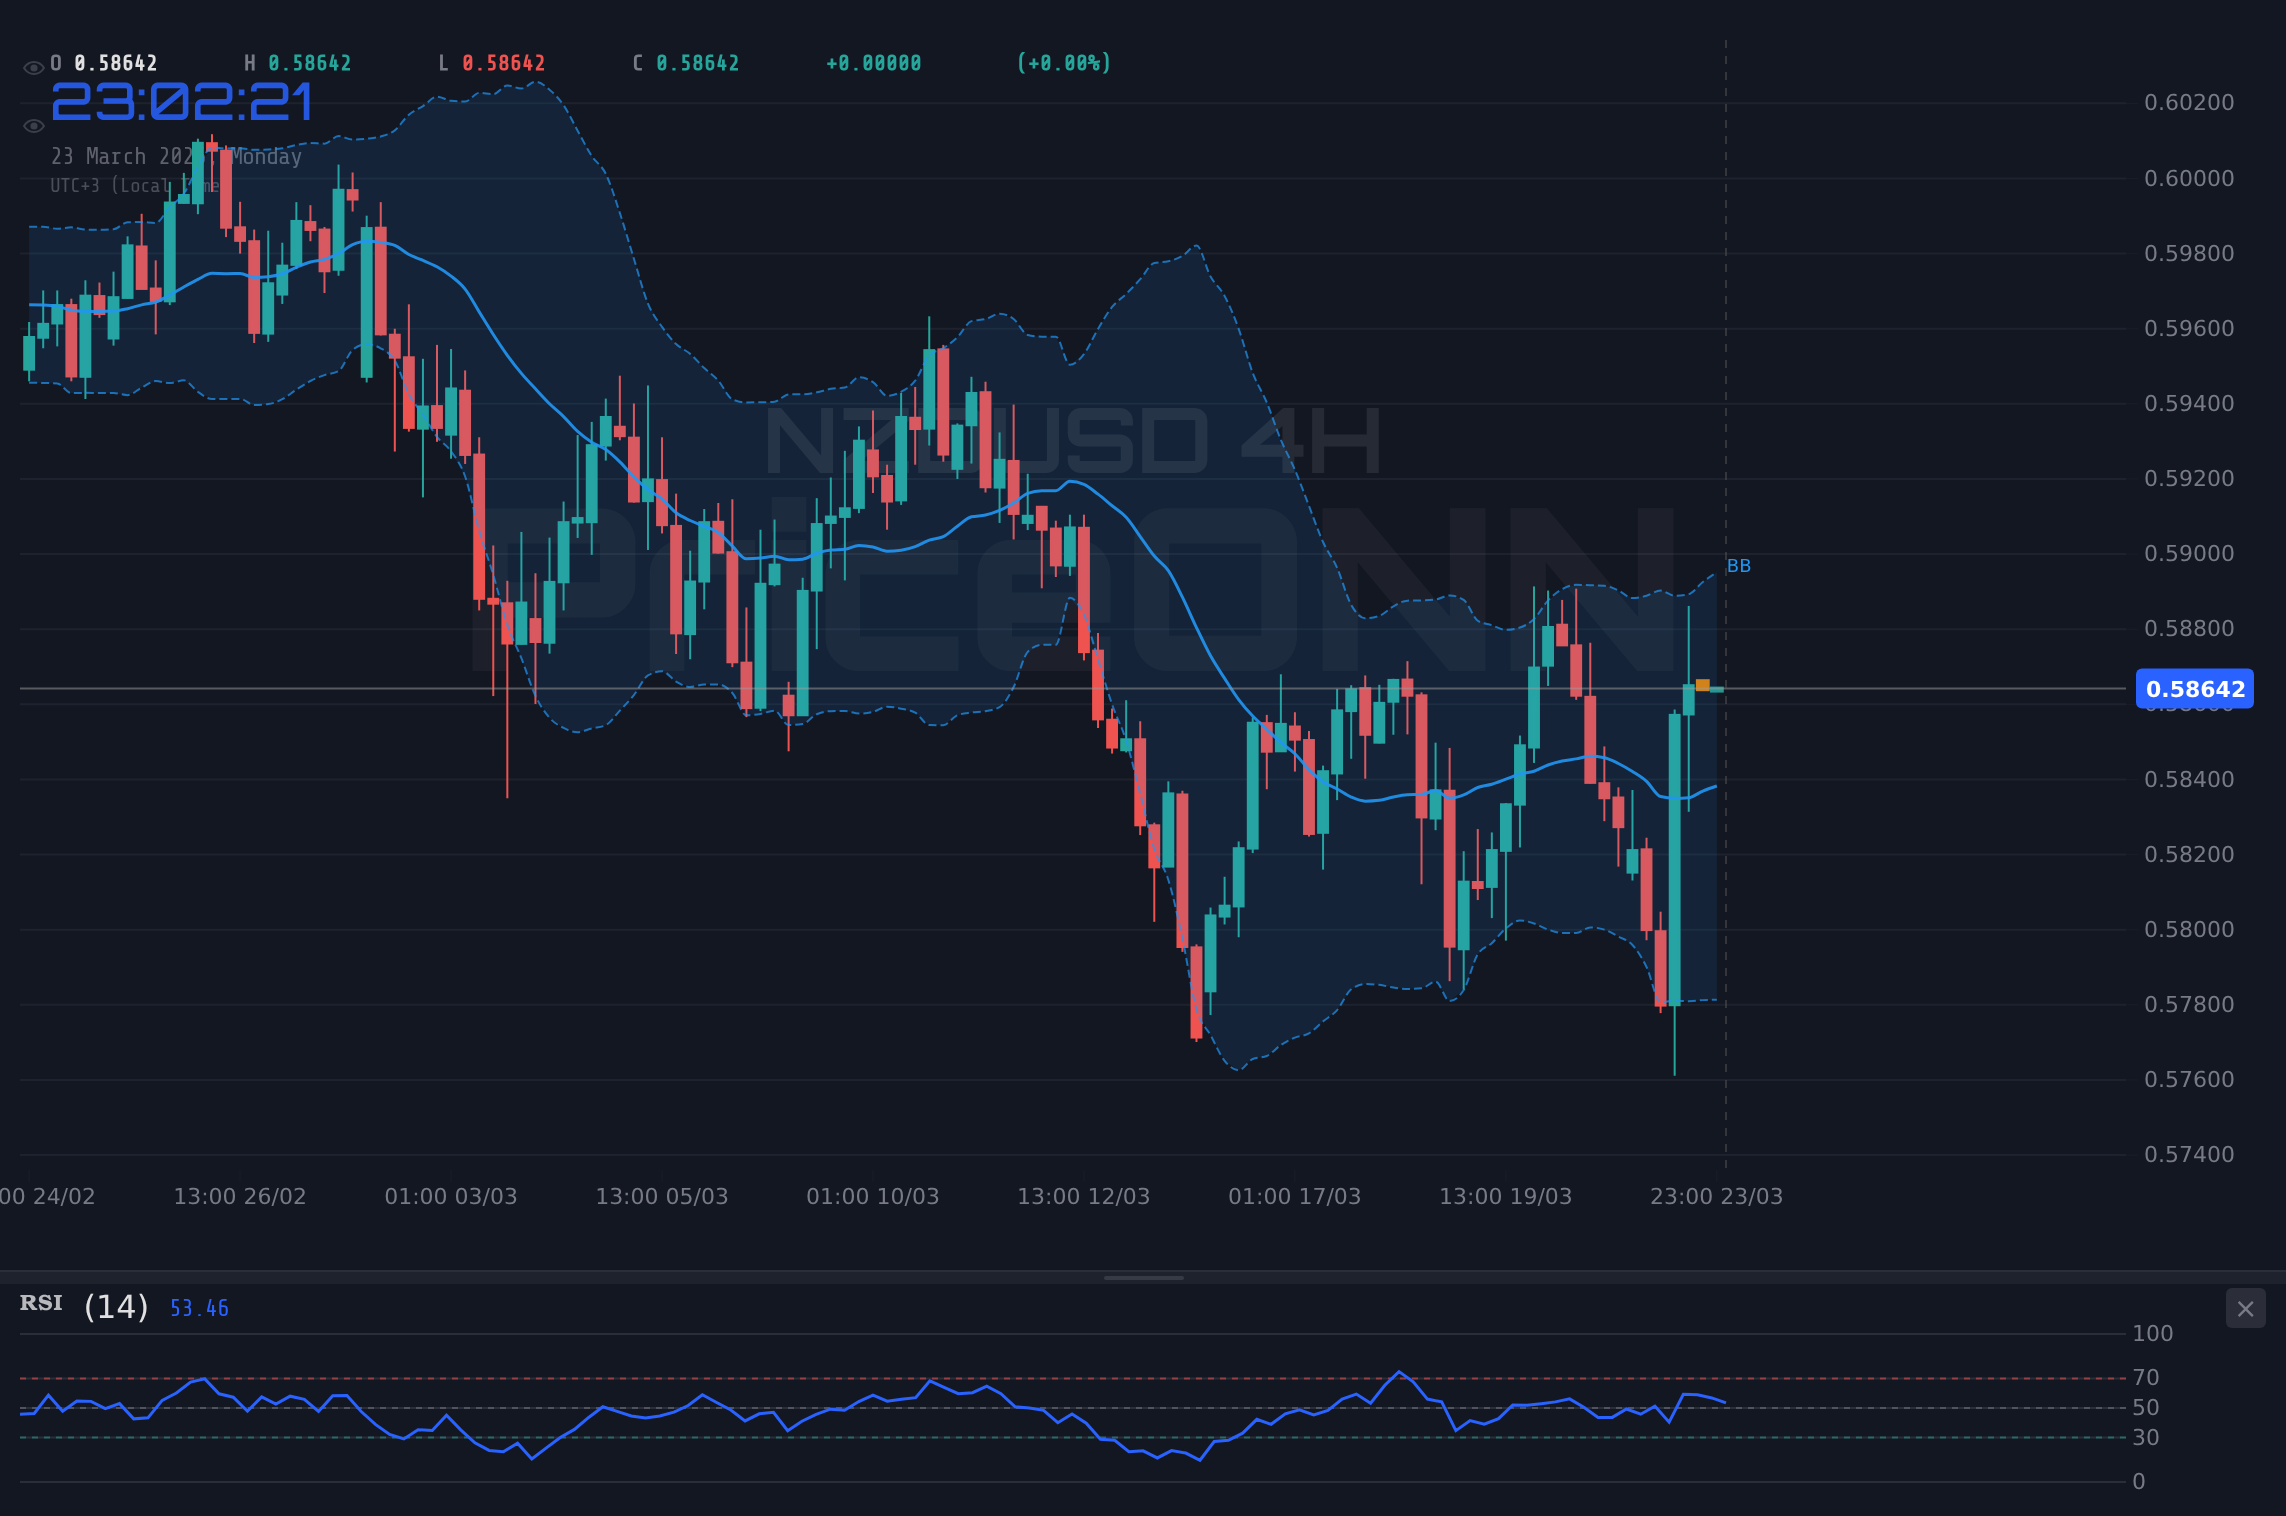
Looking at the 4-hour chart, the trend is decidedly bearish, with an ADX reading of 19.91 indicating a weak trend. However, the RSI at 55.3 and a positive MACD suggest a potential upward correction is brewing, despite the prevailing bearish sentiment. The Stochastic Oscillator, with %K at 52.02 and %D at 27.46, is showing a bullish crossover from oversold conditions, reinforcing the possibility of a short-term bounce. This is where the concept of mean reversion comes into play; after a significant move, prices often snap back towards their average. The question is whether this is a temporary pause in a larger downtrend or the beginning of a more substantial reversal. The fact that the ADX is relatively low here suggests consolidation might be more likely than a strong trend reversal in the immediate term.
The broader market context cannot be ignored. The US Dollar Index (DXY) is currently at 98.9, showing a slight dip on the 1-hour chart but maintaining a strong bullish trend on the daily timeframe (ADX 34.66). A stronger dollar typically exerts downward pressure on pairs like NZDUSD, as it makes the Kiwi more expensive for holders of dollars. The DXY's daily RSI at 53.54 indicates a neutral-to-bullish sentiment, suggesting that dollar strength could persist, acting as a headwind for NZDUSD. Meanwhile, global equity markets, represented by the SP500 (currently at 6575.25) and Nasdaq (at 24171.87), are showing mixed signals. The SP500's daily chart indicates a strong bearish trend (ADX 46.22), while Nasdaq's is also bearish (ADX 37.63). This risk-off sentiment in equities could paradoxically support the US Dollar as a safe-haven asset, further complicating the outlook for risk-sensitive currencies like the NZD.
The commodity markets also offer clues. Gold (XAUUSD) is trading at $4388.86, showing a significant daily drop of -2.41%. This decline, coupled with a very strong bearish trend indicated by the daily ADX of 63.88 on the 4-hour chart, suggests that safe-haven demand might be waning, or that broader market liquidation is occurring. Silver (XAGUSD) is showing a more mixed picture, currently at $68.8, with a strong bearish trend on the 4-hour (ADX 58.34) but a potential buy signal from oversold conditions on the daily (Stochastic K=18.73, D=18.94). The sharp drop in gold prices, despite ongoing geopolitical tensions, is a noteworthy development that could signal a shift in market sentiment away from traditional safe havens towards dollar strength.
Geopolitically, the news flow suggests escalating tensions in the Middle East, which typically boosts demand for safe-haven assets like the US Dollar. Recent reports indicate a surge in demand for the USD as global tensions rise, which directly impacts NZDUSD. This backdrop of geopolitical uncertainty, combined with a hawkish stance from the US Federal Reserve, creates a challenging environment for riskier currencies. While the Indian oil basket surges, domestic prices remain steady, highlighting complex global energy dynamics that can influence inflation expectations and, consequently, central bank policies. The recent plunge in silver prices, attributed to Fed hawkishness and dollar strength, underscores the broad pressure being exerted on commodities and risk assets.
From a fundamental perspective, the economic calendar holds the key to NZDUSD's next move. Investors are keenly awaiting key data releases from both New Zealand and the United States. New Zealand's upcoming economic data, such as inflation figures and GDP growth, will be crucial in shaping the Reserve Bank of New Zealand's (RBNZ) monetary policy outlook. Any signs of persistent inflation or robust economic growth could bolster the Kiwi, while weaker data might reinforce the bearish trend. On the US side, Non-Farm Payrolls (NFP) and Consumer Price Index (CPI) reports are always closely watched. Stronger-than-expected US data would likely reinforce the Fed's hawkish stance, potentially leading to further dollar strength and putting more pressure on NZDUSD. The interplay between these two economies' data will be critical in determining the pair's trajectory.
The technical picture at the $0.57991 support level is particularly interesting. This level represents a significant consolidation zone observed in the past, and its retest is a critical moment. If NZDUSD can hold above $0.57991, we might see a retest of the $0.58731 resistance. A break above this resistance, especially with increasing volume and positive momentum across multiple timeframes, could signal a more sustained bullish reversal. However, a decisive close below $0.57991 on the daily chart would likely invalidate this support and open the door for further downside, potentially targeting the next support level at $0.57710. The strength of the trend indicated by the ADX on the daily chart (28.96) suggests that any move away from these levels will likely have conviction behind it.
The current market sentiment, influenced by a strong dollar and risk-off tendencies in equities, leans bearish for NZDUSD. The daily technical signals are mixed: RSI points to a downtrend, but the Stochastic Oscillator is suggesting oversold conditions, which could precede a bounce. The 1-hour chart offers a slightly more bullish immediate outlook, but this could be a short-term correction within a larger bearish trend. The key will be how the pair reacts to the $0.57991 support. A failure to hold this level could lead to further declines, while a successful defense might initiate a corrective rally.
The Bullish Case: A Potential Bounce from Support
If NZDUSD manages to defend the critical support near $0.57991, we could witness a significant bounce. This scenario hinges on the pair holding firm above this psychological and technical level. The daily Stochastic Oscillator, currently showing a bullish crossover from oversold conditions (K=35.50, D=30.39), provides a glimmer of hope for the bulls. For this bullish thesis to gain traction, we would need to see a sustained move above the immediate resistance at $0.58731. Confirmation would come from increased buying volume on the 1-hour and 4-hour charts, coupled with a positive shift in the MACD momentum. A successful breach of $0.58731 could then target the next resistance level at $0.59190. This would suggest that the recent downtrend was merely a correction within a larger, yet-to-be-established, uptrend. The strength of this move would also depend on softening geopolitical tensions and any dovish signals from the US Federal Reserve, which would weaken the DXY and provide a tailwind for the Kiwi.
The Bearish Scenario: Support Breakdown and Further Declines
Conversely, the bearish scenario remains a significant probability, especially given the prevailing dollar strength and risk-off market sentiment. The daily chart shows a strong bearish trend with an ADX of 28.96. If the support at $0.57991 fails to hold, the path of least resistance would be downwards. The invalidation of this support could trigger a cascade of stop-loss orders, accelerating the decline. The immediate target in such a scenario would be the next significant support level at $0.57710. A break below this could then see NZDUSD testing $0.57251. This bearish outlook is supported by the daily RSI at 41.86, which, while not oversold, indicates substantial room for further downside before extreme levels are reached. The continued strength of the DXY and any hawkish rhetoric from the Fed would reinforce this bearish narrative.
Consolidation and Uncertainty: The Neutral Path
Given the conflicting signals between different timeframes and indicators, a period of consolidation is also a highly plausible outcome. The pair could remain range-bound between the key support at $0.57991 and the resistance at $0.58731 for a while. This neutral scenario is often characterized by choppy price action and indecisive market sentiment, awaiting a clearer catalyst. The weak trend indicated by the 4-hour ADX (19.91) supports this possibility. During such consolidation, traders might look for smaller opportunities within the range or wait for a decisive breakout in either direction. The market may be in a 'wait-and-see' mode, digesting recent news and anticipating upcoming economic data releases. This phase can be frustrating for traders seeking clear directional trades but offers opportunities for range-bound strategies if managed carefully.
Trading forex, particularly pairs like NZDUSD, involves substantial risk and may not be suitable for all investors. Leverage can work against you as well as for you. The past performance of any trading system or methodology is not indicative of future results. You should never invest money that you cannot afford to lose. Before deciding to trade the foreign exchange markets, you should carefully consider your investment objectives, level of experience, and risk appetite. High volatility can lead to rapid and significant losses. Always conduct your own due diligence and consult with a qualified financial advisor.
| Indicator | Value | Signal | Interpretation |
|---|---|---|---|
| RSI (14) | 41.86 | Bearish | Trend Strength |
| MACD Histogram | -0.003 | Bearish | Momentum Weakness |
| Stochastic (%K/%D) | 35.50 / 30.39 | Bullish Crossover | Potential Oversold Bounce |
| ADX | 28.96 | Strong Trend | Clear Directional Move Likely |
| Bollinger Bands | Middle Band | Watch | Price trading below Mid Band |
Bearish Scenario: Downside Breakout
65% ProbabilityNeutral Scenario: Consolidation Range
25% ProbabilityBullish Scenario: Support Holds, Reversal Begins
10% ProbabilityFrequently Asked Questions: NZDUSD Analysis
What happens if NZDUSD breaks below the $0.57991 support level?
A break below $0.57991 on a daily closing basis would likely invalidate the immediate support and could trigger further selling pressure. The next key targets would then be around $0.57710 and potentially $0.57251, as bearish sentiment would be reinforced.
Should I buy NZDUSD at current levels near $0.58645 given the mixed signals?
Buying at current levels carries risk due to the prevailing bearish trend and proximity to support. While the daily Stochastic Oscillator suggests a potential oversold bounce, confirmation is needed. A more prudent approach might be to wait for a clear hold of $0.57991 support or a confirmed break above $0.58731 resistance, indicating stronger bullish conviction.
Is the daily RSI at 41.86 a sell signal for NZDUSD right now?
An RSI of 41.86 on the daily chart indicates a bearish trend but is not yet in oversold territory. While it suggests downward momentum, it doesn't automatically signal a sell. The Stochastic Oscillator's bullish crossover from oversold conditions presents a conflicting signal, implying that the downtrend might be losing steam and a bounce is possible.
How will upcoming US Non-Farm Payrolls data affect NZDUSD this week?
Stronger-than-expected NFP data would likely boost the US Dollar due to potential Fed hawkishness, putting downward pressure on NZDUSD. Conversely, weaker NFP figures could weaken the dollar, offering some relief to the Kiwi and potentially supporting a move higher if support levels hold.
Track markets in real-time
AI-powered analysis, technical indicators and real-time price data.
Join Our Telegram Channel
Breaking market news, AI analysis and trading signals instantly.
Join Channel