AUDUSD Hovers Near $0.69218 as Oil Shock Rattles Asian Markets
AUDUSD trades near $0.69643, pressured by falling oil prices and a broader Asian market sell-off. Key support at $0.69218 is being tested as foreign funds flee the region.
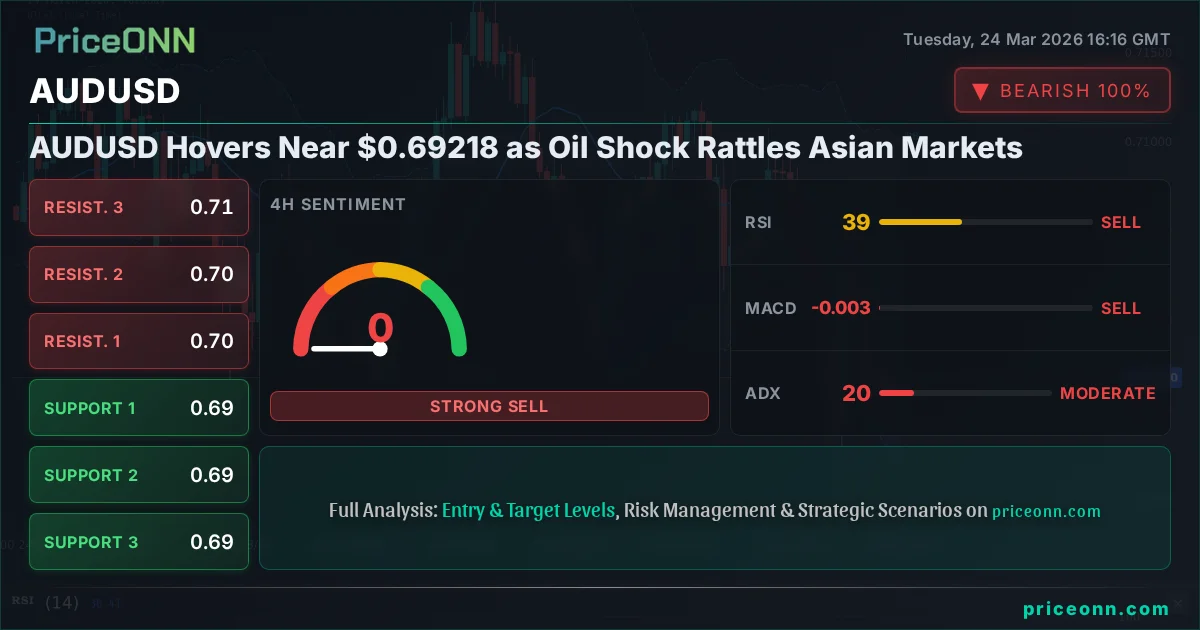
The Australian Dollar is facing significant headwinds, trading precariously close to the critical support level of $0.69218. This move comes as a dramatic surge in oil prices, particularly Brent crude hitting $103.96, sends shockwaves through Asian markets, prompting a sharp outflow of foreign capital. The AUDUSD pair is currently priced at $0.69643, reflecting a palpable risk-off sentiment that is weighing heavily on commodity-linked currencies.
- AUDUSD is testing support at $0.69218, currently trading at $0.69643 amidst a broad risk-off sentiment.
- Brent crude surged to $103.96, driving inflation concerns and impacting Asian equity markets, leading to significant foreign fund outflows.
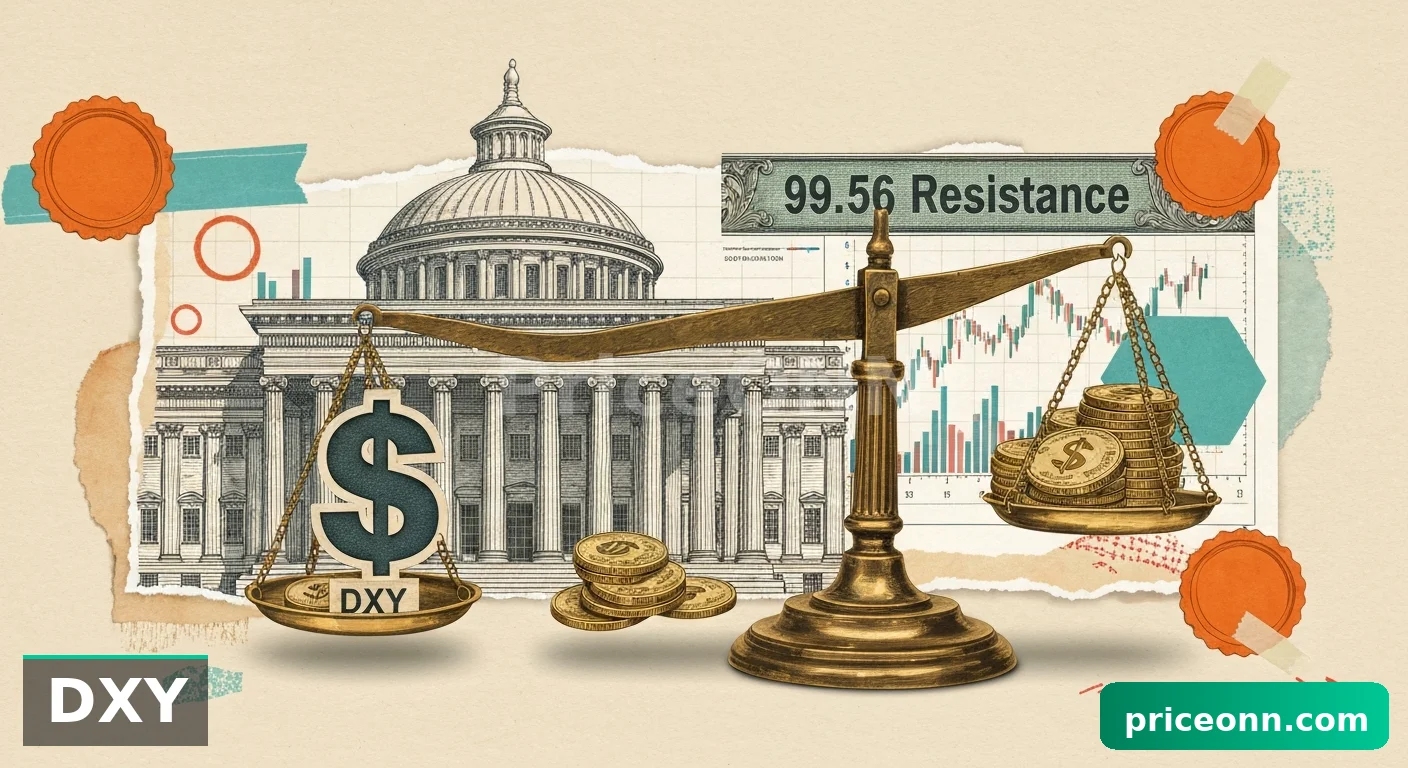
- The US Dollar Index (DXY) shows strength, trading at 99.21, adding pressure to AUDUSD as seen in its 1H and 4H technical signals.
- Technical indicators on AUDUSD's 1H chart suggest a bearish bias, with RSI at 43.28 and MACD showing negative momentum, despite a weak ADX at 12.72.
The Oil Surge: A Double-Edged Sword for the Aussie
The sharp ascent in Brent crude oil prices to $103.96 is a primary driver behind the current market turmoil. While higher energy prices can sometimes benefit commodity exporters like Australia, the speed and magnitude of this latest jump are stoking fears of renewed inflation and a potential global economic slowdown. This narrative is particularly concerning for Asian economies, which are heavily reliant on energy imports and are now seeing foreign investors rapidly pull capital. As reported by Reuters, foreign funds have ditched over $50 billion in Asian stocks, marking one of the largest outflows since 2008. This flight to safety is a direct headwind for currencies like the AUDUSD, which typically thrives in environments of stable global growth and risk appetite. The correlation is stark: as oil prices spike and geopolitical tensions simmer, the demand for perceived safe-haven assets, like the US Dollar, increases, putting downward pressure on riskier currencies such as the Australian Dollar.
The immediate impact on AUDUSD is evident. The pair has shed 0.56% today, currently trading at $0.69643, and is inching closer to its crucial support at $0.69218. This level is not just a technical floor; it represents a psychological benchmark that, if breached decisively, could trigger further sell-offs. The 1-hour technical indicators on AUDUSD paint a grim picture for the bulls. The RSI(14) is sitting at 43.28, firmly in neutral territory but trending downwards, suggesting selling momentum is building. The MACD is below its signal line, indicating negative momentum, and the Stochastic Oscillator shows a bearish crossover (%K < %D) with K at 27.63. While the ADX at 12.72 signals a weak trend, the confluence of these indicators on the shorter timeframes points towards further downside potential in the immediate term.
Asian Market Contagion and Capital Flight
The broader impact on Asian markets cannot be overstated. The 'oil shock,' as it's being termed, is dimming economic prospects across the region. Emerging markets, in particular, are vulnerable to such shocks. Higher energy costs translate to increased import bills, potentially widening current account deficits and fueling inflation. This scenario is precisely what's driving foreign investors to reassess their allocations, leading to the massive $50 billion exodus from Asian equities noted by news agencies. This is not just a short-term reaction; it signals a potentially longer-term shift in risk perception. As capital flees riskier Asian assets, it flows into perceived safe havens, with the US Dollar being a primary beneficiary. The DXY, or Dollar Index, is currently trading at 99.21, showing a clear upward trend on the daily chart (ADX 32.74) and positive signals on the 1-hour timeframe, reinforcing the pressure on AUDUSD.
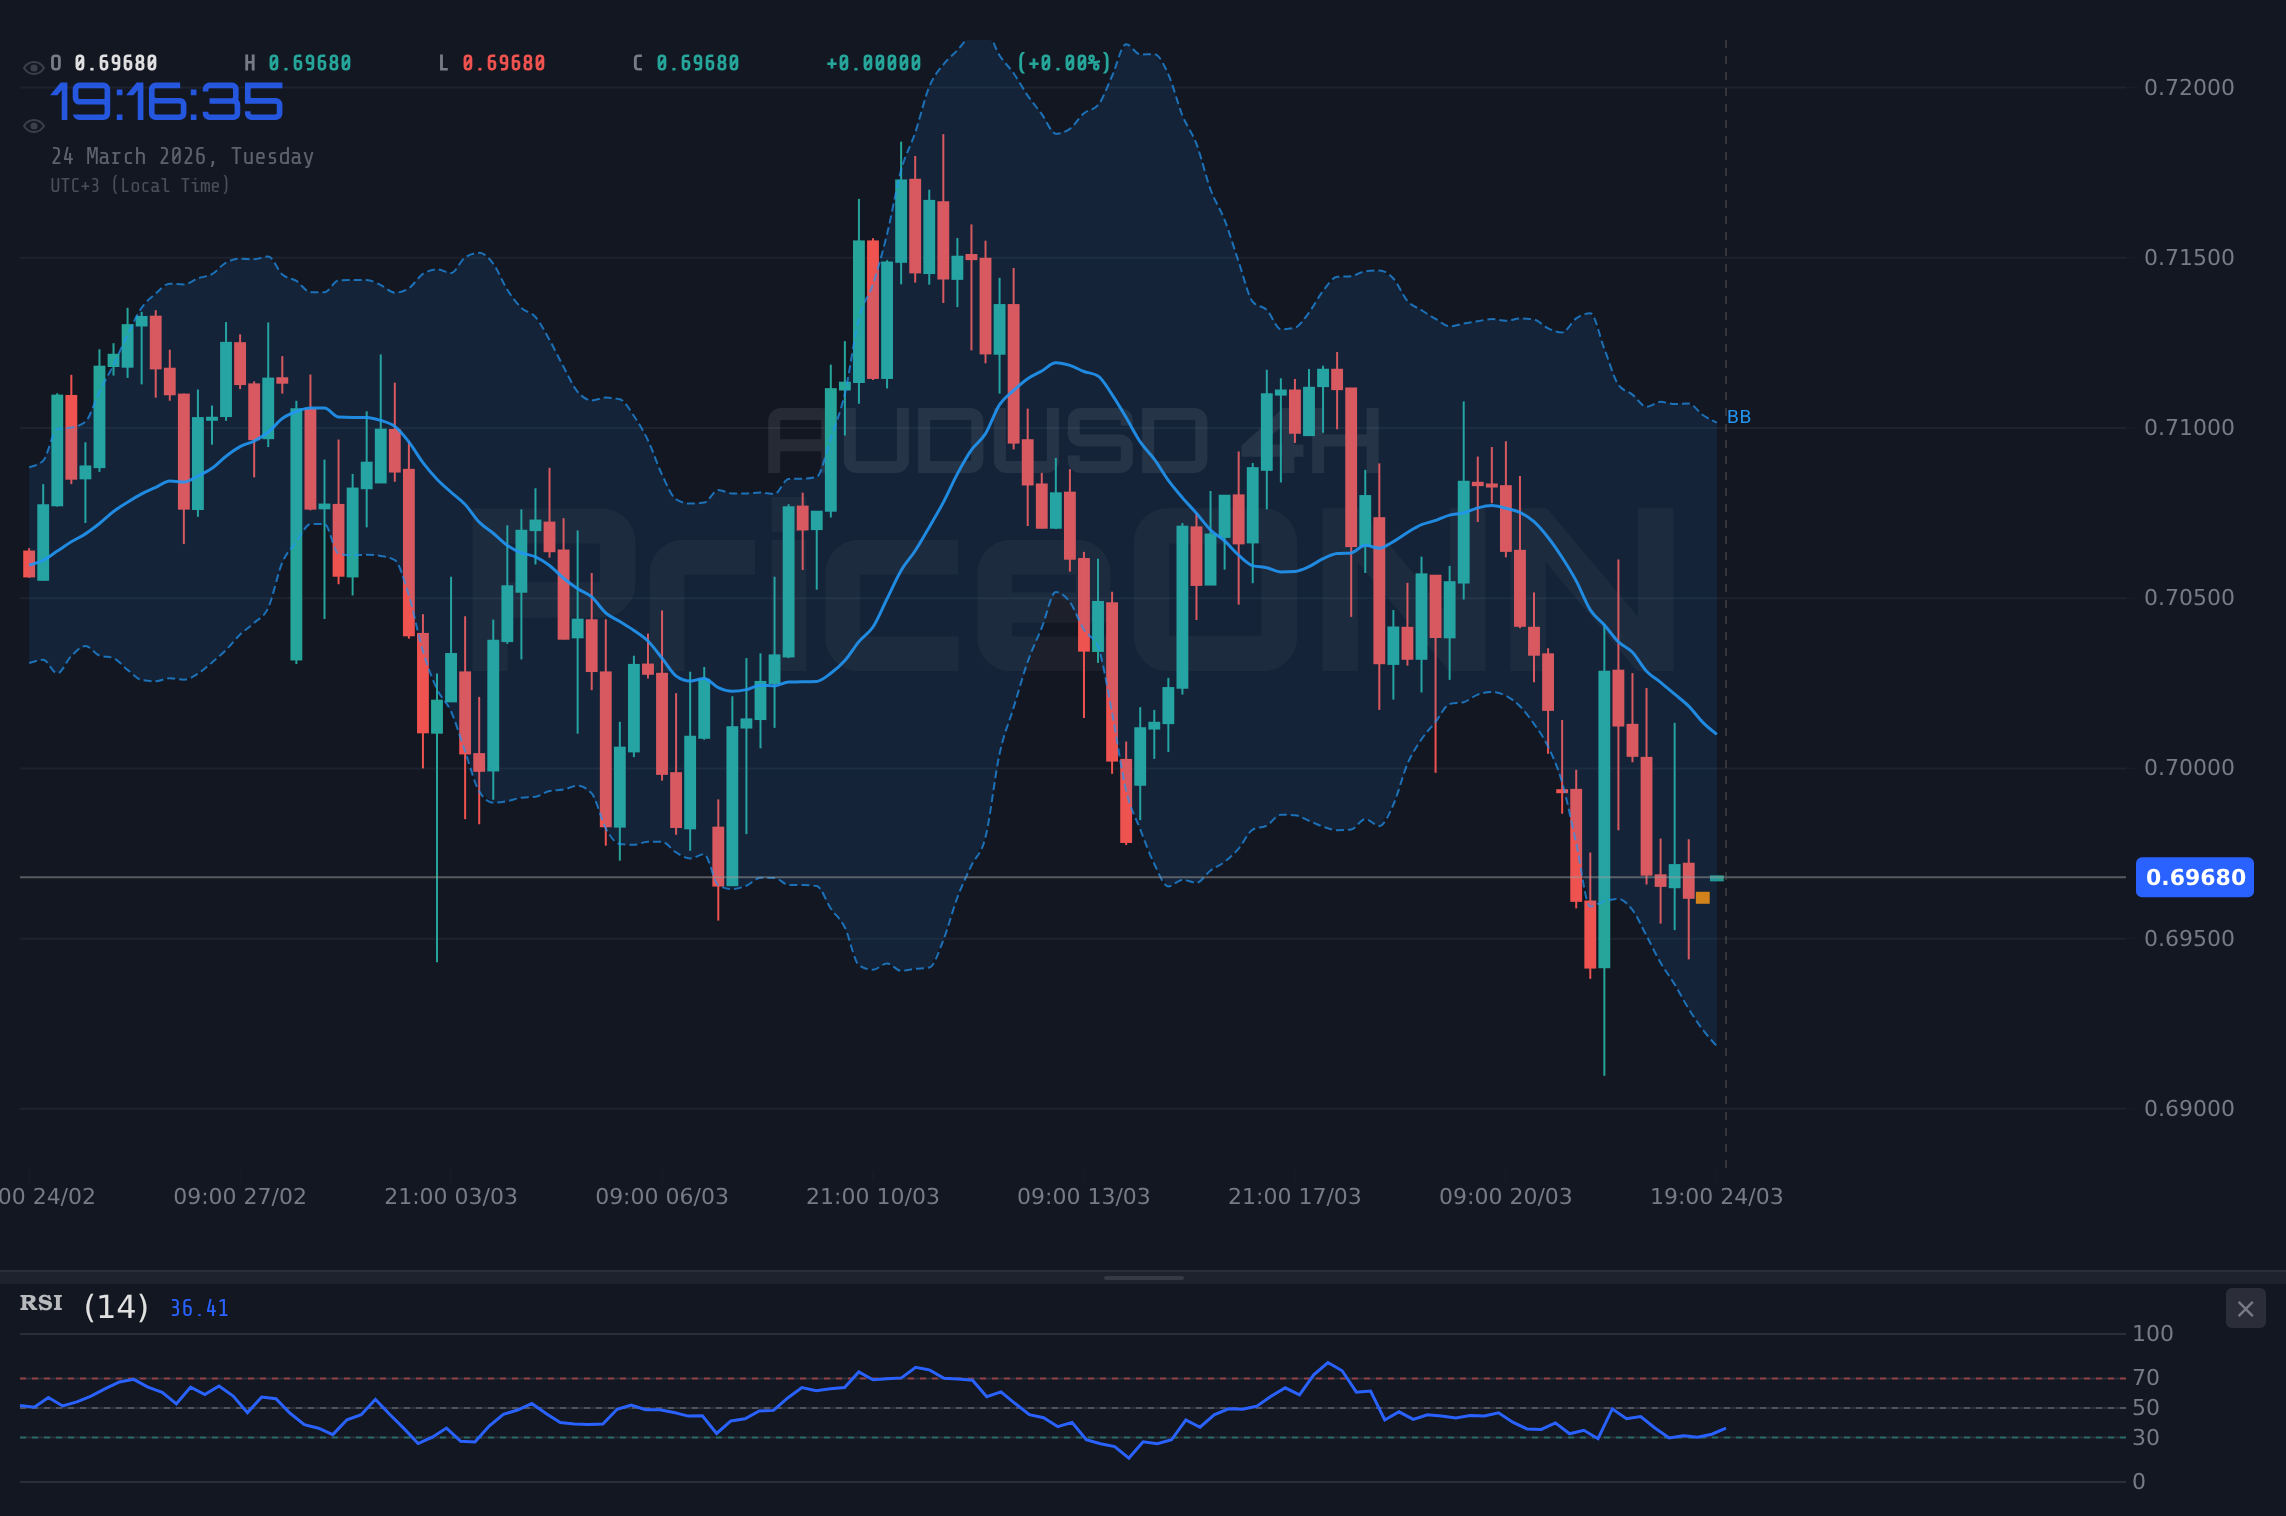
This capital flight creates a vicious cycle for currencies like the AUD. Reduced investment in Australian assets, coupled with the negative sentiment emanating from Asia, weakens demand for the Australian Dollar. While Australia is a commodity exporter and might see some benefit from higher prices of raw materials, the overall macroeconomic picture painted by this risk-off environment is bearish for the Aussie. The 4-hour chart for AUDUSD doesn't offer much comfort either. Although the ADX is at a moderate 20.42, the RSI is at 38.83 and the MACD is negative, aligning with the bearish sentiment. The Stochastic shows a bearish signal (%K=37.35, %D=44.36), further indicating that the path of least resistance for AUDUSD in the short to medium term appears to be downwards, especially if the geopolitical tensions driving oil prices remain elevated.
Fundamental Drivers: Inflation Fears and Central Bank Dilemmas
The surge in oil prices to $103.96 is a significant inflationary catalyst. For central banks globally, this presents a renewed dilemma. In the US, the Federal Reserve is already grappling with sticky inflation, as highlighted by San Francisco Fed President Mary Daly's recent comments about an uncertain monetary policy path. The Fed Fund Futures and OIS pricing, while not explicitly provided, are likely factoring in the increased probability of persistent inflation, which could delay any anticipated interest rate cuts. This environment generally favors a stronger US Dollar, as higher-for-longer interest rate expectations tend to attract capital. For the Reserve Bank of Australia (RBA), higher imported inflation from oil could complicate their own policy decisions. While the RBA might be tempted to keep rates steady or even consider hikes if inflation proves persistent, the weakening growth outlook due to global risk aversion and capital outflows could force their hand in a different direction. The 'aud usd fundamentals' search query gaining traction suggests traders are keenly watching these central bank machinations.
The correlation between AUDUSD and the DXY is a crucial aspect to monitor. With the DXY currently at 99.21 and showing a generally bullish stance across multiple timeframes, any further strengthening of the dollar will likely translate into further downside pressure on AUDUSD. The 1-hour chart for DXY shows a bullish overall signal, with 7 out of 8 indicators suggesting a buy. The 4-hour chart also leans bullish, and the daily chart confirms a strong upward trend with an ADX of 32.74. This dollar strength is a direct consequence of the global risk-off sentiment, amplified by the oil shock. Investors are seeking the perceived safety and liquidity of the US dollar amidst geopolitical uncertainty and fears of economic deceleration. This dynamic makes it challenging for AUDUSD to find sustainable footing, even if Australian commodity prices were to benefit in isolation.
Technical Picture: Testing Key Support at $0.69218
Technically, AUDUSD is at a critical juncture. The current price of $0.69643 puts it squarely in the vicinity of the first major support level at $0.69218. This level has been a significant pivot in recent trading sessions, and its integrity is paramount for the pair's short-term outlook. A decisive break below $0.69218 could open the floodgates for further declines, potentially targeting the next support at $0.68840 on the 4-hour chart. Conversely, a failure to break this level and a subsequent bounce could signal a short-term reprieve for the Aussie, with resistance at $0.70005 and $0.70131 coming into play. However, the prevailing risk-off environment and the strong dollar suggest that any rallies might be short-lived, presenting a 'sell the rip' opportunity for bearish traders.
The multi-timeframe analysis reveals conflicting signals, adding to the uncertainty but leaning towards bearishness in the short term. While the 1-hour chart shows a bearish bias with RSI at 43.28 and negative MACD momentum, the 4-hour chart presents a mixed picture. The RSI is at 45.58 (trending down), but the Stochastic is showing a bullish signal (%K > %D). The 1-day chart, however, paints a clearer bearish picture, with RSI at 43.95 and MACD negative. The ADX readings are also telling: a weak trend on the 1H (12.72) and 4H (20.42) suggests a lack of conviction, but the daily ADX at 21.67 indicates a moderate downward trend is in play. This divergence across timeframes, particularly the bearish signals on the daily and 1-hour charts, reinforces the idea that the path of least resistance is lower, especially if the oil shock continues to escalate geopolitical tensions.
The 'aud usd 0.7200 target' and its Relevance
The search query "aud usd 0.7200 target" appearing as a rising star indicates that some market participants are still entertaining bullish scenarios, likely anticipating a potential shift in RBA policy or a de-escalation of geopolitical risks. However, based on the current market data and sentiment, achieving the $0.7200 target seems highly improbable in the near term. Such a move would require a significant reversal in global risk appetite, a substantial drop in oil prices, and a weakening of the US Dollar. The current setup, with Brent crude at $103.96 and DXY at 99.21, does not support this optimistic outlook. The 'aud usd fundamentals' analysis also points away from such a bullish target; persistent inflation fears and central bank tightening expectations globally favor a stronger dollar and weaker risk assets.
For the $0.7200 target to even become a remote possibility, several conditions would need to be met. First, geopolitical tensions would need to subside dramatically, leading to a sharp correction in oil prices. Second, global equity markets would need to stabilize and show signs of recovery, reversing the current capital flight from Asia. Third, the US Federal Reserve would need to signal a more dovish stance or an earlier-than-expected pivot on interest rates, which seems unlikely given the inflationary pressures. Until these conditions materialize, any bullish aspirations for AUDUSD are likely to remain just that - aspirations. The immediate focus remains on the support level at $0.69218 and the broader risk sentiment driven by energy prices and global economic outlook.
Navigating the Volatility: What Traders Should Watch
In this environment of heightened volatility, traders need to exercise extreme caution and focus on risk management. The AUDUSD is currently trading at $0.69643, hovering near a critical support level. The surge in Brent crude to $103.96 and the subsequent risk-off sentiment in Asian markets, coupled with a strengthening DXY at 99.21, create a challenging landscape. The technical indicators across different timeframes suggest a predominantly bearish short-to-medium term outlook, with key support at $0.69218 under intense pressure. Any sustained break below this level could trigger significant further downside, targeting $0.68840 and beyond. Conversely, a failure to break support and a subsequent bounce would require confirmation, perhaps a break above the 1-hour resistance at $0.70005, to suggest a short-covering rally.
The fundamental backdrop remains dominated by inflation fears stemming from the oil shock and the subsequent central bank policy responses. Investors are closely watching for any signs of de-escalation in geopolitical tensions or a shift in inflation dynamics. Upcoming economic data releases from Australia, particularly concerning inflation and employment, will be crucial for the RBA's policy outlook and could influence AUDUSD. Similarly, US inflation figures and Fed commentary will continue to dictate the strength of the US Dollar. The conflicting signals between different timeframes on AUDUSD technicals - bearish on 1H and 1D, but with some conflicting Stochastic signals on 4H - mean that confirmation is key. Traders should be looking for clear breaks of key levels, sustained momentum confirmed across multiple indicators, and a favorable risk-reward ratio before committing to any positions. Patience is crucial; the market is not offering clear, high-probability setups at this very moment.
The current market sentiment, driven by the oil shock and its implications for inflation and global growth, favors a stronger US Dollar and weaker commodity currencies like the Australian Dollar. While the price action is testing key support at $0.69218, the fundamental drivers suggest that the bearish pressure could persist. Any potential rally should be viewed with skepticism until the geopolitical situation stabilizes and the inflationary outlook becomes clearer. The 'aud usd fundamentals' are currently overshadowed by macro risks, making it difficult to build a strong bullish case. For now, the focus remains on risk sentiment and the integrity of the $0.69218 support level.
Frequently Asked Questions: AUDUSD Analysis
What happens if AUDUSD breaks below the $0.69218 support level?
A decisive break below $0.69218 would likely trigger further selling pressure, potentially targeting the next support at $0.68840. This scenario is supported by bearish technical indicators on the 1H and 1D charts and the prevailing risk-off sentiment driven by oil prices.
Should I consider buying AUDUSD at current levels of $0.69643 given the oil shock?
Buying at $0.69643 is not recommended given the current risk-off environment and bearish technical signals. A more prudent approach would be to wait for confirmation of a bounce from support, perhaps a close above $0.70005, or a significant shift in global risk sentiment.
Is the RSI at 43.28 a sell signal for AUDUSD right now?
An RSI of 43.28 on the 1-hour chart is not an extreme oversold or overbought signal but indicates bearish momentum is present. Combined with negative MACD momentum and a bearish Stochastic crossover, it supports the view of potential further downside, especially if the trend continues.
How will the continued DXY strength at 99.21 affect AUDUSD this week?
The strengthening DXY at 99.21, driven by global risk aversion, directly pressures AUDUSD. Continued dollar strength will likely keep AUDUSD capped and could exacerbate any move lower, especially if geopolitical tensions persist and oil prices remain elevated.
Track markets in real-time
AI-powered analysis, technical indicators and real-time price data.
Join Our Telegram Channel
Breaking market news, AI analysis and trading signals instantly.
Join Channel