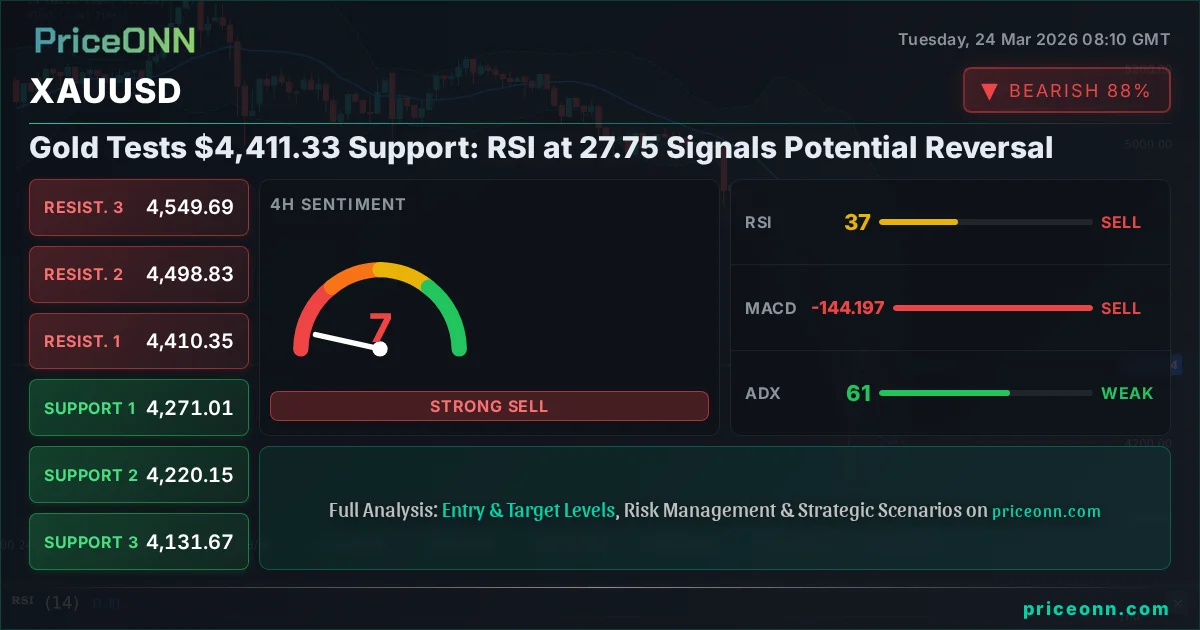
Gold Tests $4,411.33 Support: RSI at 27.75 Signals Potential Reversal
XAUUSD hovers near $4,411.33, with RSI at 27.75 on the daily chart. Is this a buying opportunity or a sign of deeper declines?
The age-old question for gold traders echoes again: is the current price action a prelude to a significant reversal or merely a pause before further declines? XAUUSD is currently trading at $4,411.33, a level that's drawing intense scrutiny from both bulls and bears. While the daily chart's RSI has dipped into the oversold territory at 27.75, suggesting potential buying interest, the longer-term trend indicators paint a more complex picture. This dichotomy sets the stage for a critical debate: can gold hold these levels, or is further downside imminent?
- XAUUSD is currently trading at $4,411.33, with the daily RSI at 27.75 signaling oversold conditions.
- Critical support is identified at $4,361.66 on the 1-hour chart, while the 4-hour trend remains strongly bearish.
- The US Dollar Index (DXY) is at 98.97, showing a bullish trend on the daily timeframe, which typically pressures gold prices.
- Geopolitical tensions are elevated, but their impact on gold is currently being overshadowed by macroeconomic factors and strong dollar sentiment.
This tension between short-term oversold signals and longer-term bearish trends creates a fascinating market dynamic. As seasoned analysts, we must dissect the underlying drivers to understand which narrative is likely to prevail. The $4,411.33 mark is more than just a price point; it's a psychological level where sentiment is being tested. The coming days will be crucial in determining whether this represents a genuine buying opportunity or a trap for unwary investors.
The Bullish Case: A Buying Opportunity Emerges
The most compelling argument for gold's immediate future lies in its daily Relative Strength Index (RSI). Currently sitting at 27.75, this oscillator is deep within the oversold territory, a zone historically associated with potential price rebounds. When the RSI falls below 30, it suggests that the asset has been sold off too aggressively in the short term, and a bounce is statistically probable. For gold, this could signal that the recent downward pressure is overextended, and buyers are poised to step in to capture value at these lower prices. The 1-hour chart indicators offer some support to this view, with a general 'BUY' signal dominating, driven by Stochastic %K crossing above %D and a positive MACD momentum reading. This suggests that, at least on the intraday timeframe, momentum is shifting upwards, a precursor to a potential larger move.
Furthermore, the current price of $4,411.33 itself can be seen as a psychological level where previous support might form. While the 4-hour chart indicates a strong downtrend with support at $4,271.01, and the daily chart shows a neutral trend with significant downside potential towards $4,158.15, the immediate oversold condition on the daily RSI cannot be ignored. Traders looking for short-term opportunities might see this as a tactical entry point, aiming for a reversion to the mean or a test of higher intraday resistance levels. The ADX on the 1-hour chart at 22.06, while indicating a neutral trend, doesn't signal overwhelming bearish conviction on this very short timeframe, allowing room for a potential snap-back rally.
A key factor that could bolster the bullish case is any shift in central bank sentiment or renewed geopolitical escalation. While current data doesn't strongly point to this, the market is always forward-looking. If inflation data unexpectedly ticks higher, or if geopolitical flashpoints intensify beyond current expectations, gold's safe-haven appeal could rapidly reassert itself. Even without these catalysts, institutional players might see the current oversold conditions as an attractive entry point for long-term accumulation, especially if real interest rates remain subdued or begin to decline. The sheer volume of central bank buying in recent years provides a structural bid under gold that cannot be dismissed, acting as a floor against extreme price depreciation.
The Bearish Case: Trend and Dollar Strength Prevail
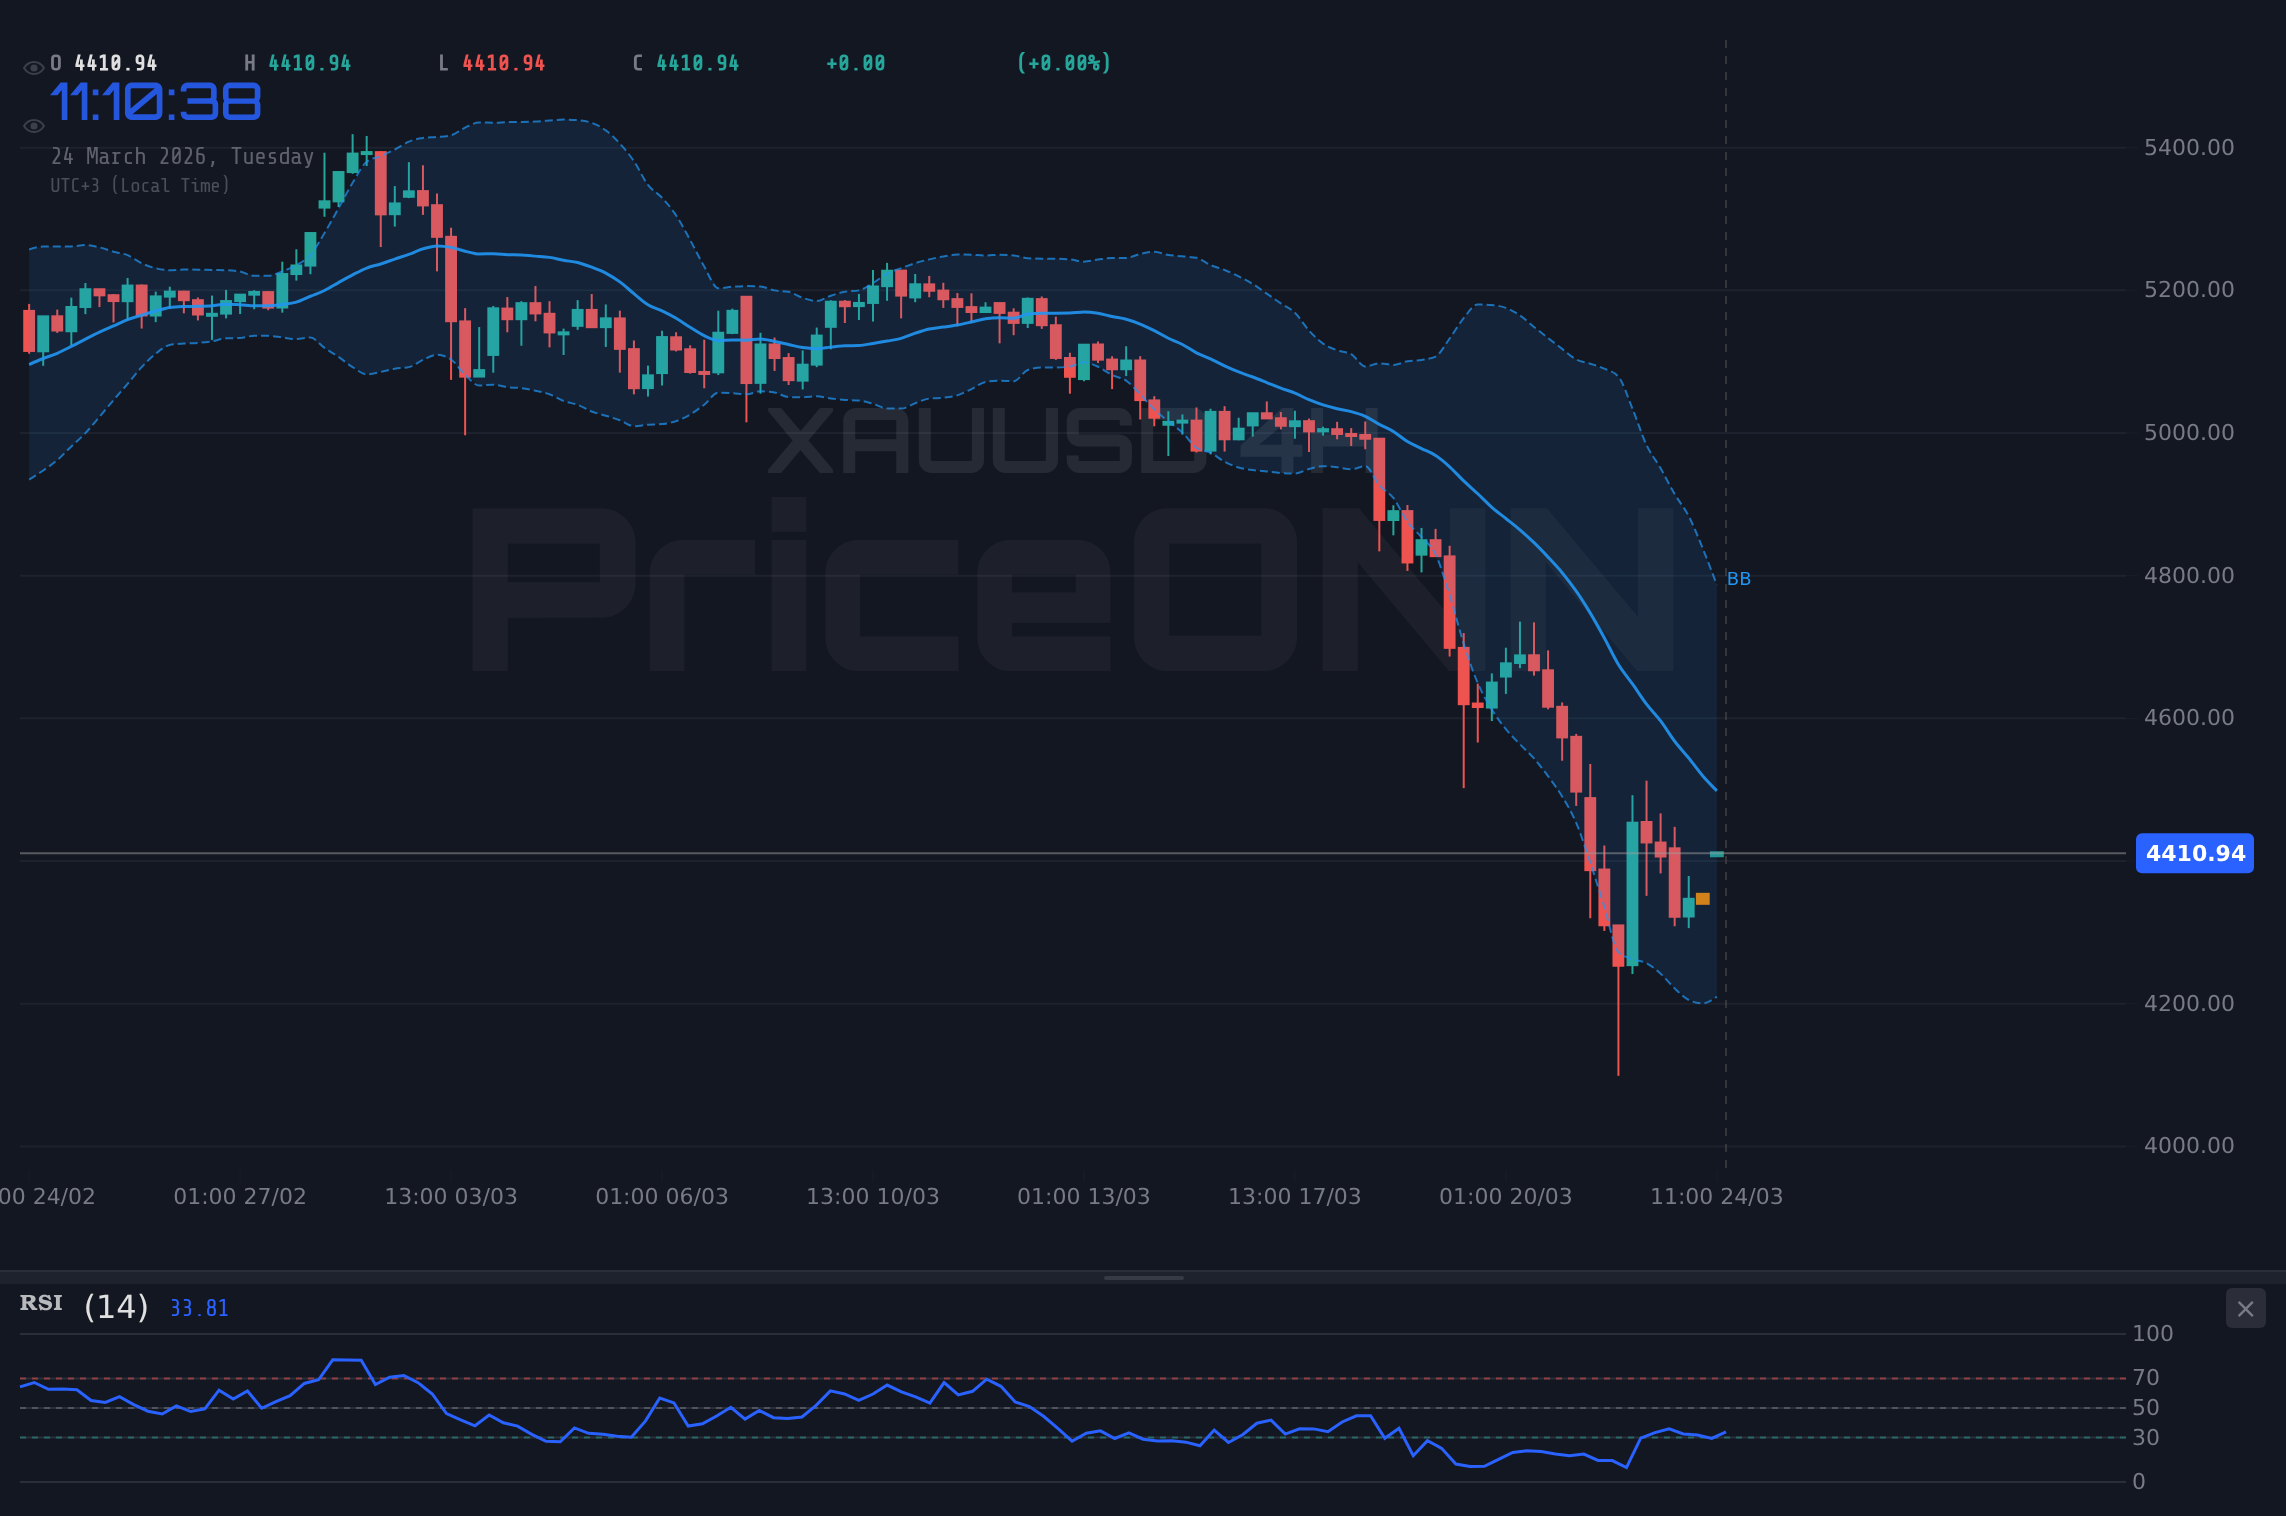
Despite the daily oversold RSI, the prevailing trend on longer timeframes presents a formidable counter-argument. The 4-hour chart paints a clear picture of a strong downtrend, with the ADX at a robust 60.67, indicating significant bearish momentum. The price is trading below the middle Bollinger Band, and the MACD is firmly in negative territory, reinforcing the idea that sellers are in control. This suggests that any short-term bounce is likely to be met with selling pressure as traders positioned for the downtrend look to defend their positions or add to them. The support levels on this timeframe, starting at $4,271.01, become increasingly relevant if the current price fails to hold.
Adding to the bearish sentiment is the strength of the US Dollar Index (DXY). With the DXY currently at 98.97 and showing a daily uptrend, it exerts downward pressure on gold. A stronger dollar typically makes gold more expensive for holders of other currencies, thus dampening demand. The DXY's daily ADX of 32.74 indicates a strong trend, suggesting that dollar strength could persist, further capping any upside potential for the yellow metal. The correlation between gold and the dollar, while not always perfect, is a significant factor, and current DXY dynamics are unfavorable for gold bulls.
On the daily timeframe, while the RSI is oversold, the overall trend is still considered neutral with significant long-term downside risk, as indicated by the ADX of 25.72. The MACD remains negative, and the price is trading below the middle Bollinger Band, suggesting that the downtrend might still have legs. The support levels at $4,158.15 and $3,909.96 loom large if the $4,361.66 and $4,321.32 levels on the 1-hour chart fail to hold. The prevailing macroeconomic narrative, which may include sticky inflation and a cautious Federal Reserve, often favors a stronger dollar and thus weaker gold, especially if risk appetite in equity markets remains somewhat resilient, despite occasional dips.
Technical Confluence: A Battle at the Key Levels
The technical landscape for XAUUSD at $4,411.33 is a battleground where short-term oversold signals clash with established longer-term bearish trends. On the 1-hour chart, the picture is mixed but leans bullish with a general 'BUY' signal. The RSI at 51.51 is neutral but trending up, Stochastic is bullish, and MACD shows positive momentum. However, these intraday signals are often weak against stronger daily trends. The immediate support on this timeframe is at $4,361.66, and the resistance is at $4,423.68. A break above $4,423.68 could signal a short-term bullish continuation, targeting $4,445.36. Conversely, a break below $4,361.66 would reinforce the bearish narrative, potentially leading to a test of the 4-hour support levels.
The 4-hour timeframe, however, is decidedly bearish. With an ADX of 60.67, the trend strength is very high. The RSI is at 36.77, trending down, and MACD is negative. This timeframe suggests that any upward movement is likely to be capped. Key resistance on this chart is at $4,410.35, just below the current price, and then significantly higher at $4,498.83. A failure to decisively break and hold above $4,410.35 would confirm the bearish outlook, with targets at the 4-hour support levels, starting with $4,271.01.
On the daily chart, the oversold RSI of 27.75 is the main bullish signal, but it's juxtaposed against a negative MACD and ADX at 25.72, indicating a strong downtrend despite the RSI reading. The Bollinger Bands are below the middle band, suggesting downward pressure. The key support levels to watch are $4,158.15 and $3,909.96. Resistance is formidable, starting at $4,595.32. This divergence between the daily oversold condition and the broader bearish trend suggests caution. It might be a period of consolidation or a sharp, short-lived bounce before the larger trend resumes. The confluence of weak intraday signals against strong daily and 4-hour bearish trends indicates that the bears currently have the upper hand, but the daily oversold RSI provides a crucial warning that a significant bounce is possible.
Fundamental Drivers: Inflation, Rates, and Geopolitics
The macroeconomic environment continues to be the primary battleground for gold's price direction. While geopolitical tensions, such as the recent developments in Tehran, can provide short-term safe-haven demand, the persistent narrative around inflation and central bank policy is likely to be the dominant driver. If inflation proves to be more stubborn than anticipated, central banks, particularly the Federal Reserve, may be forced to maintain higher interest rates for longer, or even consider further tightening. This scenario would typically be bearish for gold, as higher real yields increase the opportunity cost of holding non-yielding assets like gold.
The latest economic data will be critical. Any signs of weakening labor markets, such as disappointing Non-Farm Payrolls (NFP) or rising unemployment rates, could prompt a shift in Fed policy expectations, potentially leading to rate cuts sooner rather than later. Such a development would lower real yields and boost gold's appeal. Conversely, stronger-than-expected inflation figures (CPI, PCE) or robust economic growth (GDP, PMI) could reinforce the 'higher for longer' interest rate narrative, weighing on gold prices. The market's reaction to these data points will be heavily influenced by the Fed's forward guidance, making upcoming Fed speeches and meeting minutes closely watched events.
Geopolitical risks, while always present, need to be assessed in terms of their sustained impact. While events like the recent oil price fluctuations due to geopolitical concerns (as reported by forex news outlets) can cause short-term spikes in gold, the underlying trend is often dictated by monetary policy. The market appears to be pricing in a certain level of geopolitical risk, but sustained inflation concerns and the Fed's stance seem to be overriding these factors for now. If, however, geopolitical tensions were to escalate dramatically, leading to significant supply chain disruptions or a broader flight to safety, gold could see a more substantial and sustained rally, irrespective of interest rate considerations.
The Verdict: Tread Carefully, Bears Have Edge
We are at a critical juncture for gold. The daily RSI at 27.75 is screaming 'oversold,' presenting a tangible potential for a short-term bounce. The 1-hour chart indicators align with this, showing bullish momentum on the shortest timeframes. This could lead to a move back towards resistance levels like $4,423.68 and potentially higher if momentum builds. For short-term traders, this might offer a tactical buying opportunity, anticipating a reversion from the extreme oversold condition.
However, the longer-term picture remains challenging for gold bulls. The strong bearish trend on the 4-hour chart, evidenced by the high ADX of 60.67 and negative MACD, suggests that any rallies are likely to be met with selling pressure. The daily trend, while neutral, carries significant downside risk, and the current DXY strength at 98.97 adds another layer of pressure. The support levels at $4,361.66 (1H) and $4,271.01 (4H) are the key levels to watch. A decisive break below $4,361.66 would likely accelerate selling, targeting the lower 4-hour support. Until we see a clear break above the 4-hour resistance at $4,410.35 and sustained bullish momentum confirmed across multiple timeframes, the bears appear to hold the edge.
The current price of $4,411.33 is a crucial inflection point. While the oversold RSI is a siren call for buyers, the prevailing bearish trends and dollar strength demand caution. Investors should be wary of chasing short-term bounces without clear confirmation. The fundamental backdrop, centered on inflation and interest rate expectations, will likely continue to dictate the broader trend. Until these macro factors shift decisively in favor of gold, or until the technical picture shows a robust reversal pattern across longer timeframes, a bearish bias remains the more prudent stance. Patience and risk management are paramount as the market navigates these conflicting signals.
Frequently Asked Questions: XAUUSD Analysis
What happens if XAUUSD breaks below the $4,361.66 support level?
A break below $4,361.66 on the 1-hour chart would confirm the bearish trend on that timeframe and likely accelerate selling pressure. This could lead to a retest of the 4-hour support at $4,271.01, especially if the DXY continues its upward trend.
Is the daily RSI at 27.75 a buy signal for XAUUSD at $4,411.33 right now?
An RSI of 27.75 is technically oversold and historically suggests a potential bounce. However, it's not a standalone buy signal. Confirmation from bullish price action, breaks above immediate resistance like $4,423.68, and shifting longer-term trend indicators are needed for a high-probability buy setup.
How is the DXY at 98.97 influencing the XAUUSD price action near $4,411.33?
The DXY's current level of 98.97 and its daily uptrend exert downward pressure on gold, as a stronger dollar makes gold more expensive for foreign buyers. This correlation suggests that continued dollar strength could cap gold's upside potential near $4,411.33.
How will upcoming inflation data affect XAUUSD's trend analysis around $4,411.33?
Higher-than-expected inflation data would likely reinforce the 'higher for longer' interest rate narrative, potentially pressuring gold lower by increasing the opportunity cost of holding the metal. Conversely, softer inflation could lead to expectations of Fed rate cuts, boosting gold towards resistance levels.
Track markets in real-time
AI-powered analysis, technical indicators and real-time price data.
Join Our Telegram Channel
Breaking market news, AI analysis and trading signals instantly.
Join Channel