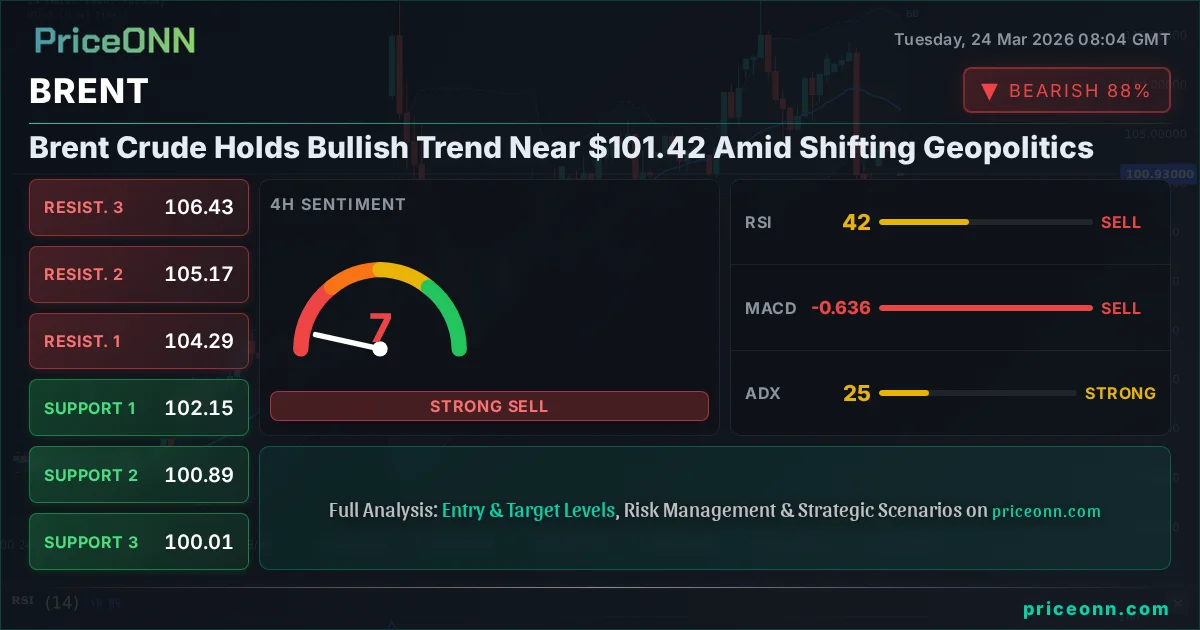
Brent Crude Holds Bullish Trend Near $101.42 Amid Shifting Geopolitics
Brent Crude hovers around $101.42 as geopolitical tensions ease, but a strong daily uptrend suggests further upside potential. Analysis of key indicators and market correlations.
Is the $101.42 level a launchpad for Brent Crude, or a temporary pause before a deeper correction? This is the critical question facing oil traders today, as the market navigates a complex landscape of easing geopolitical tensions and persistent fundamental drivers. While headlines about de-escalation might suggest a pullback, the underlying strength in Brent’s daily chart action, coupled with its current price hovering just above the $101 mark, paints a more nuanced picture. The battle between bullish momentum and bearish sentiment is playing out in real-time, and understanding the interplay of technical signals and macroeconomic factors is paramount for discerning the next significant move.
- Brent Crude is consolidating just above $101.42, showing resilience despite recent geopolitical de-escalation news.
- The 1D ADX at 63.98 signals a very strong uptrend, indicating underlying bullish conviction.
- Support is holding firm at $101.04, while resistance looms at $104.31, defining the immediate trading range.
- Correlation with the DXY at 98.98 and the S&P 500 at 6593.15 suggests a mixed risk environment influencing oil's direction.
The Case for Continued Upside: Why Bulls Are Guarding $101.42
The daily chart for Brent Crude presents a compelling argument for continued bullishness, despite the recent easing of geopolitical tensions that might otherwise trigger profit-taking. The current price of $101.42 sits comfortably above the critical support level of $101.04. More significantly, the Average Directional Index (ADX) on the daily timeframe is a staggering 63.98. This isn't just a strong trend; it's an indication of extreme conviction in the current upward move. When ADX readings are this high, it suggests that the market participants are largely aligned in their directional bias, making sustained counter-trend moves difficult. The price action itself, hovering near its daily high and above the mid-Bollinger Band, further reinforces this bullish sentiment. The Relative Strength Index (RSI) at 62.34, while not yet in overbought territory, clearly indicates strong positive momentum, giving bulls ample room to push higher before facing significant selling pressure.
Further bolstering the bullish case is the performance of related assets and market correlations. The US Dollar Index (DXY), currently trading around 98.98, shows a mixed picture across different timeframes. While its 1D trend is bullish, its 1H and 4H signals are leaning bearish, suggesting potential dollar weakness ahead. Historically, a softer dollar often correlates with higher oil prices, as crude is priced in USD. This dynamic could provide an additional tailwind for Brent. Similarly, the US equity markets, represented by the S&P 500 at 6593.15, are showing a mixed technical signal across timeframes, but its 1H and 4H trends are neutral to bullish, indicating a relatively stable risk appetite. This environment is generally conducive to commodities like oil, which benefit from robust global demand expectations. The fact that Brent is maintaining its upward trajectory even as some geopolitical fears subside speaks volumes about the underlying fundamental support.
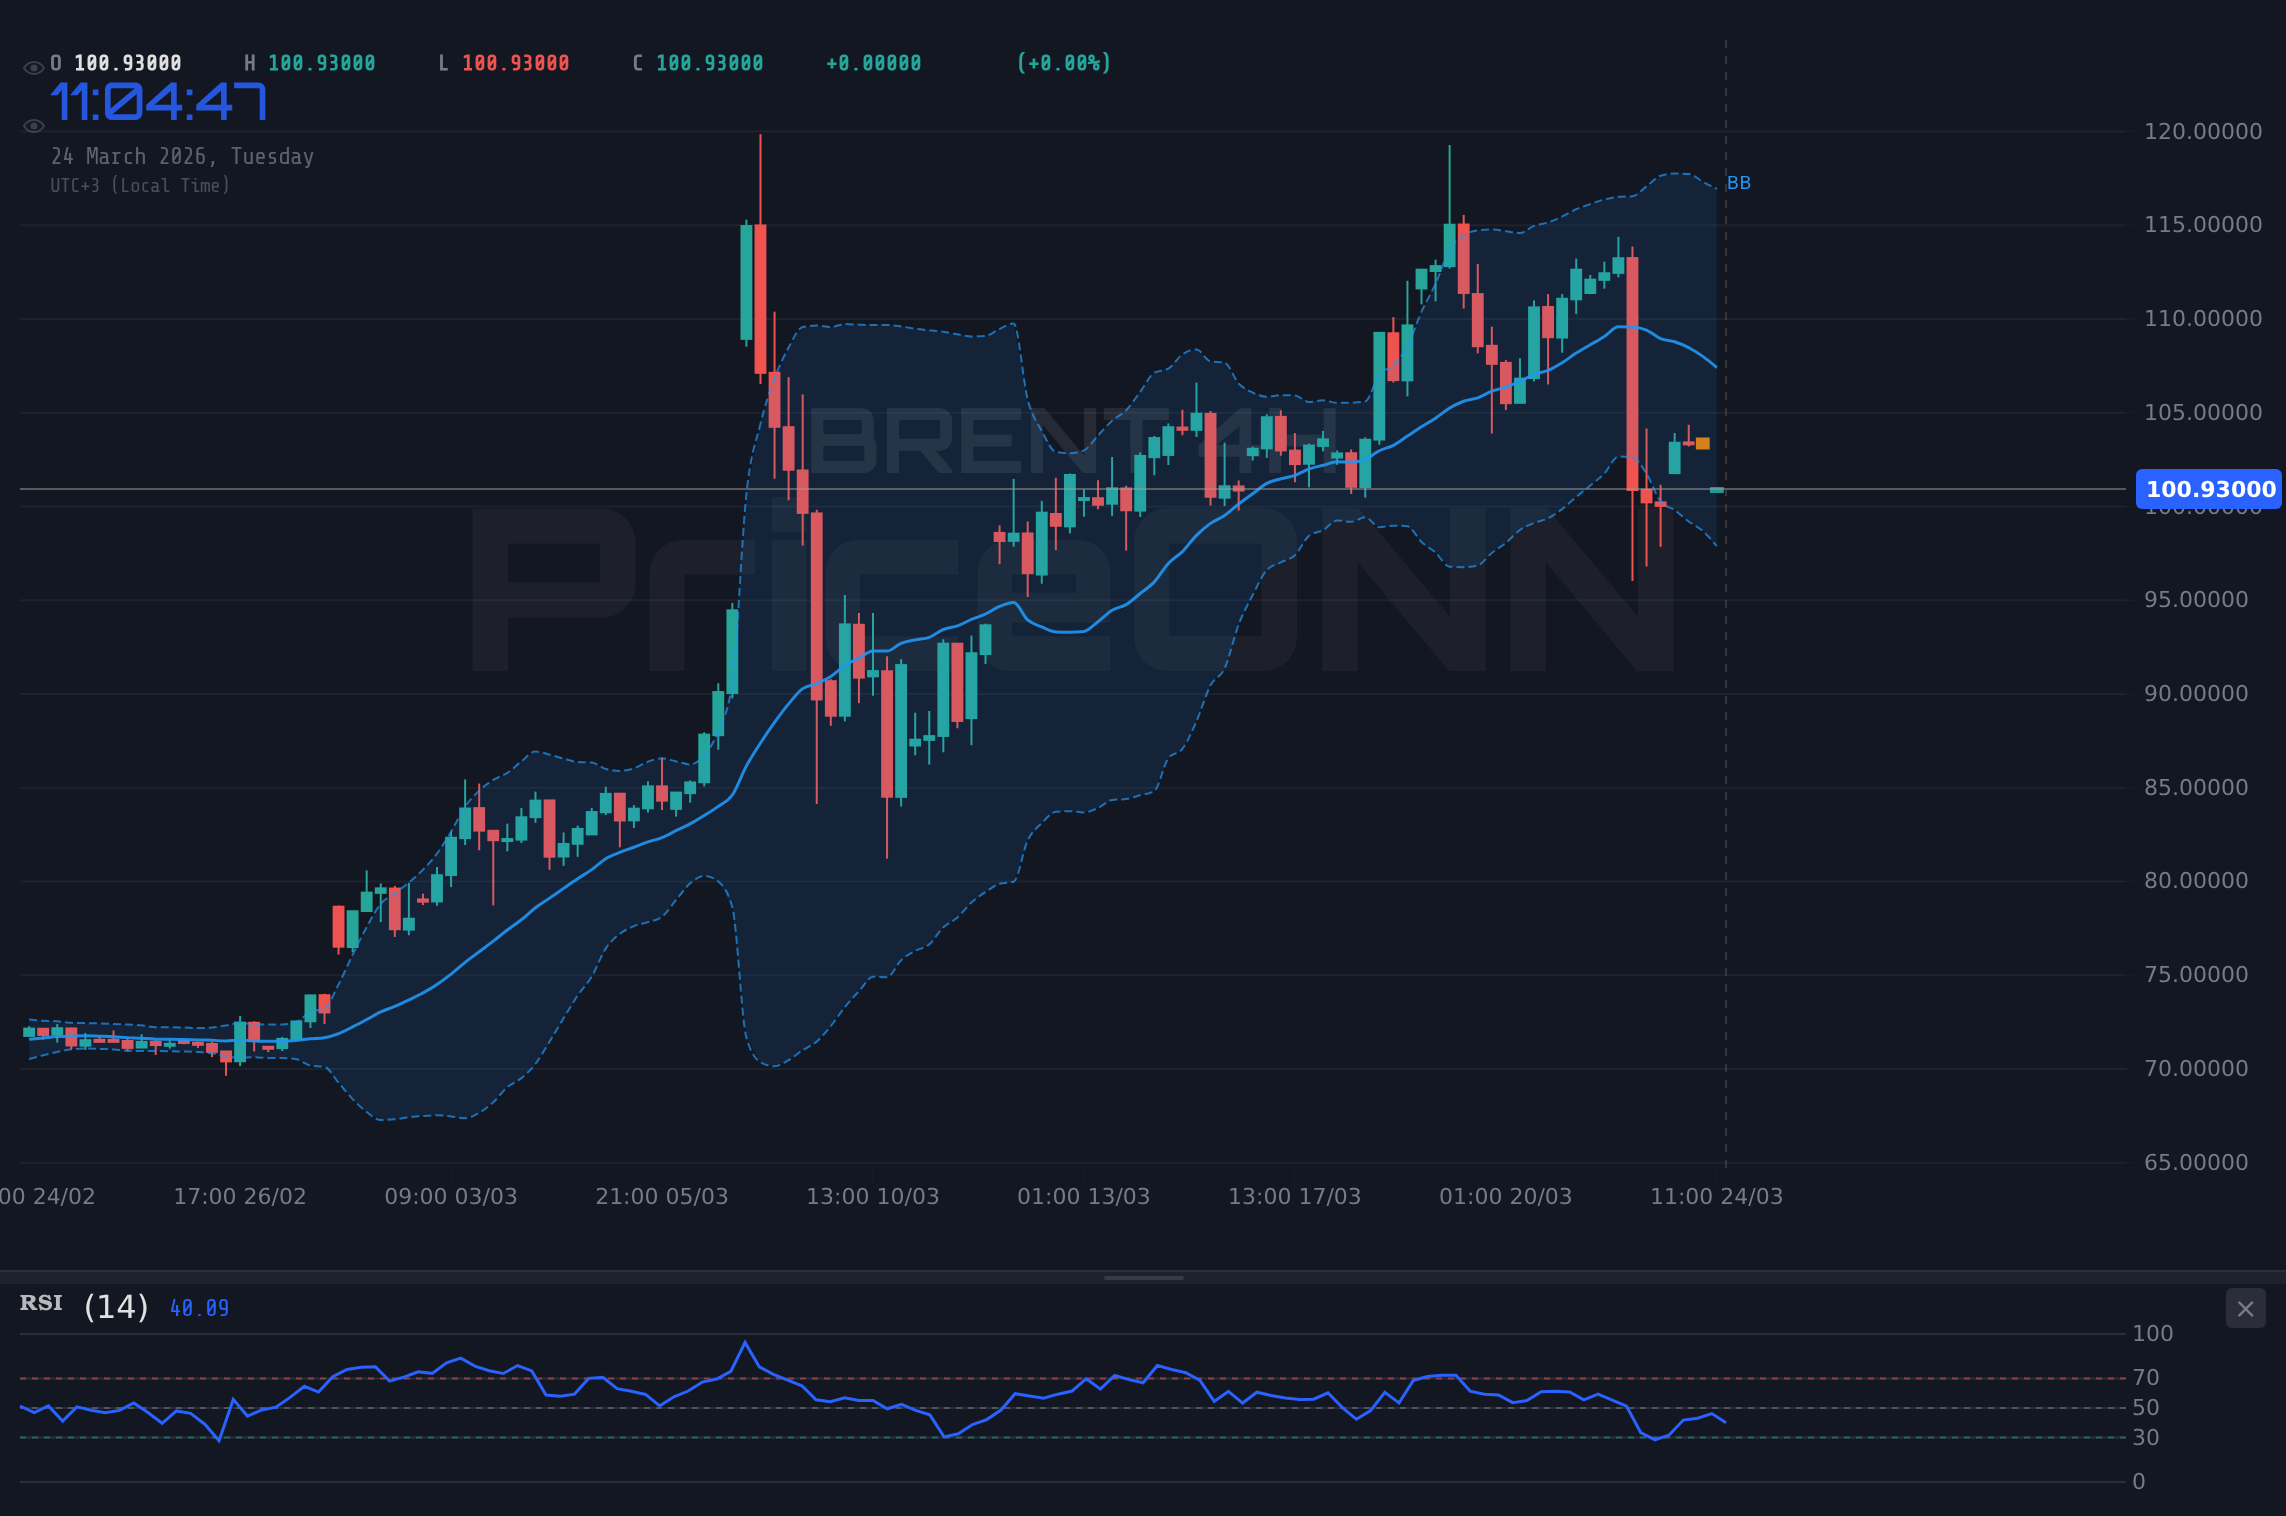
Looking at the shorter timeframes, the 1H chart for Brent shows a neutral trend with a 50% strength, signaling a consolidation phase rather than a reversal. The RSI at 38.08 is in the lower half of neutral territory, and the MACD shows negative momentum, with the histogram below the signal line. This suggests that while the longer-term trend is strongly bullish, the intraday action might be experiencing some temporary selling pressure or a lack of immediate buying interest. However, this pullback on the 1H chart is occurring well above the $101.04 support level, and crucially, it hasn't broken the mid-Bollinger Band. This suggests that the short-term weakness is more likely a pause for breath within a larger uptrend, rather than the start of a significant decline. Traders watching the intraday charts will be looking for confirmation of renewed buying interest near the current levels to join the prevailing daily trend.
The Bearish Counterarguments: Cracks in the Bull's Armor?
Despite the strong daily trend signals, a closer examination reveals potential vulnerabilities in Brent’s bullish narrative. The recent news regarding easing geopolitical tensions in the Middle East, particularly reports of a potential de-escalation or a diplomatic pause, cannot be entirely dismissed. Historically, oil prices are highly sensitive to such developments, and a significant reduction in perceived supply risk can lead to sharp price corrections. The fact that Brent Crude experienced a 12.06% drop to $98.06 earlier in the day, as reported by WTI falling alongside it, highlights this sensitivity. Although the price has since recovered to $101.42, this earlier plunge serves as a stark reminder of how quickly sentiment can shift. If further diplomatic progress is made or if supply disruptions are perceived to be less imminent, the current bullish momentum could falter rapidly.
Furthermore, the divergence in signals across different timeframes warrants caution. While the daily chart screams 'uptrend', the 1H and 4H timeframes present a more mixed, and in some cases, bearish outlook. The 1H ADX at 38.57, while indicating a strong trend, is still below the extreme levels seen on the daily chart, and the RSI is below 50. The 4H chart shows a bearish trend with an ADX of 24.96, a significant drop from the daily's strength. MACD on both shorter timeframes is showing negative momentum, and the Stochastic oscillators are giving mixed signals, with some indicating overbought conditions on the 1H and 4H charts. This multi-timeframe conflict suggests that the powerful daily trend might be running into short-term headwinds. If selling pressure on the intraday charts intensifies and breaks key short-term support levels, it could signal a broader correction, even if the long-term daily trend remains intact for now.
Another critical factor to consider is the broader macroeconomic environment and its potential impact on oil demand. While the current risk appetite shown by the S&P 500 at 6593.15 is relatively stable, any significant deterioration in global economic growth forecasts could weigh heavily on oil prices. Upcoming economic data, particularly concerning inflation and central bank policy, will be crucial. If inflation proves to be more persistent than expected, central banks like the Fed might maintain a hawkish stance or even signal further tightening, which could dampen economic activity and, consequently, oil demand. Conversely, signs of a significant economic slowdown could trigger a sell-off in risk assets, including oil. The current price of Brent at $101.42 is still elevated, and any negative economic news could prompt a rapid reassessment of demand expectations, leading to a swift decline in prices.
Technical Crossroads: What the Indicators Are Telling Us
The technical indicators for Brent Crude present a fascinating dichotomy, reflecting the ongoing tug-of-war between bulls and bears. On the daily timeframe, the picture is overwhelmingly bullish. The ADX at 63.98 is exceptionally high, confirming a very strong and sustained uptrend. This suggests that the current price action is not a mere fluctuation but a deeply entrenched market direction. The RSI at 62.34 is comfortably in bullish territory, indicating strong upward momentum without being excessively overbought, leaving room for further gains. The MACD is also showing positive momentum, with the histogram above the signal line, further supporting the bull case. The price trading above the middle Bollinger Band reinforces the upward bias. This daily setup implies that any short-term pullbacks are likely opportunities to join a powerful trend.
However, the shorter-term technicals introduce elements of caution. The 1H chart shows a bearish trend signal with an ADX of 38.57, and the RSI is below 50 at 38.08. The MACD histogram is negative, and Stochastic is giving mixed signals. This suggests intraday traders might be taking profits or initiating short positions, creating headwinds for the bulls. Similarly, the 4H chart, while showing a bullish Stochastic crossover, has a bearish trend signal indicated by the ADX at 24.96 and an RSI below 50. This conflict between the dominant daily trend and the weaker signals on shorter timeframes highlights the importance of price action around key levels. The $101.04 support is crucial; a break below it on significant volume could invalidate the short-term bullish structure and signal a deeper correction, potentially targeting the next support at $92.58.
The interplay between these indicators and price levels is critical. The fact that Brent is holding above $101.04 despite weaker intraday momentum suggests that institutional buyers might be defending this level, anticipating a continuation of the daily uptrend. The resistance at $104.31 remains the immediate target for the bulls. A decisive break above this level, particularly on increased volume and accompanied by stronger intraday technical signals, could confirm the resumption of the strong daily trend and open the door for further upside towards $110.93. Conversely, a failure to hold $101.04 could see a rapid decline, potentially testing the $92.58 support level as market sentiment shifts.
Navigating the Uncertainty: What Lies Ahead for Brent Crude?
The immediate future for Brent Crude hinges on the market's interpretation of the geopolitical landscape and its ability to sustain momentum above key price levels. The strong daily trend, evidenced by the extremely high ADX of 63.98, remains the dominant factor. This suggests that dips are likely to be temporary and could present buying opportunities for those aligned with the larger trend. The $101.42 price point is currently acting as a psychological and technical pivot. Holding above this level, and crucially, above the $101.04 support, is essential for the bulls to maintain control. The resistance at $104.31 is the next significant hurdle, and a clear break above it would likely signal a continuation towards the $110.93 level.
However, the conflicting signals from shorter timeframes cannot be ignored. A decisive break below $101.04, particularly if accompanied by rising volume and a bearish turn in the 1H and 4H MACD, could trigger a more significant correction. In such a scenario, the $92.58 level would become the next major support to watch. The correlation with the DXY and equity markets will also play a crucial role. Any unexpected strength in the dollar or a sharp downturn in global risk sentiment could add selling pressure to oil prices. Traders should remain vigilant for confirmation signals, particularly on the daily close, to determine whether the current consolidation is merely a pause within a powerful uptrend or the precursor to a more substantial reversal.
The coming days will likely be characterized by volatility as the market digests new information on geopolitical developments and economic data. The strength of the daily trend suggests that the path of least resistance is still upwards, but the weaker intraday signals and the recent history of sharp price swings due to geopolitical news warrant a cautious approach. Patience will be key; waiting for clear confirmation of either a breakout above resistance or a breakdown below support will be crucial for navigating this complex market environment. The $101.42 level is more than just a price; it's a battleground where the prevailing bullish narrative is being tested.
Bullish Scenario: Trend Continuation
65% ProbabilityNeutral Scenario: Range-Bound Consolidation
25% ProbabilityBearish Scenario: Correction Underway
10% ProbabilityFrequently Asked Questions: BRENT Analysis
What happens if BRENT breaks below the $101.04 support level?
A decisive break below $101.04 on the daily chart would invalidate the current bullish setup and could signal a deeper correction. This scenario would likely target the next significant support at $92.58, especially if accompanied by negative geopolitical news or weakening global demand indicators.
Is RSI at 62.34 a buy signal for BRENT right now, given the strong daily uptrend?
An RSI of 62.34 on the daily chart indicates strong bullish momentum but is not yet overbought territory. While it supports the ongoing uptrend, it suggests that immediate explosive upside might be limited. Traders might look for consolidation or a slight pullback to enter positions aligned with the trend, rather than chasing the price higher at current levels.
How will the DXY at 98.98 affect BRENT prices this week?
The DXY's mixed signals across timeframes suggest potential dollar weakness, which typically supports oil prices like BRENT. If the dollar weakens further, it could provide an additional tailwind for BRENT, pushing it towards resistance levels. However, any unexpected strength in the dollar could add pressure on oil.
What is the significance of the ADX at 63.98 for BRENT's trend analysis?
An ADX reading of 63.98 on the daily chart signifies an extremely strong and established uptrend. This indicates high conviction among market participants and suggests that the current price direction is likely to persist, making significant reversals less probable in the short to medium term unless major catalysts emerge.
Technical Outlook Summary
| Indicator | Value | Signal | Interpretation |
|---|---|---|---|
| RSI (14) | 62.34 | Bullish | Strong momentum, room to run. |
| MACD Histogram | Positive | Bullish | Positive momentum confirmed. |
| Stochastic | K=50.07, D=62.23 | Bearish Crossover | Potential short-term pullback signal. |
| ADX | 63.98 | Very Strong Trend | Extreme conviction in the uptrend. |
| Bollinger Bands | Middle Band | Above | Price holding above mid-band supports trend. |
Track markets in real-time
AI-powered analysis, technical indicators and real-time price data.
Join Our Telegram Channel
Breaking market news, AI analysis and trading signals instantly.
Join Channel