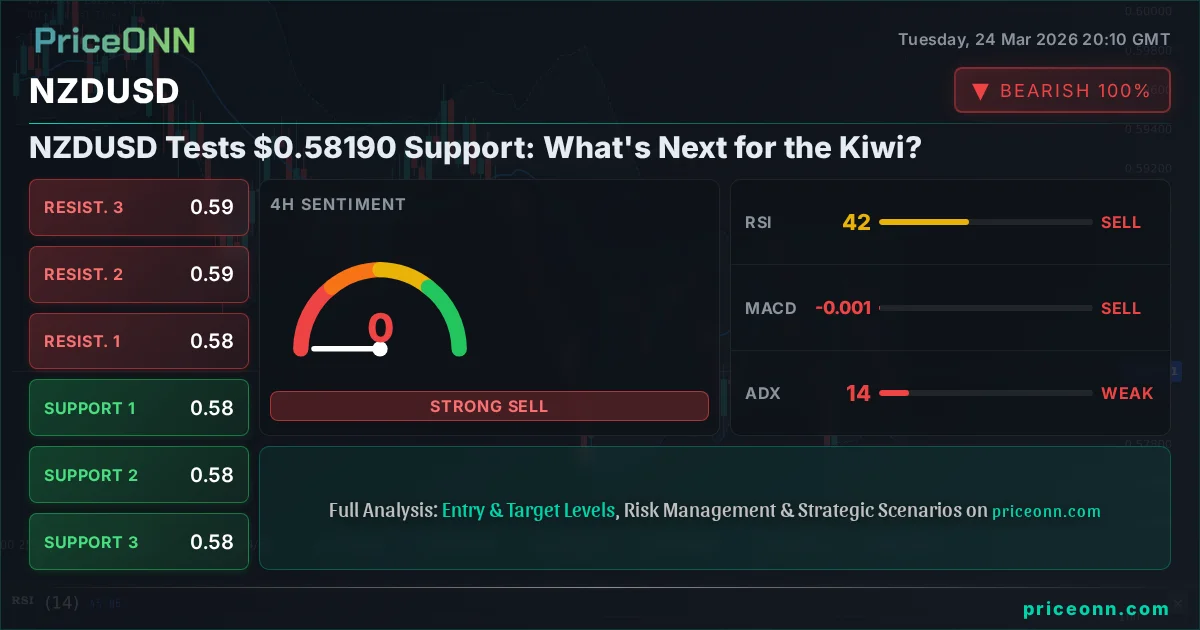
NZDUSD Tests $0.58190 Support: What's Next for the Kiwi?
NZDUSD hovers around $0.58190, testing key support. With the DXY strengthening and risk appetite waning, the focus shifts to whether the $0.57789 level can hold.
The New Zealand Dollar is facing headwinds, with NZDUSD currently trading at $0.58190. This level represents a critical juncture for the pair, as it hovers precariously above a significant support zone. As traders digest mixed signals from global markets, including a strengthening US Dollar and shifting geopolitical sands, the question on everyone's mind is whether the Kiwi can find its footing or if further declines are on the horizon. This multi-scenario analysis delves into the technical and fundamental drivers shaping NZDUSD's immediate future, exploring the probabilities and potential outcomes.
- NZDUSD is trading at $0.58190, testing the crucial support area around $0.57789.
- The US Dollar Index (DXY) is showing strength, currently at 99.2, which typically exerts downward pressure on riskier currencies like the NZD.
- On the 1D chart, RSI is at 42.54, indicating a bearish lean but not yet in oversold territory, suggesting room for further downside.
- The ADX at 30.78 on the daily timeframe points to a strong downtrend, reinforcing the bearish sentiment for NZDUSD.
- Key upcoming events, including potential central bank commentary and economic data releases, will be crucial in determining the next directional move.
The global economic landscape presents a complex picture for currency traders. The US Dollar Index (DXY) has been demonstrating resilience, currently trading at 99.2. This strength in the greenback often correlates with a weaker performance in risk-sensitive currencies, including the New Zealand Dollar. As the DXY pushes higher, it creates a formidable headwind for pairs like NZDUSD, increasing the pressure on the current support levels.
Furthermore, broader market sentiment appears to be leaning towards caution. Major stock indices like the S&P 500, trading at 6557.8, and the Nasdaq 100, at 24010.97, are both showing daily declines. This risk-off sentiment typically favors safe-haven assets and currencies, further amplifying the downward pressure on the NZDUSD pair. The correlation between risk appetite and the Kiwi's performance is well-established; when global markets retreat, the NZD often follows suit.
Looking at the technical indicators for NZDUSD, the daily chart paints a predominantly bearish picture. The Relative Strength Index (RSI) is sitting at 42.54, which, while not deeply oversold, suggests a bearish bias and room for further downward movement before any potential bounce. The Average Directional Index (ADX) on the daily timeframe is at 30.78, indicating a strong downtrend is in play. This confluence of bearish signals from oscillators and trend strength indicators suggests that the path of least resistance for NZDUSD, at least in the short to medium term, appears to be lower.
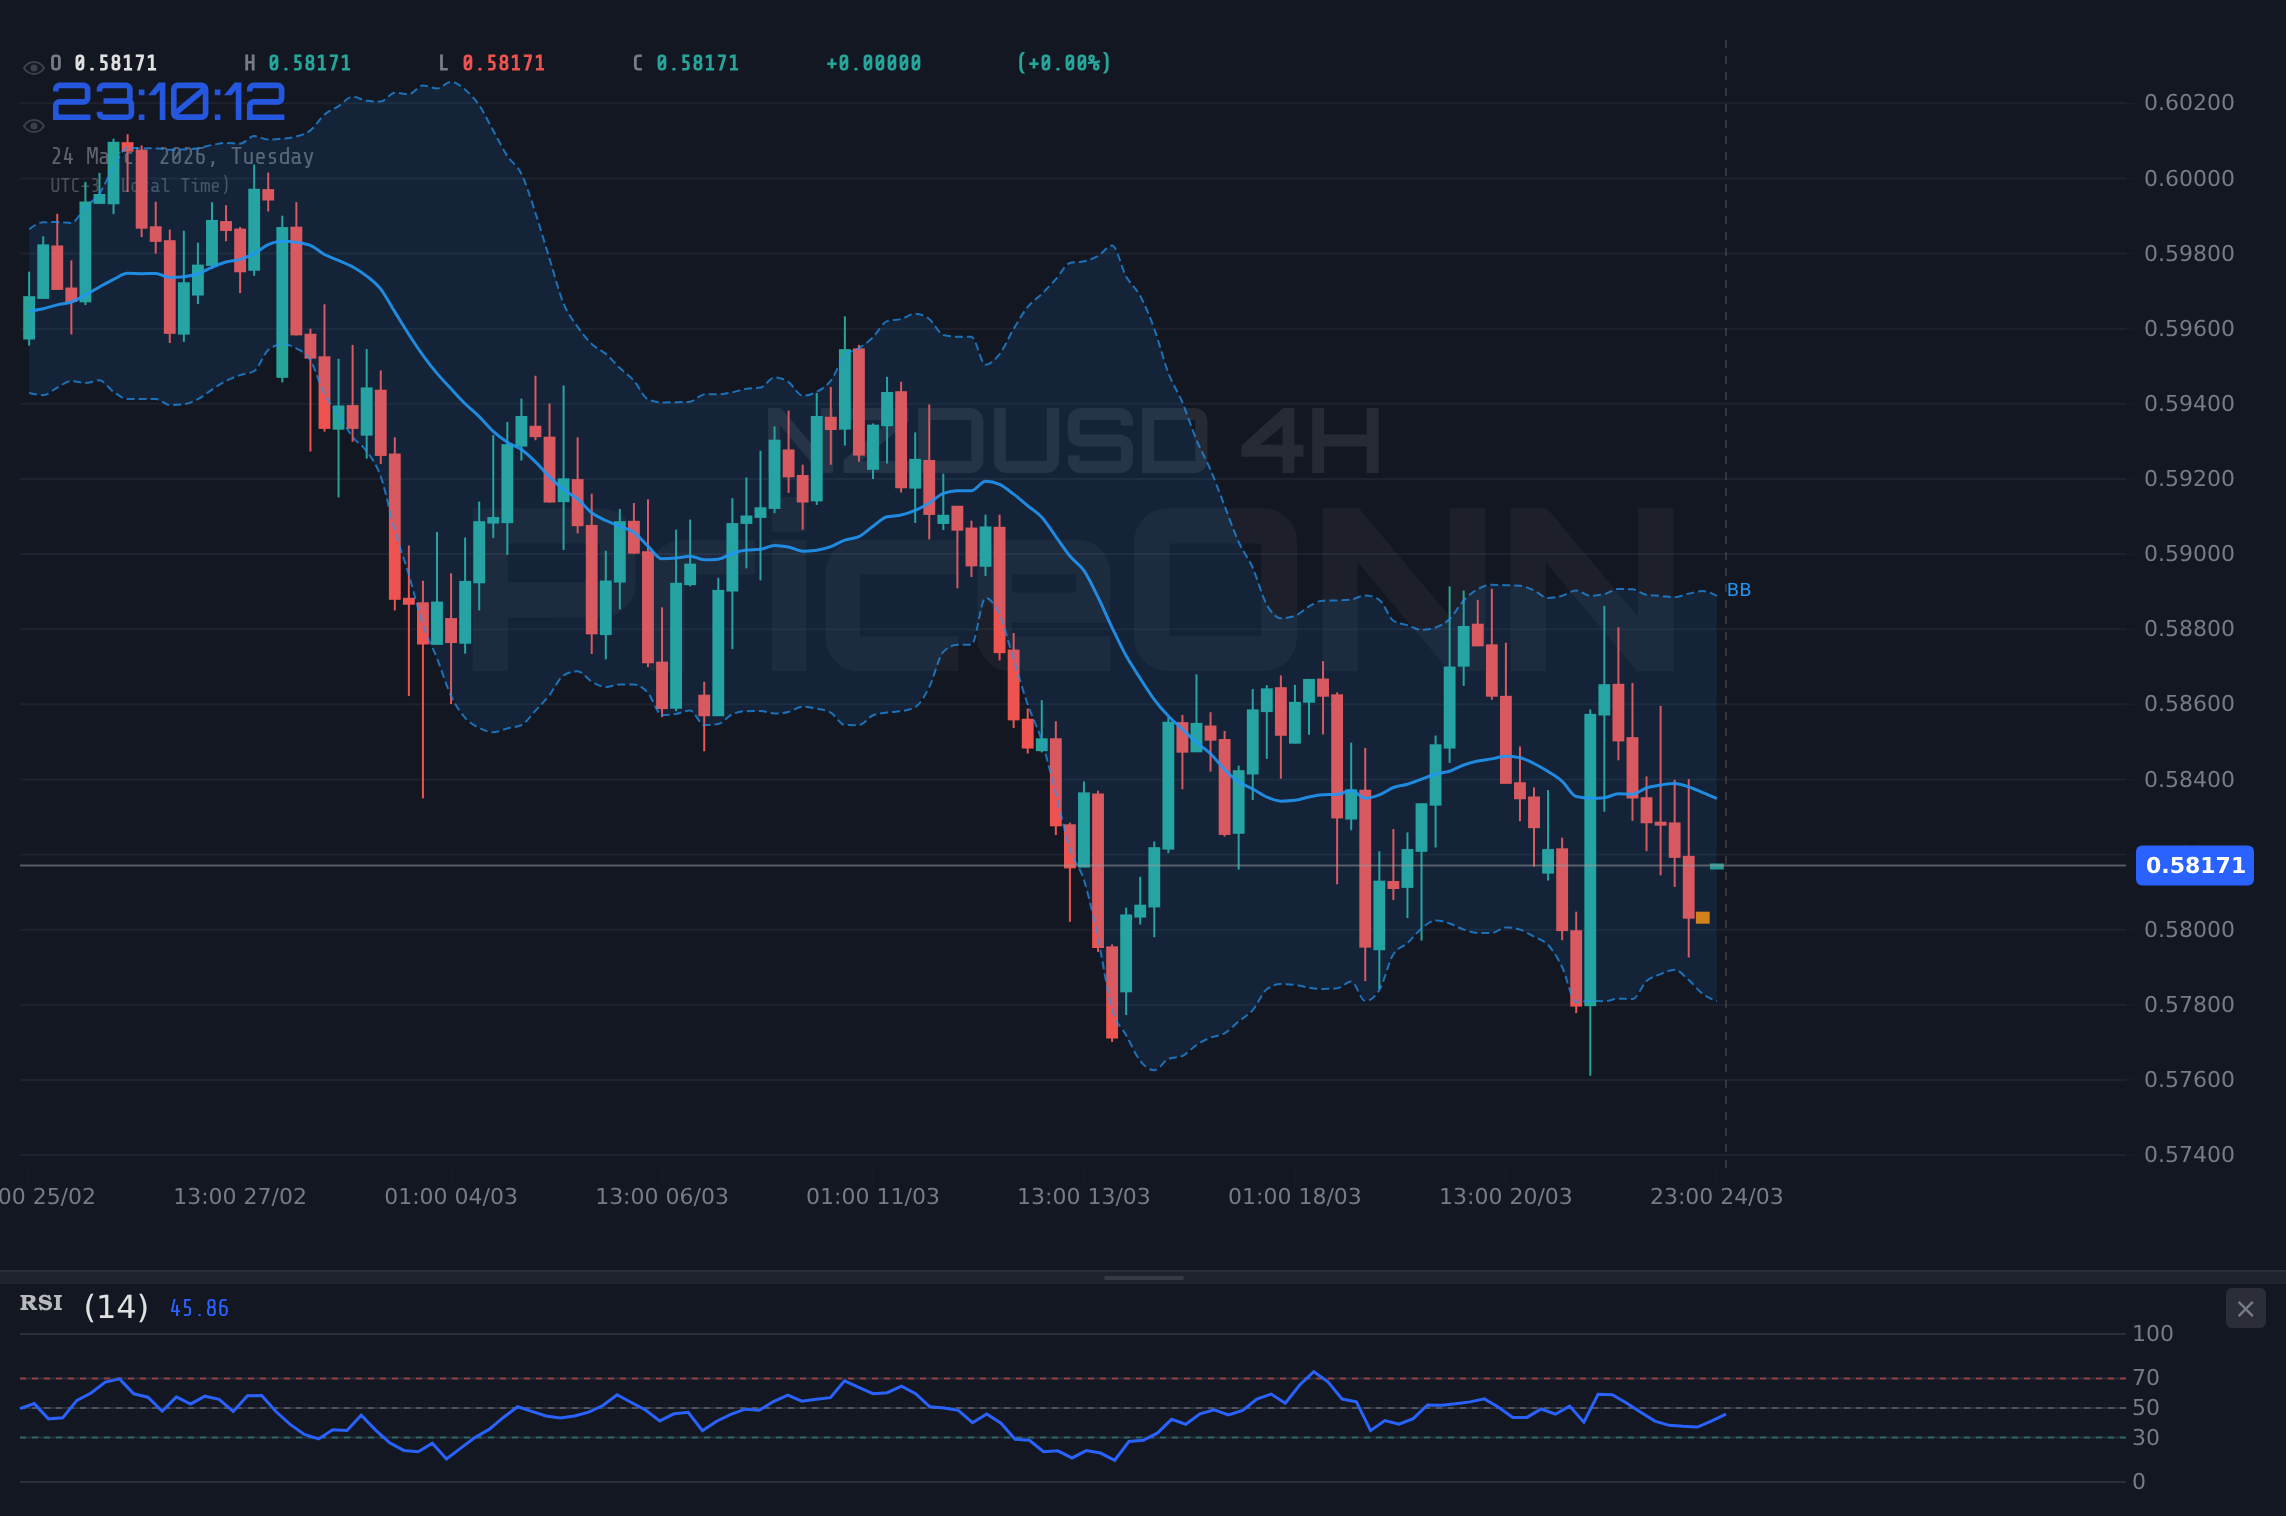
The 4-hour timeframe, however, offers a slightly more nuanced view. While the overall trend is still considered neutral with a 50% strength, the ADX at 14.38 suggests a weak trend, hinting at potential consolidation or a lack of strong directional conviction in this timeframe. The Stochastic Oscillator is showing a bearish signal (%K < %D), but the RSI at 41.83 continues to lean bearish. This divergence between timeframes underscores the importance of watching the key levels closely, as the shorter-term dynamics might offer temporary counter-trend opportunities amidst the larger daily trend.
The 1-hour chart presents a more immediate picture, with a strong downtrend signal (86% strength). The RSI at 45.51, while leaning bearish, is not indicating extreme conditions. The Stochastic Oscillator here shows a potential bullish signal (%K > %D), which could suggest a short-term bounce is possible. However, this is occurring within the context of a negative MACD momentum and Bollinger bands situated above the middle band, suggesting a potential overextension or a brief corrective move rather than a fundamental shift.
The Bear's Roadmap: Downside Targets and Triggers
If the bearish sentiment prevails, the immediate focus will be on the key support level at $0.57789. This level, derived directly from the provided market data, has been identified as a critical floor. A decisive break below this threshold would not only confirm the downtrend but also open the door for further declines. The next significant support level to watch would be $0.57075, followed by $0.56538. These levels represent potential targets for sellers if the bearish momentum intensifies.
The trigger for this bearish scenario would be a clear and sustained close below $0.57789 on the 4-hour chart. Confirmation would be sought from a subsequent failure of any attempted rallies to reclaim this broken level, with increasing selling pressure and potentially higher trading volumes accompanying the move. The strong ADX reading on the daily chart (30.78) supports the idea that once broken, this level could see significant follow-through selling as the market seeks to establish a new lower range.
The invalidation of this bearish thesis would occur if NZDUSD manages to decisively break above the resistance level at $0.58357. A move above this point, particularly with strong buying volume and a positive shift in sentiment indicators like the RSI moving back above 50, would suggest that the immediate downside pressure is easing and a potential reversal is underway. Until then, the bears have a clear path mapped out, targeting the lower support zones.
The Bull's Gambit: Can NZDUSD Find Support?
For the bulls to regain control, NZDUSD needs to demonstrate strength at the current price levels. The immediate resistance to overcome is at $0.58357, followed by $0.58521 and $0.58642. A sustained move above these levels, particularly if accompanied by a break above the daily resistance at $0.59040, would signal a potential shift in momentum. This would likely require a change in the broader market sentiment, perhaps a weakening of the US Dollar or a significant improvement in risk appetite.
The trigger for a bullish reversal would be a decisive close above $0.58357 on the 4-hour chart, followed by consolidation above this level. Confirmation would come from positive divergences on oscillators like the RSI and Stochastic, ideally seeing the RSI climb back above the 50 level and the Stochastic %K line cross above %D in oversold territory. The current daily RSI at 42.54 suggests that there is still significant room for upward movement if buying pressure intensifies, potentially targeting the $0.59040 resistance.
However, the odds are currently stacked against the bulls. The prevailing downtrend on the daily chart, coupled with the strength of the DXY and broader risk-off sentiment, presents significant challenges. For a sustained bullish move to materialize, we would need to see a fundamental shift, such as a change in RBNZ or Federal Reserve policy expectations, or a significant geopolitical de-escalation that boosts global risk appetite. Without these catalysts, any rallies are likely to be viewed as short-covering opportunities by the bears.
The Waiting Game: Consolidation Scenarios
In the absence of a clear directional catalyst, NZDUSD could enter a period of consolidation. This scenario typically occurs when conflicting signals emerge, or when the market awaits significant economic data or central bank decisions. On the 4-hour chart, the ADX reading of 14.38 supports the idea of a weak trend, which often precedes ranging market behavior. In such a phase, price action might oscillate between the immediate support at $0.57789 and resistance at $0.58357.
During consolidation, technical indicators often provide mixed signals. For instance, while the daily chart might show bearish momentum, shorter timeframes could exhibit temporary bullish divergences or oversold conditions that lead to short-lived bounces. Traders in this environment often focus on range-bound strategies, looking to buy near support and sell near resistance. However, the risk during such periods is a sudden breakout driven by unexpected news, which can lead to significant volatility and losses if positions are not managed effectively.
The key to navigating a consolidation phase lies in patience and discipline. Waiting for price to break decisively out of the established range, either to the upside or downside, is often the most prudent approach. The ADX's low reading on the 1-hour chart (11) and 4-hour chart (14.38) suggests that the current trend is not strong, making a breakout plausible once a catalyst emerges. Until then, the market may remain 'stuck' between the defined support and resistance levels.
Bearish Scenario: Kiwi's Descent Continues
70% ProbabilityNeutral Scenario: Range-Bound Trading
20% ProbabilityBullish Scenario: A Kiwi Rebound?
10% ProbabilityFrom a fundamental perspective, the outlook for NZDUSD remains challenging. The Reserve Bank of New Zealand (RBNZ) has been navigating a complex economic environment, balancing inflation concerns with growth prospects. Any hints from RBNZ officials regarding future monetary policy – whether dovish or hawkish – will be closely watched. Similarly, the Federal Reserve's stance on interest rates continues to be a dominant factor, with market participants constantly re-evaluating the timing and pace of potential rate cuts or hikes. The ongoing strength of the DXY suggests that the Fed's policy path, or at least the market's perception of it, is currently more dollar-positive than that of other major central banks.
Geopolitical tensions also continue to cast a shadow over global markets. While recent news regarding Brent crude oil prices plunging after a brief surge above $100 (as reported by multiple sources) might suggest a temporary easing of energy-related inflation fears, the underlying geopolitical landscape remains fragile. Conflicts in the Middle East and other regions can rapidly shift market sentiment, increasing demand for safe-haven assets and currencies like the US Dollar, which in turn weighs on pairs like NZDUSD. Any escalation or de-escalation of these tensions could trigger significant currency movements.
Moreover, the performance of the broader stock markets, such as the SP500 at 6557.8 and Nasdaq 100 at 24010.97, serves as a crucial barometer for risk appetite. With both indices showing downward pressure, it reinforces the prevailing risk-off sentiment. This environment is generally unfavorable for commodity-linked currencies like the NZD, which tend to perform better when global growth prospects are robust and investors are willing to take on more risk. The correlation between the S&P 500's movement and NZDUSD's trajectory is something traders should monitor closely.
The technical picture, especially on the daily timeframe, strongly suggests that the bears are in the driver's seat for NZDUSD. The RSI at 42.54 and ADX at 30.78 are clear indicators of a dominant downtrend. While shorter timeframes might offer fleeting opportunities for counter-trend moves, the overarching trend is bearish. Therefore, the most probable scenario is a continuation of the downside, with the key support at $0.57789 being a critical level to watch. A break below this level would likely accelerate selling pressure.
The probability of a sustained bullish reversal in the near term appears low, given the current macro-economic backdrop and technical indicators. For the bulls to gain traction, a confluence of factors would be required: a significant shift in global risk sentiment, a weakening of the US Dollar driven by dovish signals from the Federal Reserve, or a surprisingly hawkish stance from the RBNZ. Without these catalysts, any rallies are likely to be met with selling pressure as traders look to take profits or re-establish short positions.
Ultimately, the path forward for NZDUSD will be dictated by the interplay of macroeconomic forces, central bank policies, geopolitical developments, and the technical adherence to key price levels. While the immediate outlook leans bearish, the market is dynamic. Traders must remain vigilant, adhering to disciplined risk management strategies and waiting for clear signals before committing to positions. The $0.57789 support level remains the focal point; its defense or decisive breach will likely set the tone for the coming trading sessions.
Frequently Asked Questions: NZDUSD Analysis
What happens if NZDUSD breaks below the $0.57789 support level?
If NZDUSD closes decisively below $0.57789 on the 4-hour chart, it would likely trigger further selling pressure. The next key support target would be $0.57075, with a potential extension towards $0.56538 if the downtrend continues to gain momentum, supported by the daily ADX reading of 30.78.
Should I consider buying NZDUSD at the current levels around $0.58190 given the bearish signals?
Buying at $0.58190 is a high-risk proposition given the prevailing bearish technicals and macro environment. While a short-term bounce is possible from the $0.57789 support, a more prudent approach would be to wait for a confirmed bullish reversal signal, such as a break above $0.58357 with strong volume and positive RSI confirmation.
Is the RSI at 42.54 a sell signal for NZDUSD right now?
An RSI reading of 42.54 indicates a bearish bias but is not yet in oversold territory. It suggests that sellers have more control than buyers at this moment. While not an immediate sell signal on its own, it aligns with the broader downtrend and suggests that rallies might be capped.
How will the upcoming economic data releases affect NZDUSD this week?
Upcoming data, particularly from New Zealand and the US, will be critical. Stronger-than-expected US data could further boost the DXY and pressure NZDUSD lower, while any positive surprises from New Zealand or dovish signals from the Fed could provide a temporary reprieve. Traders should monitor PMI and employment figures closely for potential volatility.
Track markets in real-time
AI-powered analysis, technical indicators and real-time price data.
Join Our Telegram Channel
Breaking market news, AI analysis and trading signals instantly.
Join Channel