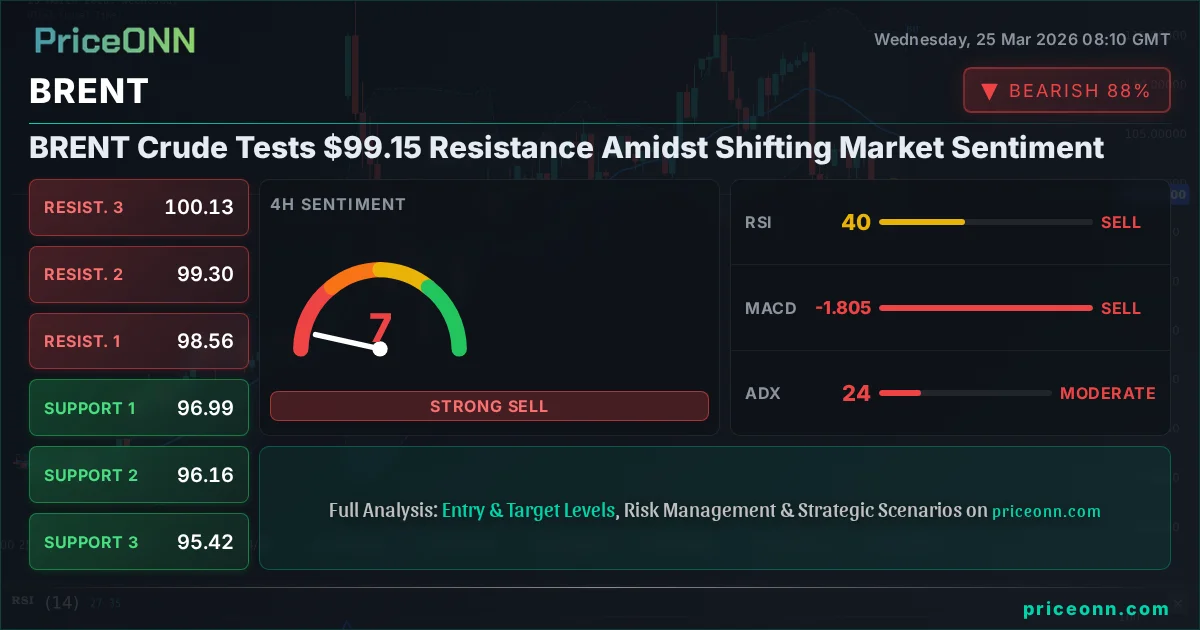
BRENT Crude Tests $99.15 Resistance Amidst Shifting Market Sentiment
BRENT Crude is currently trading at $99.15, approaching key resistance levels. Analysis suggests a complex interplay of technical indicators and fundamental drivers are shaping the immediate outlook.
Brent Crude is hovering around the critical $99.15 mark today, teetering near established resistance levels. This juncture presents a fascinating picture for traders, with conflicting signals emerging from both technical indicators and the broader economic landscape. The question on everyone's mind is whether the recent upward momentum can sustain itself, or if we're poised for a pullback. Understanding the nuances of the current market sentiment, the impact of geopolitical tensions, and the subtle shifts in macroeconomic data is key to navigating this volatile energy market effectively. This analysis delves into the intricate details, aiming to provide a clear perspective on where BRENT might be headed next.
- With RSI at 39.95 on the 1H chart, bearish pressure is evident, suggesting caution despite the current price near resistance.
- Key resistance for BRENT is identified at $100.47, a level that needs to be decisively breached for a sustained rally.
- The ADX at 37.54 on the 1H chart indicates a strong bearish trend, contradicting short-term price action.
- The correlation with a firming DXY at 99.09 adds another layer of complexity, potentially capping oil price gains.
Navigating the $99.15 Crossroads: A Technical Snapshot
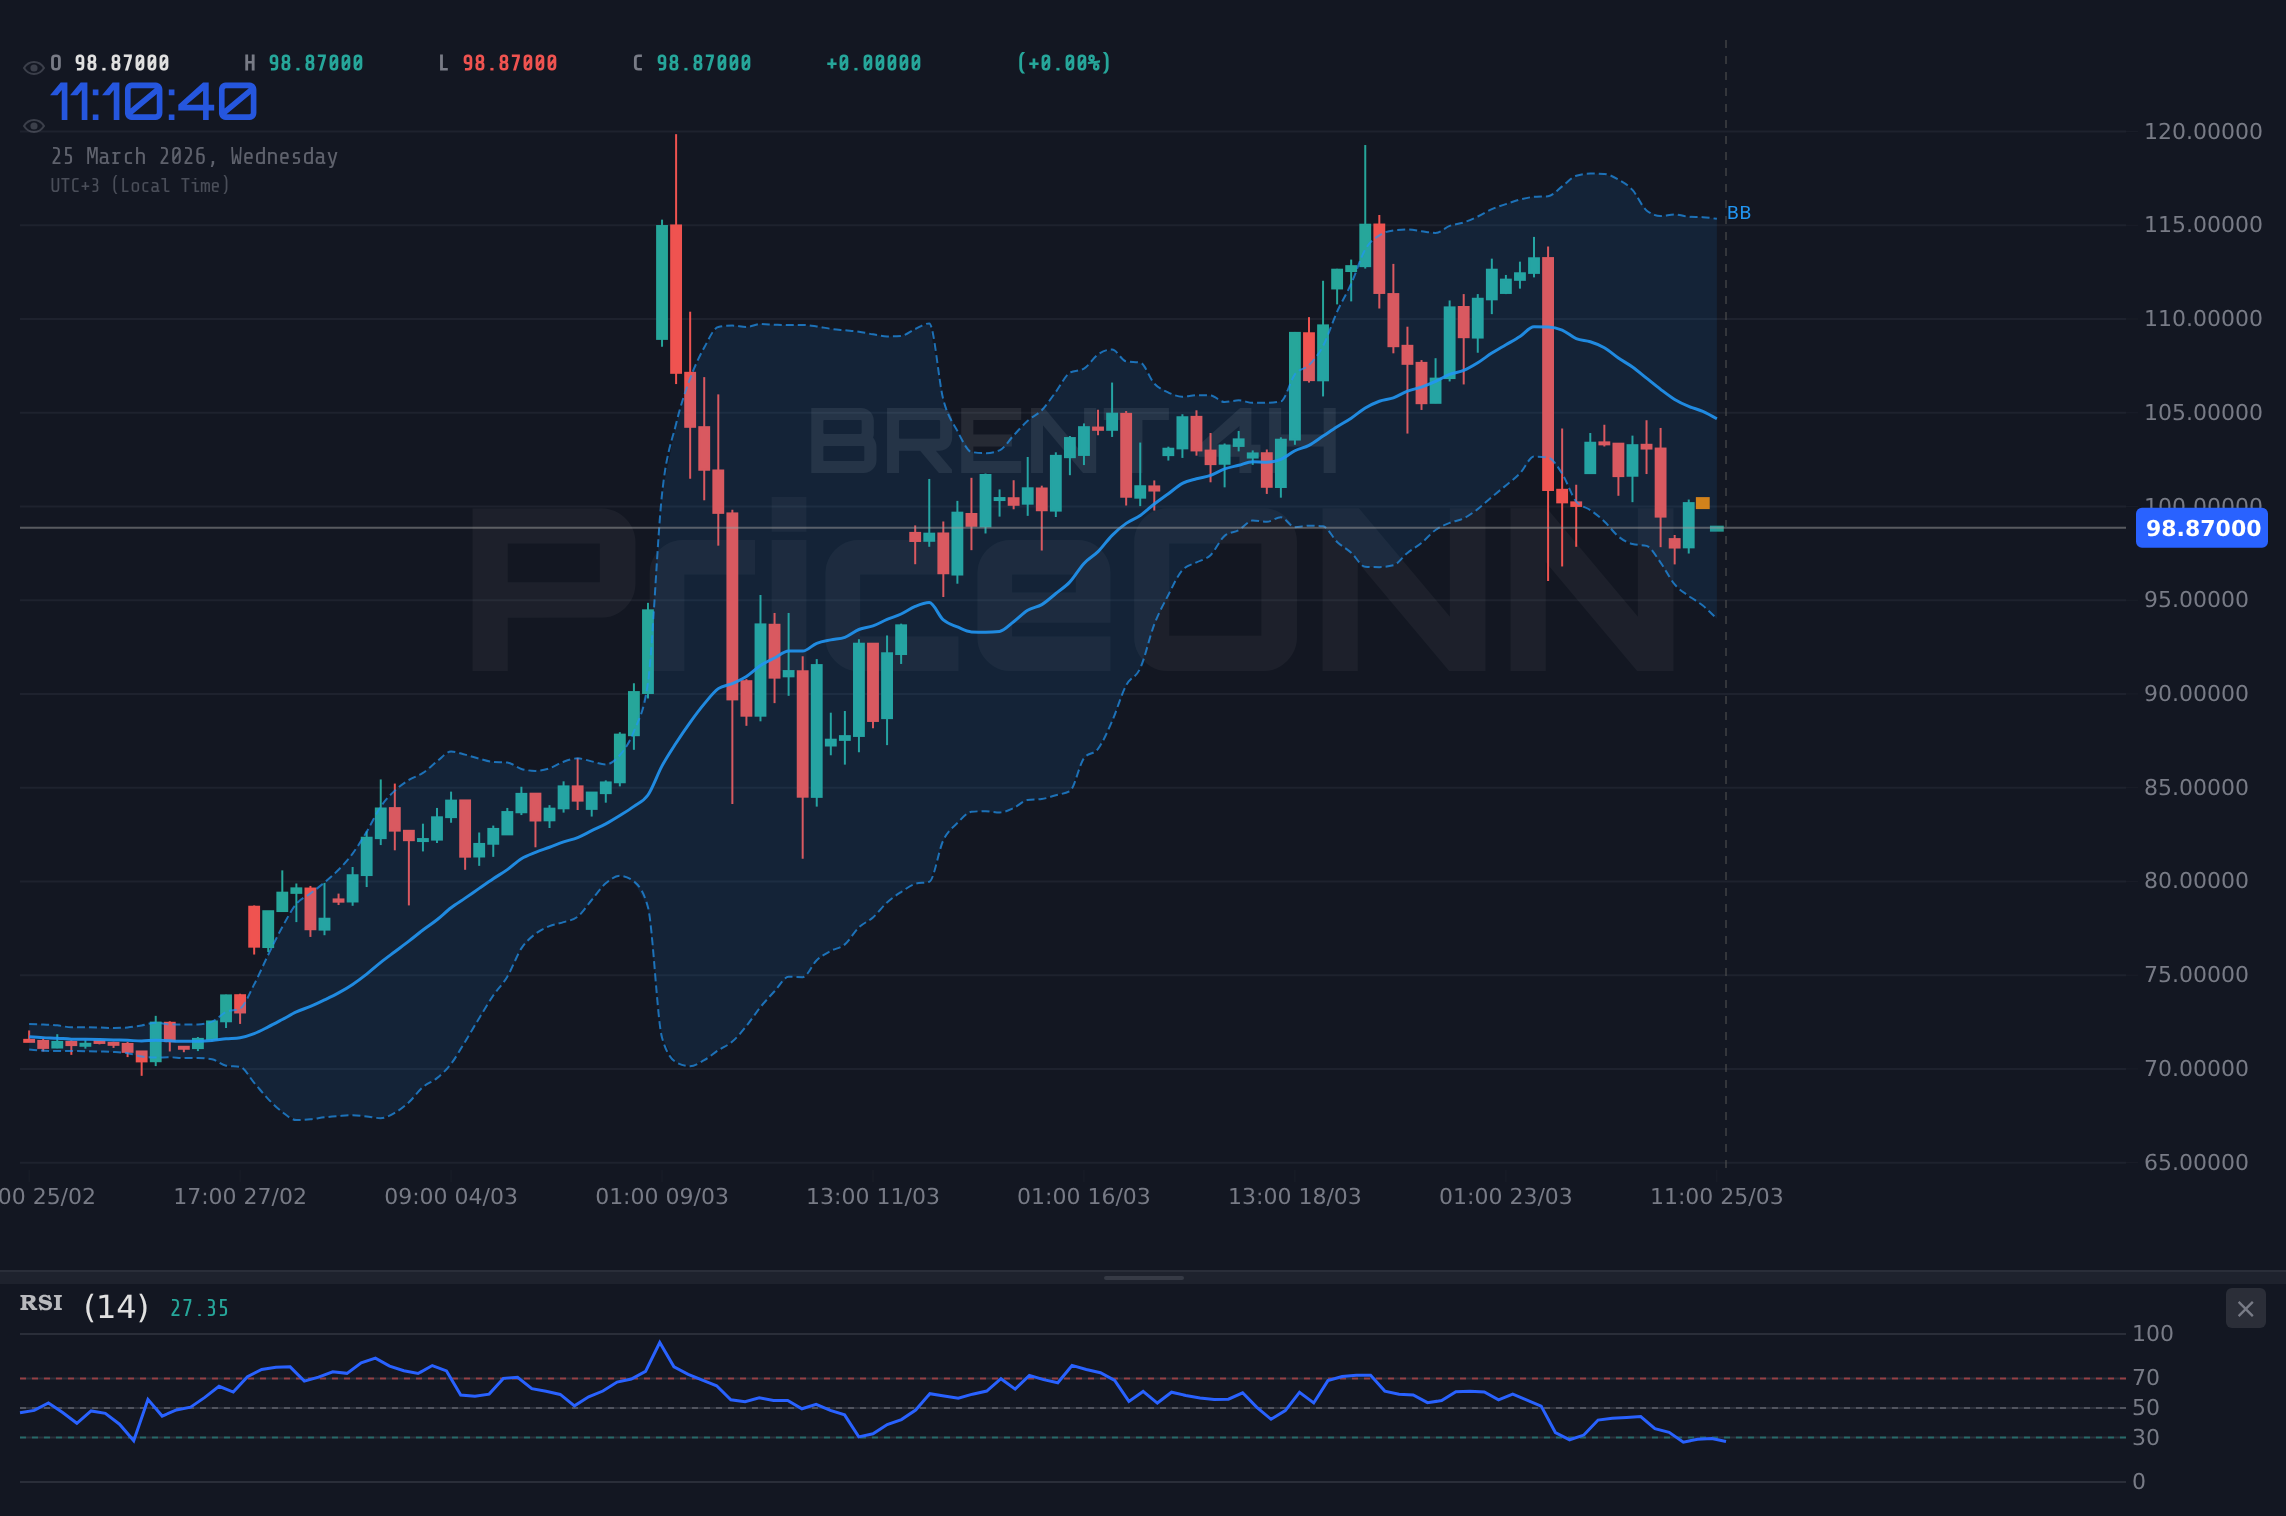
Brent Crude's current position at $99.15 is more than just a price point; it's a battleground where bulls and bears are locked in a tense standoff. On the 1-hour chart, the trend might appear neutral, with an ADX reading of 37.54 suggesting a strong downward trend is still in play, despite the price hovering near the upper Bollinger band. This divergence is crucial. While the price is testing resistance, the underlying trend indicators are flashing caution. The RSI at 39.95 further supports this, indicating bearish momentum is building, not fading. Traders are watching closely to see if this resistance at $100.47 can be broken. A failure here could see prices retreat towards the $99.22 support, and potentially lower if the broader bearish signals gain traction.
The Stochastic Oscillator on the 1-hour timeframe presents a particularly interesting, albeit confusing, picture. With the %K line at 40.73 and the %D line at 32.59, it suggests a potential upward move is building. However, this conflicts with the RSI and ADX readings. In such scenarios, confirmation is king. A sustained move above $99.31, coupled with increasing volume and a shift in the ADX, would be needed to invalidate the bearish undertones. Conversely, a break below $99.22 could accelerate a move lower, targeting the $98.73 support level. The price action around $99.15 is telling a story of indecision, but the technical indicators, particularly on the longer timeframes, lean towards caution.
Looking at the 4-hour chart, the picture becomes even more nuanced. Here, the trend is still classified as neutral, but the ADX at 24.18 shows a moderately strong downward trend. The RSI is also sitting in bearish territory at 40.47, indicating room for further downside. The Stochastic oscillator, however, shows %K at 20.41 and %D at 30.99, suggesting oversold conditions and a potential bounce. This conflict between the RSI and Stochastic, coupled with the price action testing resistance, highlights the current market indecision. The key support on this timeframe is $96.99, and resistance is at $98.56. A move beyond either of these levels would provide much-needed clarity.
The daily chart paints a broader, more bullish picture, with the trend identified as 'Up' with a strength of 100%. This is somewhat at odds with the shorter-term indicators. The daily RSI is at 59.98, which is neutral but trending upwards, suggesting potential for further gains. However, the MACD is showing negative momentum, and the Stochastic is in oversold territory, with %K at 24.32 and %D at 56.38, signalling a potential upside reversal. The ADX at 63.2 is exceptionally high, indicating a very strong trend, but its directionality is crucial. A strong trend at these levels, combined with a daily RSI not yet in overbought territory, could suggest further upside potential if the bulls can overcome the immediate resistance. The significant support at $96.66 on this timeframe looms large as a potential floor.
Fundamental Forces Shaping the BRENT Narrative
The price of BRENT Crude is never just about supply and demand in a vacuum; it's intricately linked to global economic health, geopolitical stability, and central bank policies. Currently, the market is digesting mixed economic signals. On the positive side, the US ISM Manufacturing PMI came in at 52.4, beating forecasts of 51.5. This suggests some resilience in the US manufacturing sector, which could translate to sustained energy demand. However, other data points paint a less rosy picture. The US ISM Services PMI fell to 51.1, missing expectations of 52, hinting at potential weakness in the services sector, which is a significant consumer of energy.
Adding to the complexity are the actions of central banks. While the Federal Reserve's stance remains a key driver, the data emerging from other major economies also plays a crucial role. The UK's Services PMI, while not providing a specific number, had a previous reading of 1. This suggests a potentially sluggish economic environment in the UK, which could impact European energy demand. Similarly, the Eurozone's manufacturing data has been weak, with a previous reading of 0.2 for manufacturing output. These factors contribute to an uncertain global demand outlook, creating headwinds for oil prices despite any geopolitical supply concerns.
Geopolitics continues to be a significant, albeit unpredictable, factor. While the provided news feed indicates receding geopolitical fears in some areas, the underlying tensions, particularly concerning major oil-producing regions, remain a constant threat. Any escalation or unexpected disruption in supply chains, especially from the Middle East, could send BRENT prices soaring. The article mentioning Europe's reliance on US LNG highlights a broader energy security dynamic that could indirectly influence crude oil prices as nations diversify their energy sources. The market is constantly balancing the immediate supply/demand picture with the ever-present risk of geopolitical shocks.
The correlation with the US Dollar Index (DXY) is another fundamental aspect to monitor. With the DXY currently trading around 99.09 and showing signs of strength on shorter timeframes, it generally exerts downward pressure on dollar-denominated commodities like BRENT. A stronger dollar makes oil more expensive for holders of other currencies, potentially dampening demand. However, the relationship isn't always linear, especially when oil prices are driven by supply-side concerns or inflation expectations rather than pure demand dynamics. The current interplay between a firming dollar and fluctuating oil prices suggests that market participants are weighing multiple factors, making directional bets challenging.
The Interplay of Indicators: A Conflicting Signal Landscape
Delving deeper into the technical indicators, the conflicting signals on BRENT Crude are undeniable. On the 1-hour chart, the RSI at 39.95 is firmly in bearish territory, suggesting sellers are in control. However, the Stochastic oscillator (%K=40.73, %D=32.59) hints at a potential bounce, with the %K line crossing above the %D line. This is a classic case of conflicting signals, where one indicator points to downside continuation while another suggests a short-term reversal. The ADX at 37.54 on this timeframe underscores the strength of the prevailing trend, which, based on this reading, is downwards. This implies that any upward movement might be a retracement rather than a genuine trend change.
The 4-hour timeframe offers a similar dichotomy. The RSI at 40.47 continues to hover in the bearish zone, indicating sellers have the upper hand. Yet, the Stochastic (%K=20.41, %D=30.99) is showing a bullish crossover, indicating oversold conditions and a potential buying opportunity. The ADX here, at 24.18, suggests a moderately strong downward trend. This conflict means that traders should be wary of making aggressive moves based on a single indicator. Confirmation from price action, such as a decisive break above resistance or a solid hold of support with increased volume, is paramount.
On the daily chart, the broader trend might be classified as 'Up' (ADX 63.2, RSI 59.98), but the momentum indicators are painting a different story. The MACD is showing negative momentum, and the Stochastic oscillator (%K=24.32, %D=56.38) is in oversold territory, suggesting a potential upside reversal is brewing. The extremely high ADX value of 63.2 on the daily chart indicates a very strong, established trend, but its direction needs careful interpretation in conjunction with other indicators. If this strong trend is indeed bullish, the current pullback might be a healthy correction before the next leg higher. However, the negative MACD momentum cannot be ignored and suggests that the bulls need to regain control quickly to validate the upward trend.
The Bollinger Bands also provide context. On the 1-hour and 4-hour charts, the price is trading above the middle band, which generally supports a bullish bias. However, on the daily chart, the price is below the middle band, indicating a bearish bias in the longer term. This discrepancy across timeframes highlights the fragmented nature of the current market sentiment for BRENT. The middle band on the daily chart, currently around $96.66, acts as a significant pivot. A close below this level would reinforce the bearish sentiment indicated by the daily MACD and RSI.
Trading Scenarios and Strategic Considerations
Given the conflicting technical signals and the mixed fundamental backdrop, a cautious approach is warranted for BRENT Crude. The immediate price action around $99.15, testing resistance, is the primary focus. If the bulls can muster enough strength to push BRENT decisively above the $100.47 resistance, confirmed by strong volume and positive momentum across shorter timeframes, then a move towards the next resistance at $100.96 and potentially $101.34 could unfold. This scenario would likely be fueled by supply-side disruptions or a sudden surge in risk appetite. However, the bearish undertones from the RSI and ADX on shorter timeframes suggest this might be a less probable outcome in the immediate term.
Conversely, if BRENT fails to break the $100.47 resistance and turns lower, the downside targets become relevant. The first significant support level to watch is $99.22. A break below this could accelerate towards $98.73, and potentially even lower towards the $96.99 support zone identified on the 4-hour chart. This bearish scenario would be amplified if DXY continues to strengthen or if upcoming economic data points to a significant slowdown in global demand. The strong ADX readings on shorter timeframes lend credence to the possibility of a bearish continuation.
A neutral or range-bound scenario is also highly plausible, especially if conflicting signals persist and key economic events offer no clear direction. In this case, BRENT might consolidate between the current resistance around $99.15-$100.47 and the support levels near $98.73-$99.22. Such consolidation could be a prelude to a larger move once clearer signals emerge. Traders might look to scalp opportunities within this range, but the risk of a breakout in either direction remains, especially given the strong trend signals on the daily chart.
Bearish Scenario: Retreat Below Resistance
65% ProbabilityBullish Scenario: Breakout Above Resistance
25% ProbabilityNeutral Scenario: Consolidation Phase
10% ProbabilityFrequently Asked Questions: BRENT Analysis
What happens if BRENT breaks below the $99.22 support level?
A break below $99.22 would invalidate the immediate bullish sentiment and could trigger a move towards the $98.73 support. This would likely be driven by a confluence of bearish technical signals and potentially negative economic news.
Should I buy BRENT at current levels of $99.15 given the conflicting signals?
Given the mixed signals and the approach to resistance, buying at current levels carries significant risk. A high-probability setup would require confirmation of a breakout above $100.47 or a clear bounce from support levels like $98.73, with improved volume and momentum.
Is the RSI at 39.95 a sell signal for BRENT right now?
An RSI reading of 39.95 on the 1-hour chart indicates bearish momentum is present. While not an immediate sell signal on its own, it suggests that upside potential might be limited and that selling rallies could be a more prudent strategy until clearer bullish confirmation emerges.
How will upcoming economic data affect BRENT prices this week?
Upcoming economic data, particularly from the US and Europe, will be crucial. Stronger-than-expected data could boost demand and support BRENT, while weaker data might increase recession fears and pressure prices downwards, especially if coupled with a stronger dollar.
The path forward for BRENT Crude remains uncertain, characterized by a tug-of-war between short-term technical signals and longer-term fundamental drivers. While the daily chart might hint at underlying strength, the immediate picture is one of caution. Traders should remain vigilant, paying close attention to price action around the $99.15 level and the critical resistance at $100.47. Confirmation of a clear directional move, supported by robust volume and consistent indicator signals across multiple timeframes, will be essential for navigating these choppy waters. Patience and disciplined risk management remain the most valuable tools in this environment.
Track markets in real-time
AI-powered analysis, technical indicators and real-time price data.
Join Our Telegram Channel
Breaking market news, AI analysis and trading signals instantly.
Join Channel