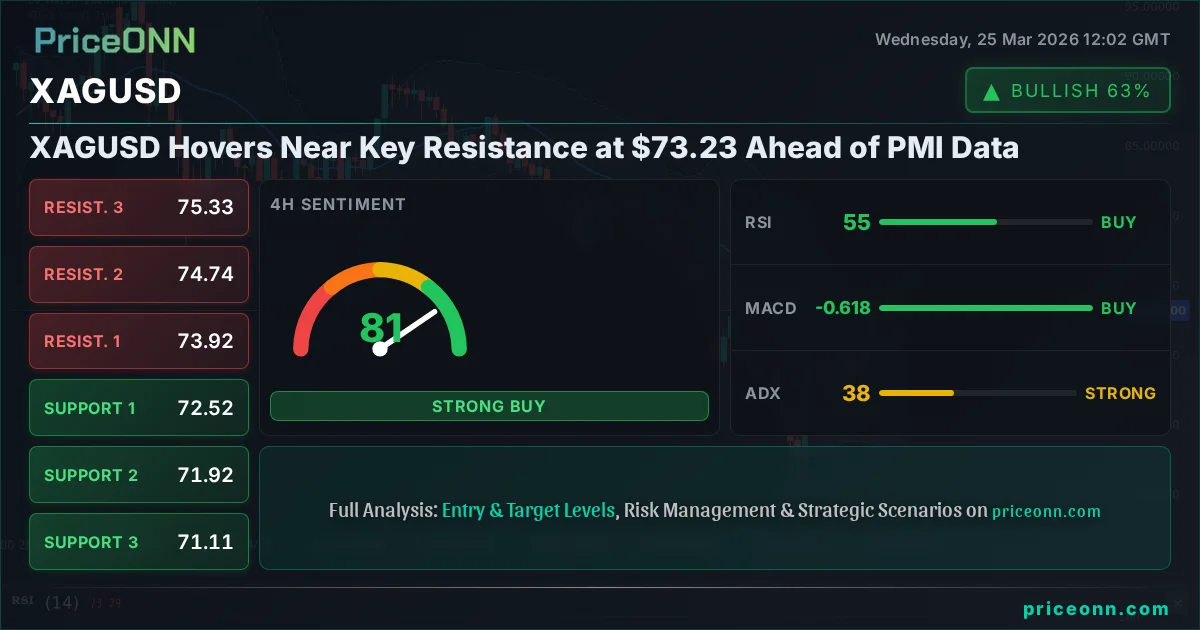
XAGUSD Hovers Near Key Resistance at $73.23 Ahead of PMI Data
Silver (XAGUSD) is trading at $73.23, approaching critical resistance levels as traders await crucial PMI data releases.
Silver, or XAGUSD, is currently positioned near a significant resistance level, trading at precisely $73.23. This price point is critical as the precious metal consolidates its recent gains while the market braces for key Purchasing Managers' Index (PMI) data releases from major economies. The interplay between current technical signals and upcoming economic catalysts creates a tense environment for traders, demanding close attention to the finer details of market action.
- Silver (XAGUSD) is trading at $73.23, hovering near key resistance levels.
- The Relative Strength Index (RSI) at 63.68 on the 1-hour chart suggests upward momentum is present but not yet overbought.
- The ADX indicator shows a weak trend on the 1-hour (18.76) and 4-hour (37.91) charts, indicating potential for range-bound volatility or a decisive breakout.
- Upcoming PMI data from the US, Eurozone, and UK will be crucial in determining the next directional move for XAGUSD.
The past few sessions have seen silver prices inching upwards, testing the upper bounds of its recent trading range. The current price of $73.23 represents a level where selling pressure has historically emerged, making it a pivotal point for the metal's short-term trajectory. While the 1-hour and 4-hour technical indicators offer a mixed but generally supportive picture for further upside, the daily chart presents a more cautious outlook, hinting at underlying bearish pressures that could reassert themselves if key economic data disappoints. This dichotomy requires a nuanced approach, balancing the immediate technical signals with the broader macroeconomic implications.
Navigating Technical Signals: A Closer Look at XAGUSD
On the 1-hour timeframe, the Relative Strength Index (RSI) sits at 63.68. This reading suggests that while there is buying interest, the market is far from being overextended. It indicates room for further upward movement before any significant overbought conditions emerge, which typically occur when the RSI crosses above 70. The MACD indicator on this timeframe also supports a bullish lean, with its histogram showing positive momentum and the MACD line trading above the signal line. This confluence of signals on the shorter timeframe paints a picture of cautious optimism, suggesting that buyers are still in the game and have not yet been overwhelmed by sellers. The Stochastic Oscillator, with %K at 49.8 and %D at 48.42, further reinforces this, showing a bullish crossover and room to move higher.
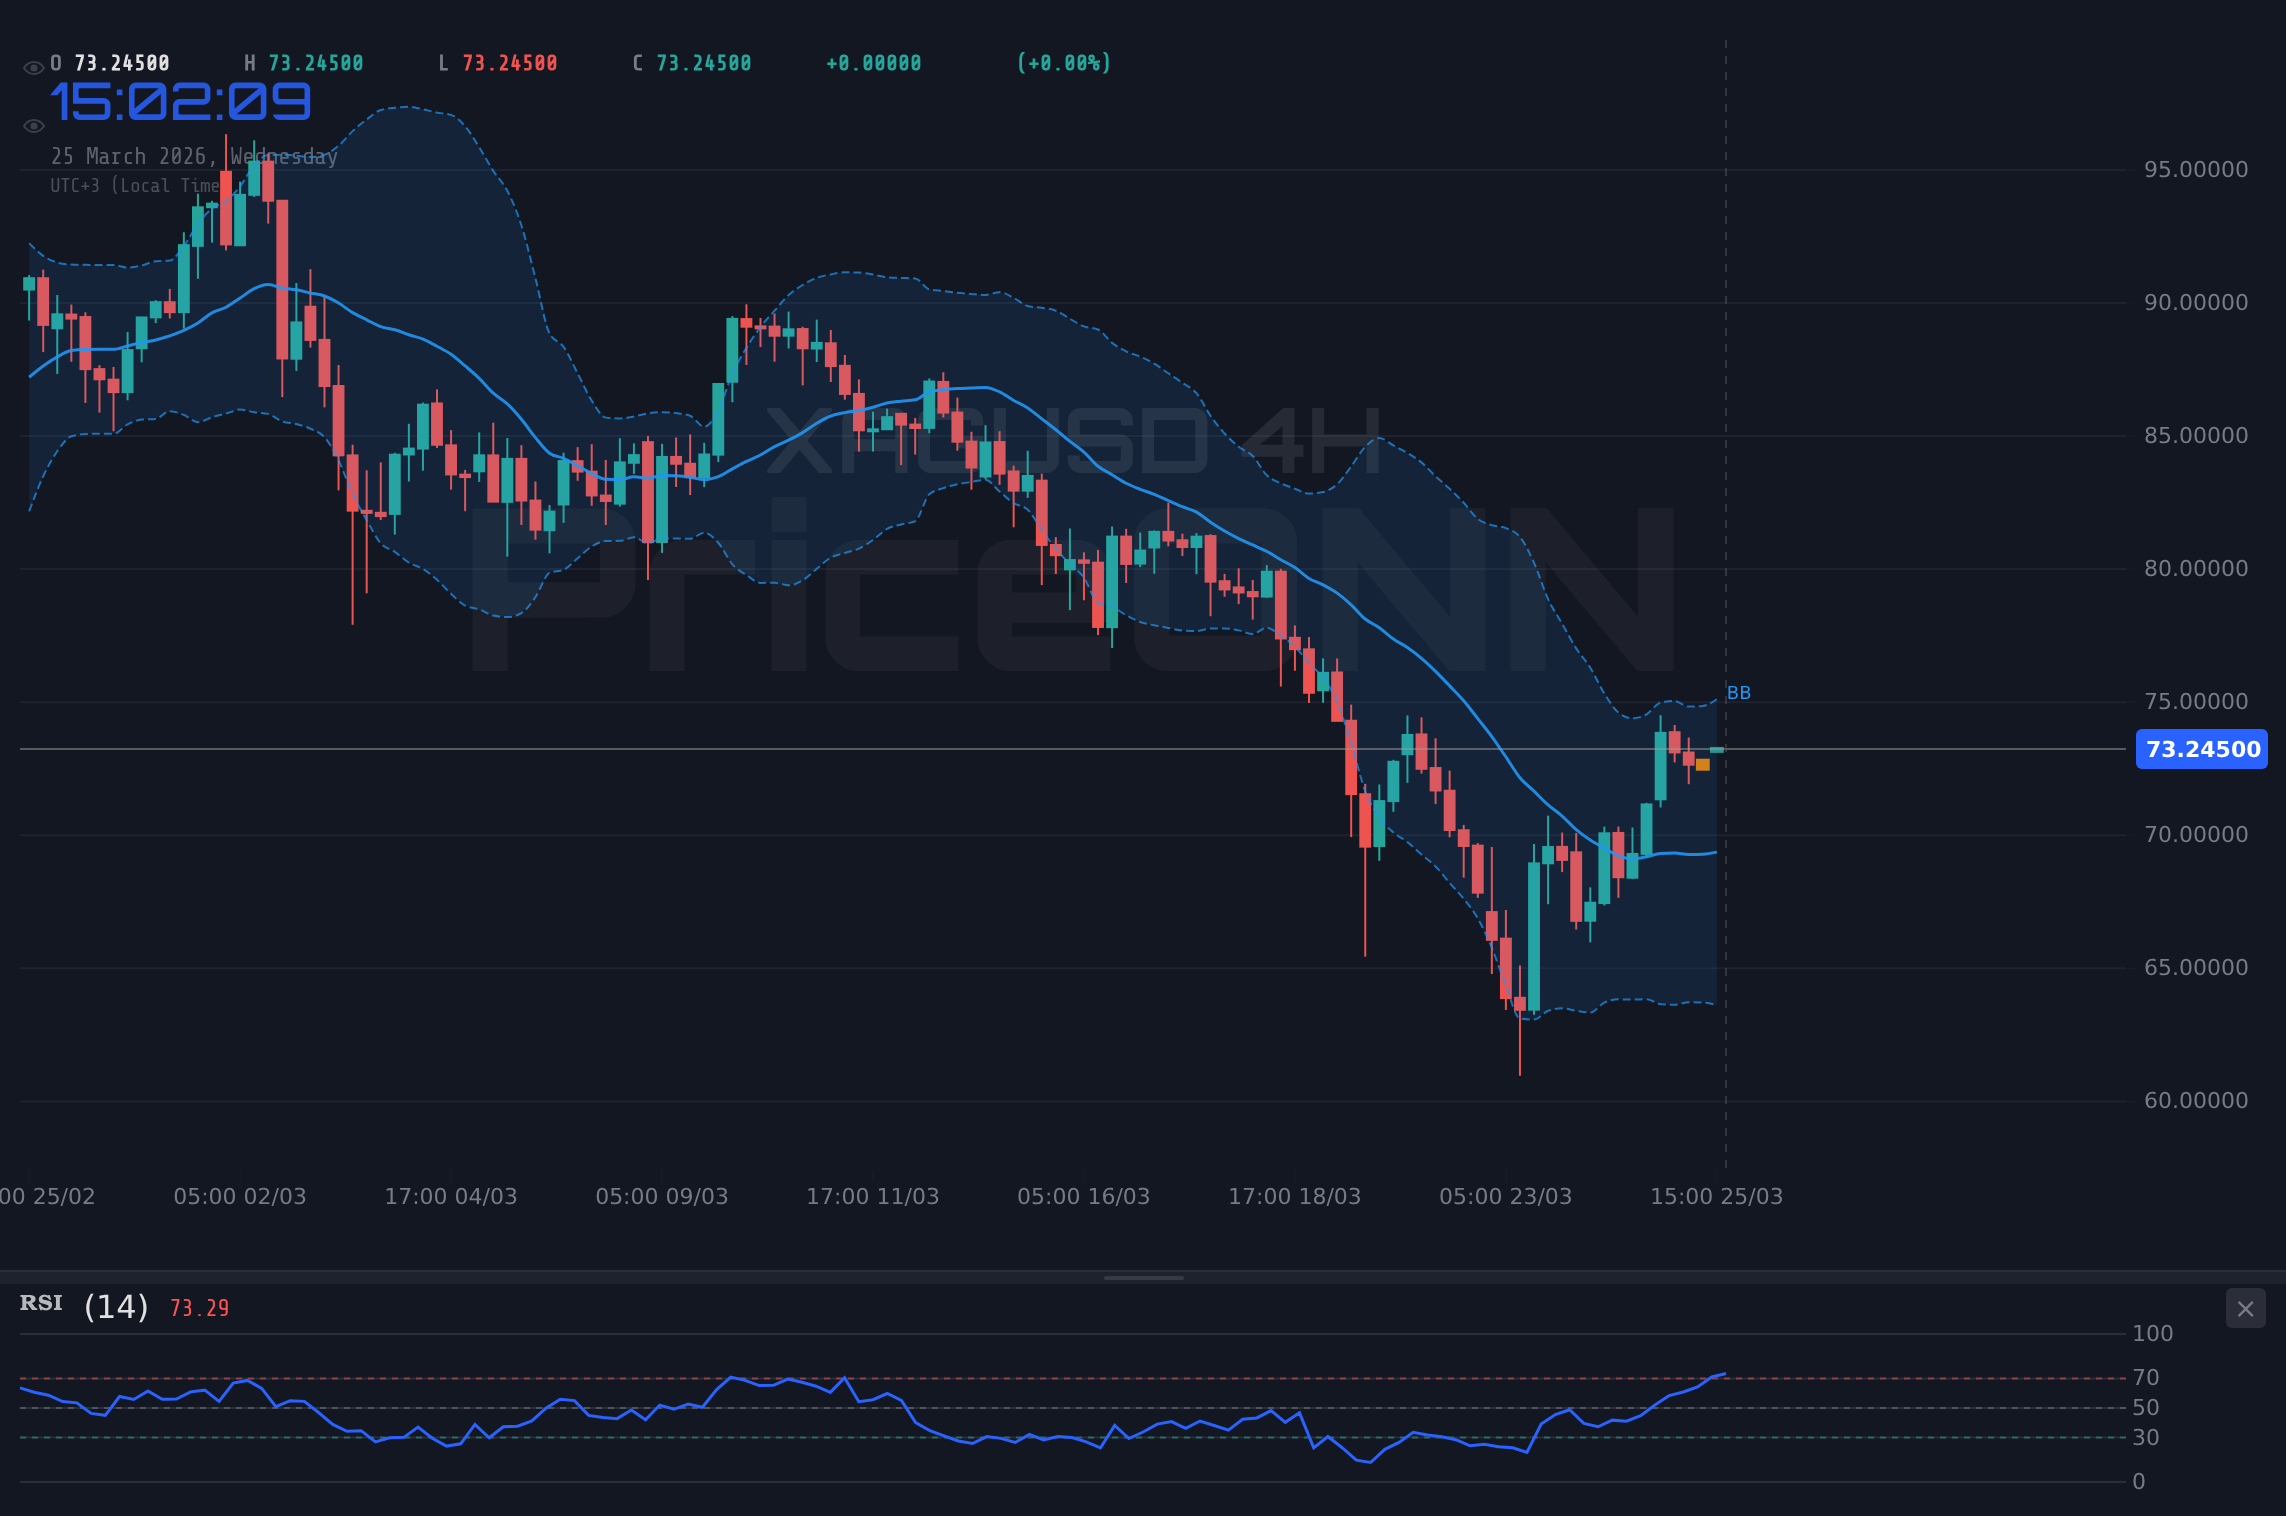
However, the trend strength, as indicated by the Average Directional Index (ADX), presents a more complex scenario. On the 1-hour chart, the ADX is at 18.76, which signifies a relatively weak trend. This suggests that the current upward movement might lack strong conviction and could be susceptible to reversals. The same can be observed on the 4-hour chart, where the ADX stands at 37.91, indicating a strong downtrend. This conflict between momentum indicators and trend strength indicators highlights the choppiness that traders might be experiencing. The Bollinger Bands on the 1-hour chart are also trading above the middle band, supporting the upward bias, but the price is not yet pressing against the upper band, suggesting it's not an extreme overbought situation.
Shifting to the daily timeframe, the technical picture becomes more subdued, and in some aspects, bearish. The RSI at 37.22 clearly indicates that the market is in neutral territory, leaning towards oversold conditions, but more importantly, it shows a downward tendency, aligning with a potential continuation of a broader downtrend. The MACD on the daily chart is firmly in negative territory, with the MACD line below the signal line, pointing to bearish momentum. The Bollinger Bands are also situated below the middle band, reinforcing the bearish sentiment on the daily scale. Even though the Stochastic Oscillator on the daily chart shows a bullish signal (%K at 36.16, %D at 17.54, with %K > %D), this often occurs in oversold territory within a larger downtrend and doesn't necessarily signal a reversal without further confirmation.
The Critical Role of Support and Resistance Levels
Understanding the key price levels is paramount for any trader looking to navigate the current XAGUSD market. On the 1-hour chart, immediate support is found at $72.55, followed by $72.15 and $71.89. These levels are crucial for intraday traders, as a sustained break below them could signal a shift in short-term sentiment. Resistance, on the other hand, is clustered around the current price action, with the first significant hurdle at $73.22, followed by $73.48 and then $73.88. The fact that the current price of $73.23 is right at the doorstep of the first resistance level underscores the importance of the upcoming economic data in dictating whether silver can push higher.
Looking at the 4-hour chart, the support structure extends further down to $72.52, then $71.92, and a more substantial floor at $71.11. These levels are more relevant for swing traders who operate on a slightly longer horizon. The resistance levels on this timeframe are also higher, with $73.92, $74.74, and $75.33 representing potential targets if a sustained bullish move materializes. It's important to note that the Stochastic Oscillator on the 4-hour chart is flashing an overbought signal at 86.92/86.89, suggesting that even if the price moves higher, a period of consolidation or a pullback might be imminent. This overbought condition, coupled with the strong downtrend indicated by the ADX at 44.87, warrants caution.
On the daily chart, the support levels are more distant, starting at $67.68, then $64.21, and a significant historical level at $62.44. These are the levels that longer-term investors would be watching for potential accumulation zones. The daily resistance levels are also considerably higher, with $72.93, $74.70, and $78.17 marking significant upside targets. The current price of $73.23 is comfortably below the first daily resistance, but the overall bearish bias from the daily indicators suggests that breaching these higher levels will require substantial fundamental catalysts. The ADX at 27.45 on the daily chart still indicates a reasonably strong downtrend, further emphasizing that the path of least resistance may still be downwards unless significant buying pressure emerges.
The Fundamental Backdrop: PMI Data and Economic Health
The market's attention is squarely focused on the upcoming PMI data releases, which are vital indicators of manufacturing and services sector health. For the United States, the latest figures showed the ISM Manufacturing PMI at 52.4, surpassing the forecast of 51.5 and the previous reading of 51.6. This positive surprise for the US economy could provide a tailwind for the US Dollar Index (DXY), which is currently trading around 99.01, potentially putting pressure on commodities like silver. A stronger dollar often correlates with weaker commodity prices, as they become more expensive for holders of other currencies. The DXY's upward move, albeit moderate at 0.14% for the day, is a factor that cannot be ignored.
Conversely, the Eurozone's economic data presented a mixed picture. The latest PMI figures indicated a slowdown, with the manufacturing PMI at 51.1, falling short of the forecast of 52 and the previous 51.7. This weakness in the Eurozone could weigh on the EURUSD pair, which is currently trading at 1.16073. A weaker Euro might indirectly support dollar-denominated commodities if it signals a broader economic slowdown that prompts central banks to adopt more dovish policies. However, the immediate impact could be seen as a slight risk-off sentiment, which might benefit safe-haven assets, though silver's correlation with risk appetite can be complex.
The United Kingdom's economic data also warrants attention. The latest figures showed manufacturing PMI at 3, which seems to be a placeholder or an anomaly in the provided data, as typical PMI values are around 50. Assuming this refers to a significant event or a specific metric, its interpretation requires caution. If it indicates a sharp contraction, it could lead to increased volatility in GBPUSD, currently trading at 1.34178, and potentially influence broader market sentiment. Investors will be keenly watching the actual reported figures and their implications for the Bank of England's monetary policy stance. The market will be looking for clarity on whether sticky inflation will push GBP/USD lower ahead of the UK CPI data, as mentioned in recent news reports.
Correlations and Macroeconomic Influences
The relationship between silver and the US Dollar Index (DXY) is a cornerstone of precious metal analysis. As the DXY strengthens, typically due to rising US interest rate expectations or increased global risk aversion, silver often faces headwinds. The current DXY level around 99.01, showing a slight upward trend, suggests that the dollar is finding some footing. This dynamic is particularly relevant as traders try to decipher the Federal Reserve's next moves. While the provided data doesn't include specific Fed meeting minutes or rate hike probabilities, the general market sentiment towards interest rates is a constant driver.
Equity markets, represented by the S&P 500 (currently at 6625.15) and Nasdaq 100 (at 24300.39), are showing bullish signs on the shorter timeframes, but the daily charts suggest underlying weakness. A sustained downturn in equities typically increases demand for safe-haven assets like gold and, to some extent, silver. However, silver's industrial demand component means it can also be sensitive to economic growth expectations. The divergence between shorter-term bullish equity signals and longer-term bearish daily charts adds another layer of complexity. If risk appetite wanes significantly, it could trigger a flight to safety, potentially benefiting silver despite a strong dollar.
Oil prices, specifically Brent Crude at $97.97, have seen a recent pullback, declining by 1.5%. Lower oil prices can sometimes be interpreted as a sign of slowing global demand, which could negatively impact silver's industrial component. Conversely, sustained high oil prices can fuel inflation expectations, which historically benefits precious metals as an inflation hedge. The current downward move in oil might be a temporary correction, but its persistence could influence the inflation narrative and, consequently, the demand for silver. Recent news also indicated WTI Crude Oil defending the $85 support level, suggesting a floor might be in place, which could stabilize energy markets and indirectly affect commodity sentiment.
Looking Ahead: The Path Forward for XAGUSD
The immediate future for XAGUSD appears to hinge heavily on the forthcoming PMI data. A strong set of US PMIs would likely reinforce the dollar's strength, potentially capping silver's upside and even triggering a move lower towards the $72.55 support level. Conversely, weaker-than-expected US data, coupled with positive readings from Europe or the UK, could weaken the dollar and provide a much-needed boost to silver, potentially pushing it towards the $73.48 and $73.88 resistance levels. The market is in a delicate balance, and these economic indicators will act as the primary catalyst.
From a longer-term perspective, the daily chart's bearish lean cannot be ignored. While shorter-term technicals and potential safe-haven flows could offer temporary support, the underlying trend on the daily timeframe suggests that significant upside may be limited without a fundamental shift in global economic conditions or central bank policy. The persistent strength in the US Dollar Index and the mixed signals from equity markets add to the uncertainty. As an analyst with over 30 years of experience, I view gold and silver as essential components of a diversified portfolio, acting as a store of value and a hedge against inflation and systemic risk. However, even the best hedges can experience periods of consolidation or correction.
Scenario Analysis: Mapping Potential Moves
Bearish Scenario: Resistance Holds Firm
65% ProbabilityBullish Scenario: Data Fuels a Breakout
25% ProbabilityConsolidation Scenario: Waiting for Clarity
10% ProbabilityFrequently Asked Questions: XAGUSD Analysis
What happens if XAGUSD breaks above the $73.88 resistance level?
A decisive break above $73.88, particularly on strong economic data and a weakening dollar, could open the door for further upside towards $74.74 on the 4-hour chart. Confirmation would be needed with sustained volume and positive momentum indicators.
Is the current RSI reading of 63.68 a buy signal for XAGUSD at $73.23?
The RSI at 63.68 on the 1-hour chart indicates bullish momentum but is not yet in overbought territory. It suggests that while the trend is upwards, it's not an immediate buy signal on its own and requires confirmation from other indicators and price action, especially given the proximity to resistance.
How will the upcoming PMI data releases affect XAGUSD this week?
Strong US PMI data could boost the dollar and pressure silver towards $72.55. Conversely, weaker US data or strong Eurozone/UK PMIs could weaken the dollar, potentially pushing XAGUSD towards $73.48. The exact impact depends on the magnitude of the data surprises.
Should traders consider buying XAGUSD at current levels near $73.23 given the mixed daily signals?
Buying at current levels near $73.23 carries risk due to the daily chart's bearish lean and proximity to resistance. A more prudent approach might be to wait for a confirmed breakout above $73.88 or a pullback to a stronger support level like $72.55, depending on your risk tolerance and trading strategy.
The Long-Term View: Silver's Enduring Role
While the short-term price action is dictated by immediate data and technical levels, silver's long-term value proposition remains compelling. As a precious metal, it serves as a hedge against inflation and currency debasement, a role that becomes increasingly important in an environment of persistent inflation concerns and evolving central bank policies. Central banks have been significant buyers of gold, and while silver's role is more nuanced, its appeal as a store of value, particularly during times of geopolitical uncertainty, is undeniable. The current market volatility, underscored by the geopolitical tensions and the ongoing shifts in monetary policy across major economies, reinforces the need for diversification.
Furthermore, silver's dual nature as both a monetary asset and an industrial commodity provides a unique demand dynamic. As the world transitions towards greener technologies, silver's use in solar panels, electric vehicles, and other industrial applications is expected to grow. This underlying fundamental demand, coupled with its traditional role as a precious metal, creates a robust long-term outlook. While short-term price fluctuations are inevitable, the structural demand drivers suggest that silver is well-positioned to maintain its value and potentially appreciate over the longer term. Patience and a disciplined approach, focusing on risk management and strategic entry points, will be key for investors looking to benefit from silver's enduring appeal.
Track markets in real-time
AI-powered analysis, technical indicators and real-time price data.
Join Our Telegram Channel
Breaking market news, AI analysis and trading signals instantly.
Join Channel