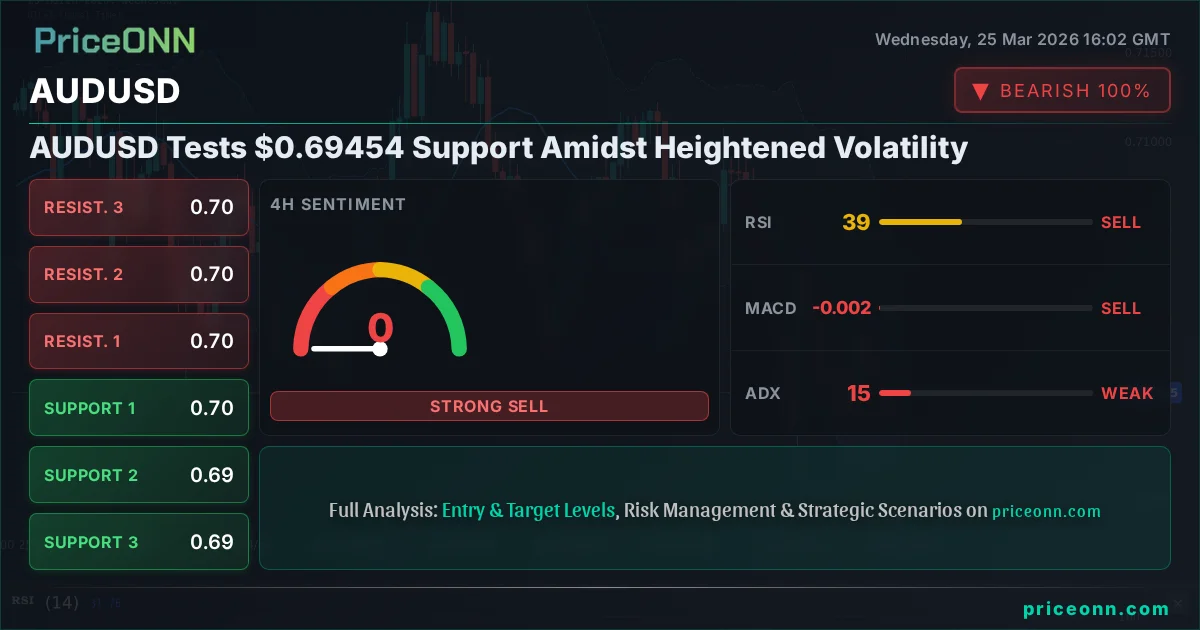
AUDUSD Tests $0.69454 Support Amidst Heightened Volatility
AUDUSD probes critical support near $0.69454, grappling with mixed signals as DXY strengthens and oil prices surge. What's next for the Aussie?
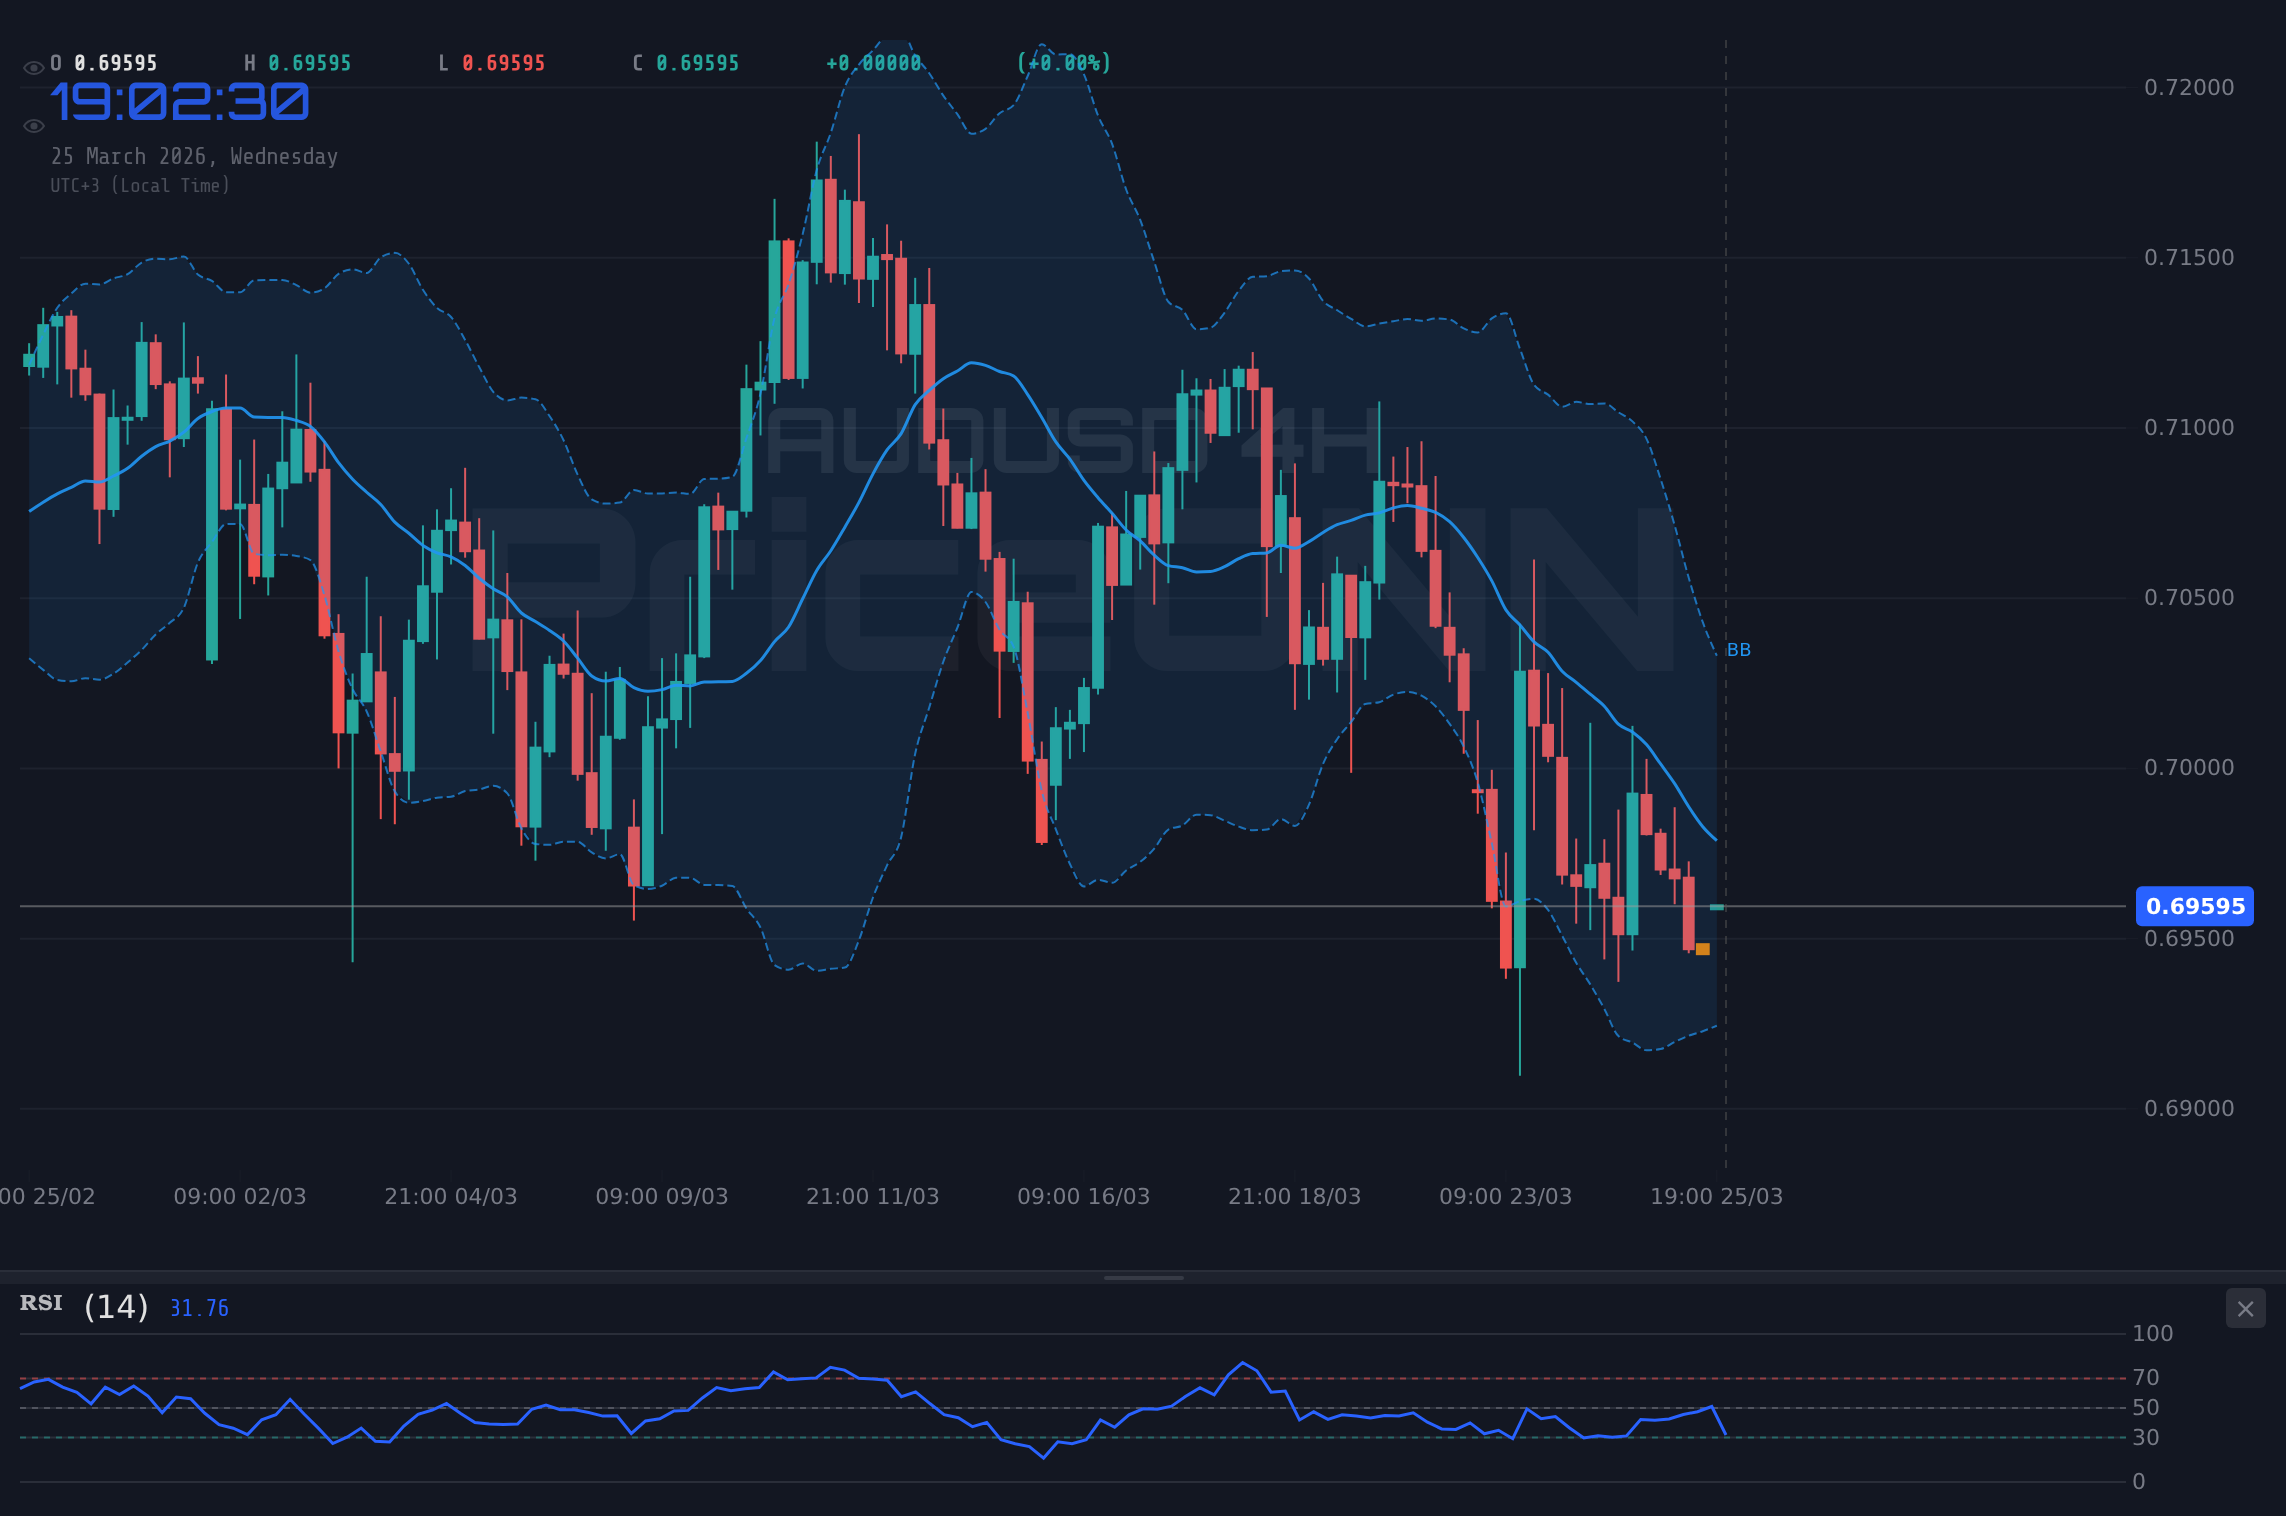
The Australian Dollar (AUDUSD) is currently navigating a turbulent market landscape, finding itself probing critical support levels near the $0.69454 mark. This price action unfolds against a backdrop of significant volatility across global markets, with a strengthening US Dollar Index (DXY) and surging oil prices creating a complex web of competing forces. The AUDUSD pair, currently trading at precisely $0.69614, is caught between the downward pressure exerted by a resurgent dollar and potential inflationary tailwinds from commodity markets, making its next move a focal point for traders and analysts alike. Understanding the interplay of these fundamental drivers and the technical signals is crucial for deciphering the Australian Dollar's immediate future.
- RSI at 44.69 on the 1H chart signals bearish pressure, indicating potential for further downside.
- Critical support sits at $0.69454, a level that has been tested and could define the short-term trend.
- MACD histogram shows negative momentum on the 1H chart, suggesting bearish sentiment is building.
- The correlation with DXY, currently at 99.32, remains a key factor, with dollar strength typically weighing on AUDUSD.
The Tug-of-War: Bulls vs. Bears at the $0.69454 Line
Why Bears Are Pressing the Advantage
The bearish case for AUDUSD is currently being bolstered by a confluence of technical and fundamental factors. On the technical front, the 1-hour chart paints a cautionary picture. The Relative Strength Index (RSI) hovers at 44.69, firmly in neutral territory but displaying a downward trend, suggesting that momentum is leaning towards sellers. The Moving Average Convergence Divergence (MACD) histogram is also negative on this shorter timeframe, indicating that bearish momentum is present, even if not yet overwhelming. The ADX reading of 9.44 on the 1H chart, while indicating a weak trend, doesn't negate the immediate downward pressure. More critically, the 4-hour and daily timeframes also show significant bearish signals. The 4H RSI is at 38.72, and the daily RSI is 43.51, both pointing towards further potential downside. The daily ADX at 22.21 signals a moderately strong downtrend is in play. The fact that AUDUSD is trading below the middle Bollinger Band on the 4H and 1D charts further reinforces the bearish sentiment. This technical picture suggests that bears are attempting to solidify their control below key intraday resistance levels, aiming to push the price towards the $0.69454 support. The overall signal across multiple timeframes leans heavily towards selling, with a 7-day outlook showing 7 'Sell' signals on the daily chart versus only 1 'Buy'. This technical setup is a clear indication that the path of least resistance, at least in the short to medium term, appears to be downwards. Fundamental headwinds are also contributing to the bearish outlook. The US Dollar Index (DXY) is showing renewed strength, currently trading at 99.32 and showing a strong upward trend on the daily timeframe. Historically, a stronger dollar tends to put pressure on riskier currencies like the Australian Dollar, as it increases the cost of dollar-denominated assets and makes the greenback a more attractive safe-haven. This inverse correlation is a well-established market dynamic that cannot be ignored. Furthermore, recent economic data releases, such as the US ISM Manufacturing PMI coming in at 51.1 (above forecast of 52, but still indicating expansion) and the ISM Services PMI at 52.4 (above forecast of 51.5), suggest a degree of resilience in the US economy, which could embolden the Federal Reserve to maintain a hawkish stance or delay rate cuts. While the market is pricing in various scenarios for interest rate differentials, any hawkish undertones from the Fed would likely further support the dollar and weigh on AUDUSD. The recent build in US crude oil inventories, despite a surge in WTI prices, adds another layer of complexity, but the immediate focus remains on the dollar's strength.The Bullish Counter-Argument: What Could Spark a Rebound?
Despite the prevailing bearish technical signals and dollar strength, there are compelling reasons to consider a potential bullish scenario for AUDUSD. The current price of $0.69614 sits precariously close to the first support level at $0.69454. A failure by bears to decisively break and hold below this level could trigger a significant short-covering rally. Historically, AUDUSD has shown resilience around these price points, and a bounce from this support could re-energize bullish sentiment. The daily Stochastic indicator, for instance, shows a %K line at 30.11 and a %D line at 38.18, indicating a potential bullish crossover and a move out of oversold territory, despite the overall bearish trend signals from ADX and RSI. This divergence in signals, particularly on longer timeframes, suggests that the current bearish momentum might be overextended and ripe for a correction. The 1D MACD, while showing negative momentum, is approaching its signal line, hinting at a potential shift. Furthermore, the Stochastic on the 4H chart shows a strong bullish signal with %K at 28.07 and %D at 36.28, suggesting a potential reversal might be brewing on this intermediate timeframe. The overall 'Al' (Buy) signals on the 4H timeframe (5 Buy, 3 Sell) also lend some credence to the bullish argument, at least on this timeframe. From a fundamental perspective, the bullish case hinges on several factors. Firstly, the Reserve Bank of Australia (RBA) has maintained a relatively hawkish stance compared to some other developed economies, and any indication of continued vigilance against inflation or a slower pace of rate cuts than anticipated by the market could provide support for the Aussie. While no specific RBA commentary is available in the provided data, the general global economic outlook and the RBA's historical policy leanings suggest that a dovish pivot is not imminent. Secondly, the surge in oil prices, currently at $101.16 for Brent, could indirectly benefit the Australian economy, which is a significant exporter of commodities. While AUDUSD's correlation with oil prices isn't always direct, a sustained rise in energy costs can signal robust global demand or geopolitical supply disruptions, both of which can sometimes translate into increased demand for commodity-linked currencies like the AUD. The WTI crude price is also showing a strong upward trend. If the market interprets these commodity price increases as a sign of underlying economic strength rather than just inflation risk, it could foster a broader risk-on sentiment that benefits the Aussie. Finally, the sheer proximity to significant support levels might attract bargain hunters, especially if broader market sentiment shifts away from the US dollar. ## Technical Nuances and Conflicting Signals The technical landscape for AUDUSD is far from clear-cut, presenting a classic bull vs. bear debate. On the shorter timeframes (1H), the indicators lean bearish. The RSI at 44.69 suggests room to fall before becoming oversold, and the MACD histogram is negative. The ADX at 9.44 on the 1H suggests a lack of strong trending power, meaning that any move could be choppy. However, the 4H chart offers a more mixed picture. While the RSI is at 38.72 (bearish), the Stochastic is showing a strong bullish signal with %K at 28.07 and %D at 36.28, indicating a potential upward reversal is brewing. The overall signal on the 4H is 5 'Buy' to 3 'Sell'. This conflict between short-term bearishness and intermediate-term potential reversal signals is where much of the current price action is being generated. The daily chart, while showing a bearish ADX of 22.21 and RSI at 43.51, also displays a Stochastic crossover with %K at 30.11 and %D at 38.18, hinting at a potential bottoming process. This divergence across timeframes suggests that a decisive move is likely contingent on a catalyst that breaks the current stalemate. Traders will be closely watching the interplay between these indicators, particularly how the price reacts to the $0.69454 support level. A failure to hold this level would confirm the bearish bias, while a strong bounce could signal the start of a short-term bullish correction. The correlation with the US Dollar Index (DXY) is a critical factor to monitor. With the DXY currently at 99.32 and showing a strong upward trend on the daily chart (ADX 31.93), the pressure on AUDUSD is palpable. A rising DXY typically leads to falling AUDUSD. However, the strength of this correlation can vary. If global risk appetite were to significantly improve, AUDUSD might decouple from the dollar's strength, especially if commodity prices continue to rise. For instance, the surge in Brent crude to $101.16 and WTI to $90.81 suggests either strong demand or supply-side risks, which could indirectly support commodity-linked currencies. Yet, the current data shows the DXY's upward momentum is dominant, making it difficult for AUDUSD to mount a sustained rally without a significant shift in the dollar's trajectory or a major positive catalyst for the Australian economy. The fact that SP500 is showing mixed signals (1H bearish, 4H bullish, 1D bearish) indicates that risk sentiment is also divided, further complicating the outlook for AUDUSD. ## Navigating the Uncertainty: What to Watch Next Looking ahead, several key factors will dictate the direction of AUDUSD. The immediate focus will be on the $0.69454 support level. A decisive break below this could open the door for further declines towards the next support at $0.69318 and potentially $0.69219. Conversely, a strong hold and subsequent bounce from $0.69454 could see the pair retest the intraday resistance levels, starting with $0.69753 and then $0.69852. Confirmation of a bullish reversal would likely require a break above $0.7002, a psychologically significant level. The upcoming economic calendar, though not detailed with specific dates for the next 7 days for AUD, will be crucial. Any significant economic data surprises from Australia or the US could act as catalysts. For instance, a weaker-than-expected US employment report or a surprisingly strong Australian inflation print could dramatically alter the current balance of power. The current 'Sell' signals on the daily chart (6 Sell, 1 Buy) suggest caution for bulls, but the Stochastic crossover on the daily timeframe warrants attention for potential short-term reversals. Traders should pay close attention to the DXY's trajectory. If it continues to push higher towards the 99.81 resistance, AUDUSD is likely to remain under pressure. However, if the DXY falters at its resistance, it could provide AUDUSD with the necessary breathing room for a corrective rally. The performance of major stock indices like the SP500 and Nasdaq also provides clues about global risk appetite. A sustained sell-off in equities would generally favor the US dollar and weigh on AUDUSD, while a rebound in stocks could coincide with a recovery in the Aussie. The conflicting signals across different timeframes mean that short-term traders might find opportunities in intraday swings, but longer-term investors should await clearer directional confirmation. The prevailing sentiment among technical indicators on the daily timeframe leans bearish, but the potential for a Stochastic reversal on the daily and the mixed signals on the 4H chart suggest that the market is at a critical juncture. Patience and careful observation of price action around the key support and resistance levels will be paramount in the coming sessions. ### The Verdict: A Precarious Balance At present, AUDUSD is locked in a fierce battle between bearish technicals and potential fundamental support. The bears have the edge on the daily chart, with a strong ADX and bearish RSI readings, supported by a strengthening dollar. However, the daily Stochastic's potential bullish crossover and the crucial support at $0.69454 present a clear line in the sand. A break below this level would confirm the bearish thesis and likely trigger further downside. On the other hand, a sustained hold and bounce could signal a short-term bullish correction, particularly if global risk sentiment improves or the dollar's ascent stalls. The conflicting signals across timeframes highlight the current market indecision. While the daily trend indicators lean bearish, the 4-hour signals are mixed, and the daily Stochastic offers a glimmer of hope for bulls. The interplay of DXY strength, commodity prices, and upcoming economic data will be the key determinants. For now, the market appears to be in a state of cautious consolidation, awaiting a clearer directional cue. Given the current data, the most probable scenario involves continued choppiness, with AUDUSD likely to oscillate around the $0.69454 support. Bears will aim to break it, while bulls will defend it fiercely. The strength of the dollar at 99.32 is a significant headwind for the Aussie. However, the commodity surge could provide a floor. The technical picture is not a clear-cut 'sell' despite the daily signals, due to the conflicting indicators on shorter timeframes and the potential for a Stochastic reversal. Therefore, extreme caution is advised. The market is at a crossroads, and the next few trading sessions will be critical in determining whether AUDUSD succumbs to dollar strength or finds a footing to rebound.Bearish Scenario: Dollar Dominance
65% ProbabilityBullish Scenario: Support Holds Strong
25% ProbabilityNeutral Scenario: Range-Bound Consolidation
10% ProbabilityFrequently Asked Questions: AUDUSD Analysis
What happens if AUDUSD breaks below the $0.69454 support level?
A sustained break below $0.69454 would likely confirm the bearish outlook, potentially triggering further declines towards $0.69318 and $0.69219. This would be validated by continued dollar strength and bearish technical signals across multiple timeframes.
Should I consider buying AUDUSD at current levels of $0.69614 given the daily Stochastic crossover?
Buying at current levels carries significant risk due to the prevailing bearish daily trend and dollar strength. While the daily Stochastic shows a potential bullish signal, confirmation is needed. A more prudent approach would be to wait for a confirmed bounce from $0.69454 or a break above intraday resistance near $0.69753.
Is the RSI at 44.69 on the 1H chart a sell signal for AUDUSD right now?
An RSI of 44.69 on the 1H chart indicates bearish momentum is present but not yet in oversold territory. Combined with negative MACD momentum, it supports the bearish case for intraday trading. However, it's not an immediate, standalone sell signal without further confirmation like a break of support.
How will the upcoming US economic data affect AUDUSD this week, given the current DXY strength?
Stronger-than-expected US economic data would likely bolster the DXY further, increasing pressure on AUDUSD and potentially reinforcing the bearish trend. Conversely, weaker data could stall the dollar's ascent, offering AUDUSD a reprieve and potentially a chance to test higher resistance levels.
Technical Outlook Summary
| Indicator | Value | Signal | Interpretation |
|---|---|---|---|
| RSI (14) | 43.51 | Bearish | Daily RSI below 50 indicates bearish pressure. |
| MACD Histogram | -0.002 | Bearish | Negative histogram suggests bearish momentum. |
| Stochastic | 30.11 / 38.18 | Bullish Crossover | Daily %K > %D signals potential reversal. |
| ADX | 22.21 | Moderate Trend | Indicates a developing trend, currently leaning bearish. |
| Bollinger Bands | Price below Middle Band | Bearish | Suggests downward pressure. |
Key Levels
Support Levels
Resistance Levels
Track markets in real-time
AI-powered analysis, technical indicators and real-time price data.
Join Our Telegram Channel
Breaking market news, AI analysis and trading signals instantly.
Join Channel