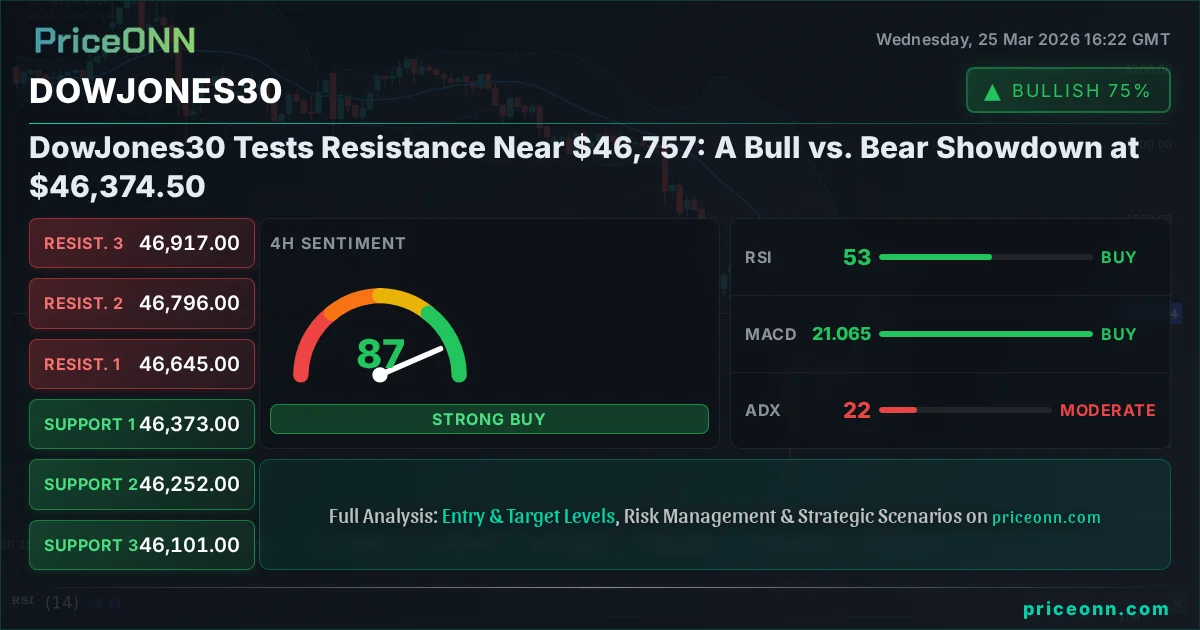
DowJones30 Tests Resistance Near $46,757: A Bull vs. Bear Showdown at $46,374.50
DowJones30 faces a critical juncture at $46,374.50, testing resistance near $46,757. Bulls and bears clash as key indicators present conflicting signals.
The Dow Jones Industrial Average is currently locked in a fierce battleground around the $46,374.50 mark, with its sights set on the significant resistance level near $46,757. This isn't just another trading session; it's a pivotal moment where the bulls and bears are locked in a tug-of-war, and the underlying economic currents are becoming increasingly polarized. As traders and investors alike scrutinize every tick, the question on everyone's mind is whether the index has the fundamental backing to push higher or if the headwinds are set to push it back down. This analysis delves deep into the competing narratives, examining the technical signals, macroeconomic drivers, and geopolitical undercurrents that are shaping this crucial standoff.
- The Dow Jones Industrial Average is currently trading at $46,374.50, facing resistance near $46,757.
- On the 1H chart, RSI at 49.28 suggests bearish momentum is building, while the 4H chart shows a neutral trend with RSI at 52.55.
- The 1D chart presents a strong bearish trend (ADX 41.32), with support at $45,896 and resistance at $46,757.
- Geopolitical tensions and mixed economic data are creating a complex environment, making it difficult for bulls to gain sustained traction.
The current market environment for the Dow Jones Industrial Average is a fascinating study in contrasts. On one hand, the 1-hour chart shows a seemingly bullish trend with a strong ADX reading of 17.82, suggesting some upward momentum. However, this is immediately contradicted by the RSI at 49.28, which indicates a slight bearish lean, and the MACD histogram's negative momentum. This divergence immediately tells us that the short-term picture is far from clear. The Stochastic indicator flashing an oversold signal (K=27.26, D=43.46) on the 1H chart might tempt some to look for a bounce, but the overall trend signals, especially on the daily timeframe, urge caution. This immediate technical conflict sets the stage for a deeper dive into the fundamental forces at play.
The Daily chart paints a more concerning, albeit still nuanced, picture. The Dow Jones Industrial Average is firmly within a strong bearish trend, with an ADX of 41.32. This indicates that the prevailing direction, despite short-term fluctuations, is downwards. The key support level to watch is $45,896, a level that has historically acted as a floor. A decisive break below this could trigger a cascade of selling, potentially pushing the index towards the next support at $45,392. On the resistance side, the $46,757 level is the immediate hurdle. Price action around this area will be critical in determining the next short-term direction. The RSI at 36.03 is deep in the neutral-to-bearish territory, suggesting sellers have the upper hand, while the Stochastic %K crossing above %D from oversold levels offers a glimmer of hope for a potential short-term rebound, but it lacks conviction without further confirmation.
The Bull Case: Navigating Headwinds with Resilience
The bulls, despite the prevailing bearish signals on longer timeframes, are pointing to several factors that could reignite upward momentum. Firstly, the 4-hour chart offers a more optimistic technical outlook. Here, the trend is neutral, but the RSI at 52.55 indicates a slight bullish bias, and the MACD is showing positive momentum with the histogram above the signal line. Furthermore, the Stochastic indicator is in the overbought zone (K=75.41, D=68.68), suggesting strong buying interest. This short-to-medium term technical strength, if sustained, could provide the impetus needed to challenge the daily resistance. The bulls are essentially betting that the daily bearish trend is overextended or that a significant positive catalyst will emerge to shift sentiment.
From a fundamental perspective, the argument for the bulls hinges on the resilience of the US economy and the potential for a 'soft landing'. While inflation remains a concern, the latest US figures for a key economic indicator came in at 52.4, exceeding the forecast of 51.5 and the previous reading of 51.6. This suggests underlying economic activity is stronger than anticipated, potentially giving the Federal Reserve room to maintain a balanced approach rather than aggressively tightening policy. The market has been pricing in the possibility of interest rate cuts later in the year, and any signs that the economy can withstand higher rates without tipping into recession would be a major boost for equities. The bulls are hoping that the Dow Jones's ability to hold above the $46,374.50 level is a sign of underlying strength, a precursor to a move towards the $46,757 resistance and beyond.
Another point in favor of the bulls is the current correlation dynamics. While the Dollar Index (DXY) has seen a recent uptick, its strength hasn't been overwhelming enough to completely crush risk assets. If the DXY's rise is seen as a temporary correction rather than a sustained rally, it could allow indices like the Dow Jones to find their footing. The bulls are also looking at the broader market sentiment, hoping that the recent geopolitical jitters, while present, don't escalate to a point where they trigger a full-blown risk-off event. The recent news about potential Middle East ceasefire hopes, even if fragile, could be interpreted as a positive signal, reducing the safe-haven demand that might otherwise weigh on equities. They believe that the market is resilient enough to look past short-term geopolitical noise if the domestic economic outlook remains relatively stable.
The Bear Case: Economic Slack and Geopolitical Storms
Conversely, the bears are pointing to a confluence of factors that suggest the current price action is a temporary reprieve before a more significant downturn. The dominant bearish trend on the daily chart, supported by an ADX of 41.32, is their primary argument. This strong trend indicates that downward momentum is well-established. The RSI at 36.03 reinforces this, signaling a lack of buying conviction and potential for further downside. The fact that the Stochastic indicator is showing a crossover from oversold levels, while historically a bullish signal, lacks immediate power in the face of such a strong downtrend. Bears argue that this is merely a 'dead cat bounce' – a temporary rally within a larger downtrend, which is a common characteristic of strong bearish markets.
Fundamentally, the bears are deeply concerned about the mixed economic signals and the potential for a recession. While one economic indicator surpassed expectations, others are painting a less rosy picture. The previous reading for another key US data point was 51.7, and the forecast was 52, but the actual came in lower at 51.1. This suggests a potential slowdown in underlying economic momentum. Furthermore, the US saw a significant increase in crude oil inventories, with a build of 2.3 million barrels, while simultaneously India is securing millions of barrels of Russian oil. This signals a complex global energy market, potentially pointing to weakening demand or oversupply concerns that could impact inflation and economic growth. The bears are watching these indicators closely, believing they point towards an economic slowdown that will inevitably drag down corporate earnings and, consequently, stock prices.
Geopolitical risks are also a major weapon in the bears' arsenal. Escalating Middle East tensions, as highlighted by news of a naphtha shortage threatening Japanese petrochemical output, create ripples across global markets. While ceasefire hopes might emerge, the underlying instability remains a significant overhang. This uncertainty fuels demand for safe-haven assets, which often comes at the expense of riskier assets like equities. The bears argue that the market is underestimating these risks, and any escalation or prolonged conflict could trigger a significant 'risk-off' sentiment, leading to sharp sell-offs in indices like the Dow Jones. They believe that the current price around $46,374.50 is not a sign of strength, but rather a precarious position before a potential decline towards the $45,896 support level.
Technical Crossfire: Indicators in Conflict
The technical indicators themselves are offering a confusing array of signals, reflecting the broader market tension. On the 1-hour chart, the Stochastic oscillator is showing an oversold condition (K=27.26, D=43.46), suggesting a potential short-term bounce. However, this is immediately countered by the RSI at 49.28, which is leaning bearish, and the MACD's negative momentum. This suggests any bounce might be short-lived. The ADX at 17.82 on this timeframe indicates a weak trend, meaning price action could be choppy and lack direction, making it difficult to establish a clear short-term bias. This ambiguity on the shortest timeframe is a key reason why the bears are confident that the longer-term downtrend will prevail.
Moving to the 4-hour chart, the picture becomes slightly more constructive for the bulls, but still lacks a decisive confirmation. The RSI at 52.55 is neutral-to-bullish, and the MACD is showing positive momentum. The Stochastic is bullishly positioned in the overbought territory (K=75.41, D=68.68). This timeframe suggests that there is some underlying buying pressure that could support a move higher. However, the ADX at 19.73 still indicates a weak trend, meaning this bullish momentum may not have the legs to sustain a significant breakout. The bulls would need to see these 4-hour signals translate into a clear bullish trend on the daily chart, which is currently absent. The conflict between the short-term bullish signals and the long-term bearish trend is the core of the current market indecision.
The daily chart, as previously discussed, is the most bearish of the lot. The ADX at 41.32 signals a strong downtrend. The RSI at 36.03 is trending lower, and the MACD is firmly in negative territory. While the Stochastic shows a potential bullish crossover from oversold, it's occurring within a strong bearish trend, which historically makes such signals less reliable. Bears are looking at this daily picture as the dominant force, believing that any rallies are opportunities to sell into strength, aiming for the $45,896 support. The bulls, on the other hand, are hoping that the confluence of neutral-to-bullish signals on the 1-hour and 4-hour charts, combined with a potential shift in macroeconomic sentiment, can override the daily bearish trend and initiate a reversal, targeting the $46,757 resistance. The conflict in signals across timeframes is precisely what creates volatility and uncertainty.
The Verdict: A Precarious Balance Favors Caution
Weighing the bull and bear arguments, the evidence leans towards a cautious approach, with the bears holding a slight edge due to the dominant daily downtrend. While the short-term charts offer flickers of hope for a bounce, they lack the conviction and confirmation needed to signal a sustained reversal. The strong ADX reading on the daily chart (41.32) is a significant indicator that the prevailing trend is downward, and any rallies are likely to be met with selling pressure, especially as the index approaches the $46,757 resistance. The mixed economic data, coupled with persistent geopolitical risks, provides a fundamental backdrop that supports caution rather than aggressive optimism.
The key takeaway is that while a short-term bounce is possible, especially if the $46,374.50 level holds as immediate support and buyers step in, the larger trend remains a concern. For the bulls to gain the upper hand, they need to convincingly break and hold above the $46,757 resistance. This would require a significant shift in market sentiment, potentially driven by more dovish signals from the Federal Reserve or a de-escalation of geopolitical tensions. Until then, the probability favors a continued struggle, with potential downside risk towards the $45,896 support level. Traders should remain vigilant, manage risk tightly, and wait for clearer signals before committing to a strong directional bias.
The current market sentiment, influenced by mixed economic data and geopolitical uncertainties, suggests that volatility will likely remain elevated. The Dow Jones Industrial Average at $46,374.50 is at a critical juncture, where a breakdown below immediate support could accelerate losses, while a decisive move above $46,757 resistance could signal a trend change. Given the conflicting technical signals across different timeframes and the uncertain fundamental backdrop, a patient, risk-managed approach is paramount. Watching the price action around these key levels, coupled with upcoming economic data releases, will be crucial for navigating this complex market landscape.
Frequently Asked Questions: DowJones30 Analysis
What happens if DowJones30 breaks below the $45,896 support level?
A break below the $45,896 support level, confirmed by strong volume and bearish indicators, could signal a continuation of the daily downtrend. This might lead to further declines towards the $45,392 and $45,035 levels as sellers gain control.
Should I buy DowJones30 at current levels of $46,374.50 given the mixed signals?
Given the conflicting signals across timeframes and the strong daily bearish trend, buying at current levels of $46,374.50 carries significant risk. A more prudent approach would be to wait for a clear break above the $46,757 resistance or a confirmed bounce from a key support level, with a probability favoring caution.
Is the RSI at 36.03 on the daily chart a strong sell signal for DowJones30 right now?
An RSI of 36.03 on the daily chart indicates bearish momentum, suggesting sellers are in control, but it's not an extreme oversold reading that typically triggers immediate buy signals. It reinforces the dominant bearish trend rather than acting as a standalone sell signal.
How will upcoming economic data affect DowJones30 this week?
Upcoming economic data, particularly the US figures that came in at 52.4 (exceeding forecasts), could influence the Federal Reserve's policy stance. If future data continues to show economic resilience, it might support a 'soft landing' narrative, potentially boosting the Dow Jones towards resistance; however, any signs of slowdown could accelerate declines.
Track markets in real-time
AI-powered analysis, technical indicators and real-time price data.
Join Our Telegram Channel
Breaking market news, AI analysis and trading signals instantly.
Join Channel