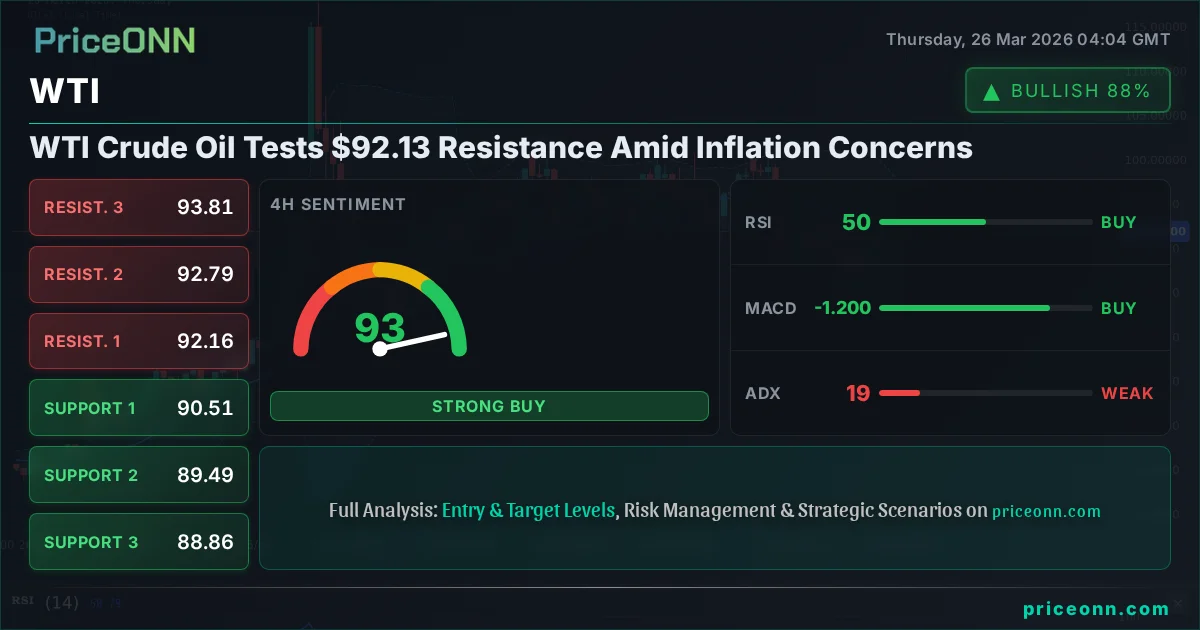
WTI Crude Oil Tests $92.13 Resistance Amid Inflation Concerns
WTI crude oil hovers around $92.13. Key resistance at $92.79, while support holds at $90.51. Geopolitical tensions and economic data are key drivers.
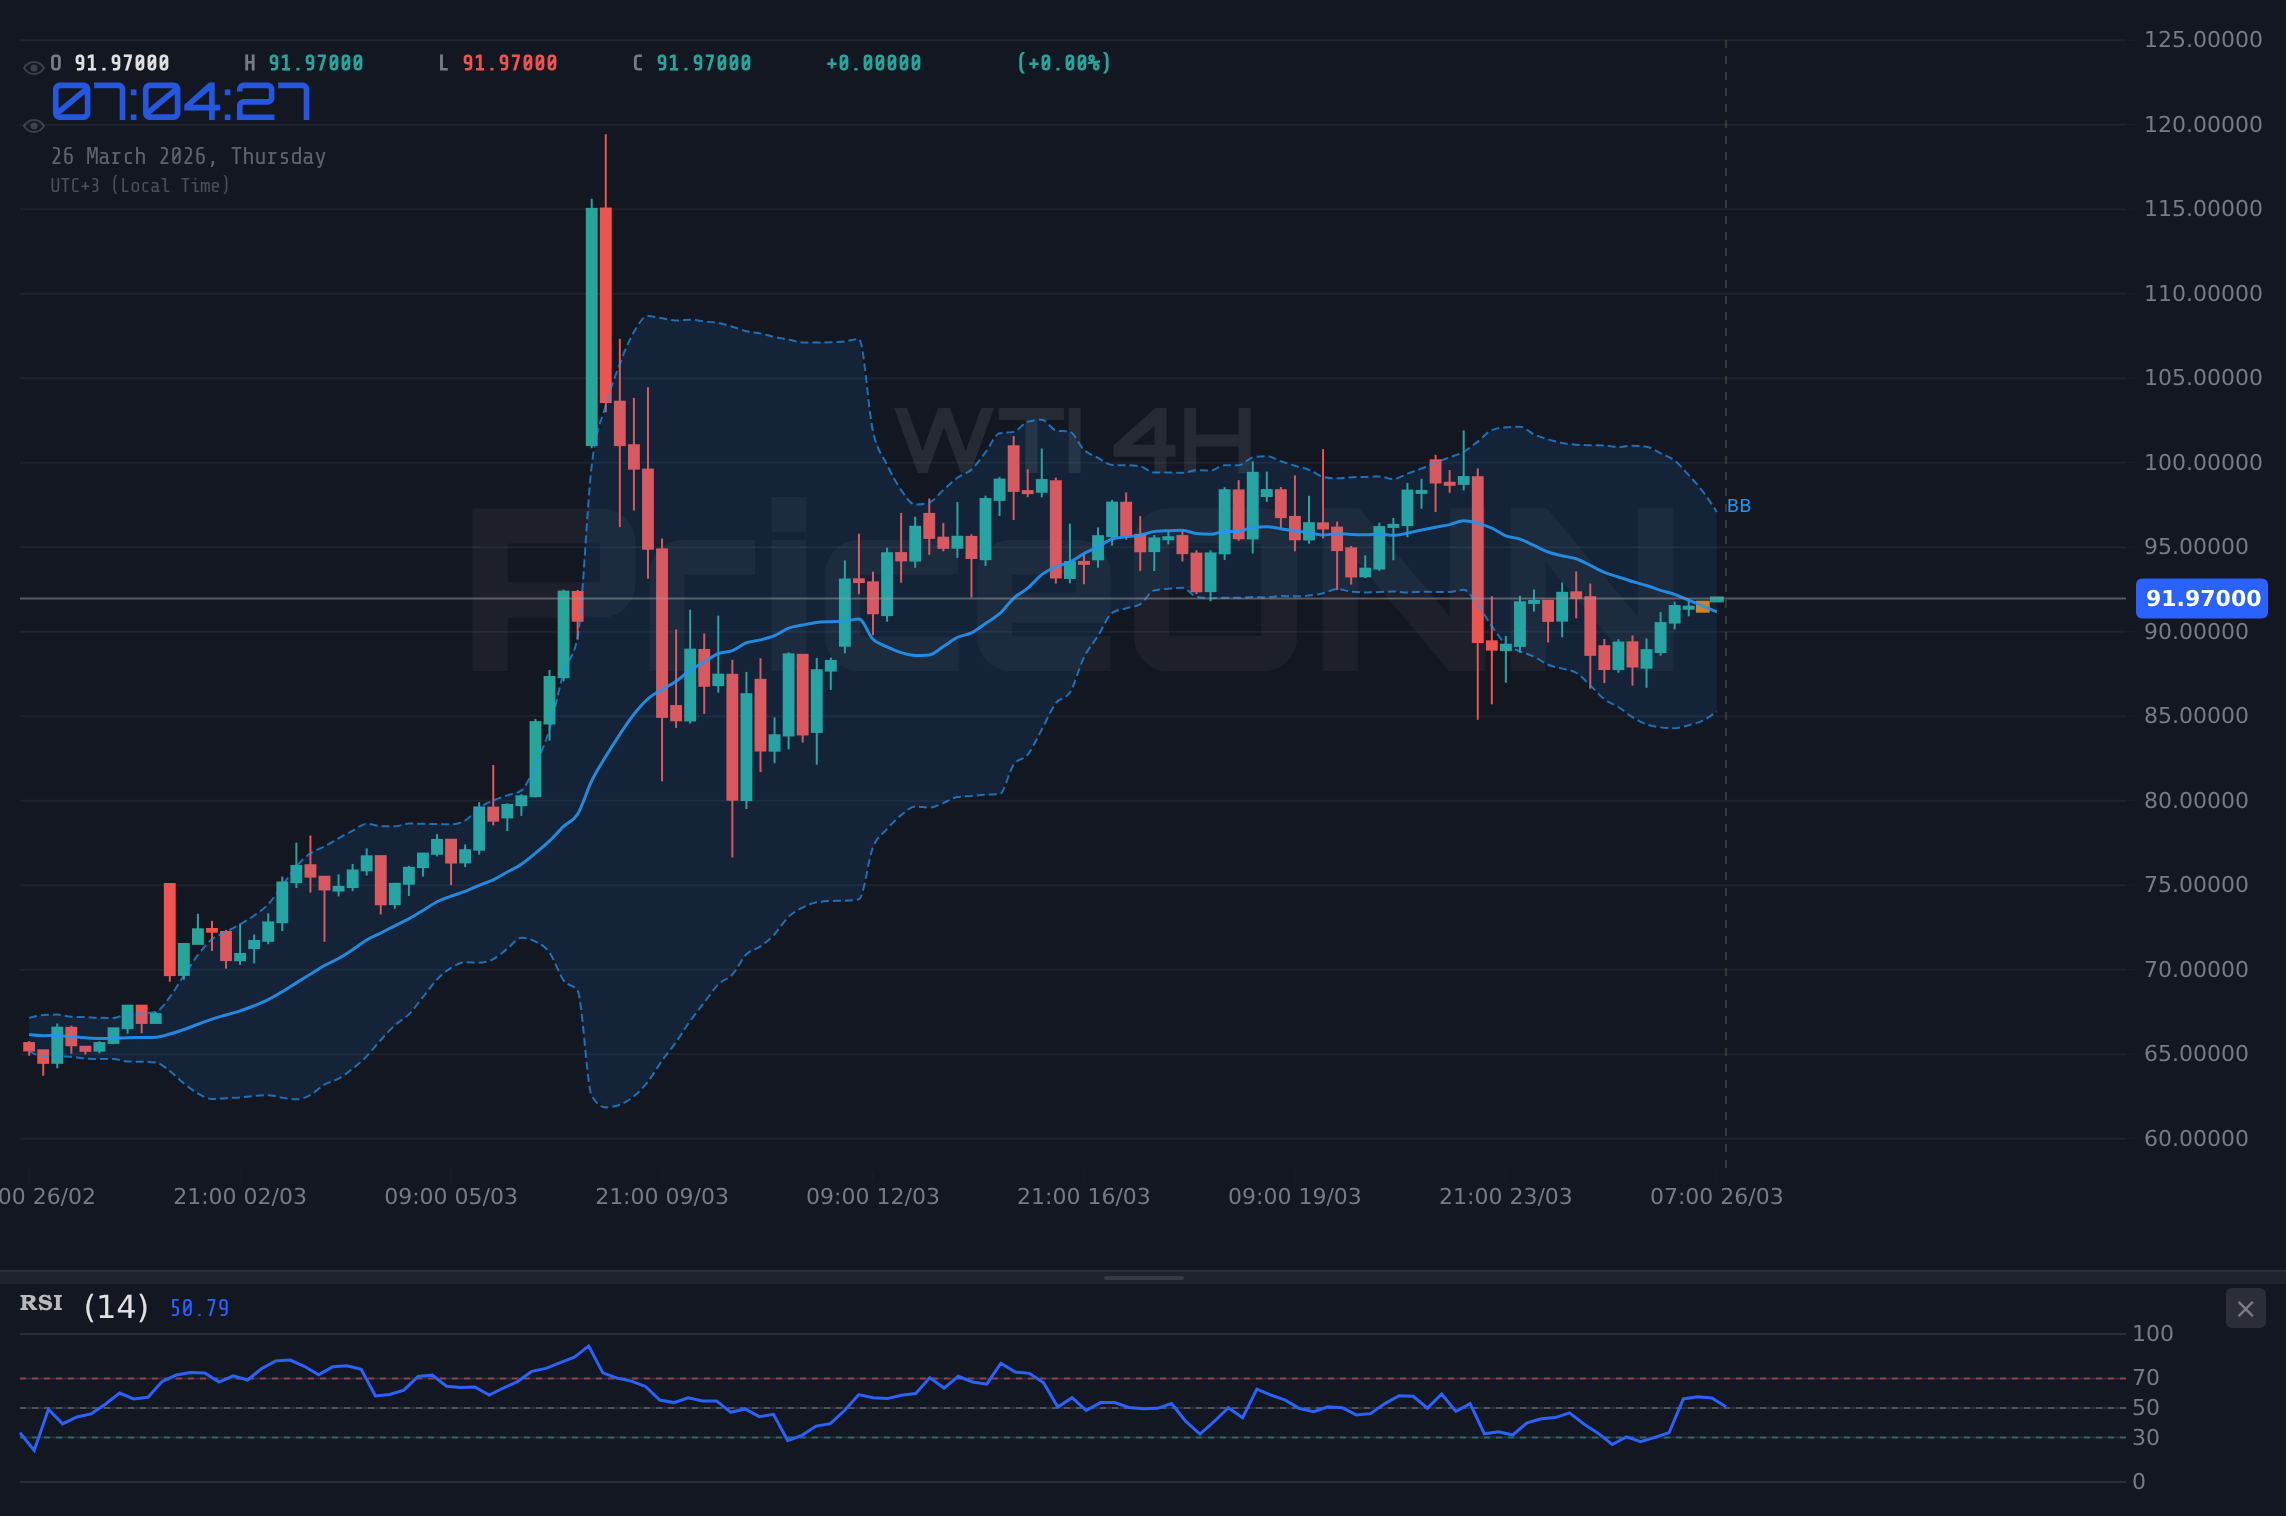
WTI crude oil is currently trading around the $92.13 mark, a critical juncture where upward momentum faces significant headwinds. The price action this week has been defined by a cautious climb, with traders eyeing the $92.79 resistance level. Understanding the interplay between geopolitical events, economic data releases, and the dollar's strength is paramount for navigating this volatile market. This analysis delves into the multi-scenario outlook for WTI, examining the conditions that could propel it higher or send it reeling back. The market is currently poised at a crossroads, and the next few days will likely dictate the short to medium-term trajectory.
- WTI crude oil is testing resistance near $92.13, with a key hurdle at $92.79.
- Critical support for WTI is holding at $90.51, tested multiple times this week.
- The ADX at 18.65 on the 4H chart suggests a weak trend, indicating potential for range-bound trading or a breakout.
- Geopolitical tensions and upcoming economic data releases are expected to be major catalysts for WTI price movements.
The Bull's Roadmap: Breaking $92.79
For WTI bulls to maintain control and push prices higher, a decisive break above the immediate resistance at $92.79 is essential. This level, along with the 4H chart's upper Bollinger Band, represents a significant barrier that has capped recent rallies. A sustained push above $92.79, ideally with increasing volume and a bullish MACD crossover on the 1H chart, would signal a commitment to further upside. The RSI(14) on the 1H chart is currently at 63.44, showing upward momentum but not yet in overbought territory. If this bullish sentiment continues, the next logical target would be the $93.32 resistance. Beyond that, the 1D chart's resistance at $93.81 and $95.09 come into play. Such a move would likely be fueled by escalating geopolitical risks in key oil-producing regions or significantly stronger-than-expected economic data, perhaps from upcoming PMI or inflation reports, which would boost demand expectations and inflation hedges. The ADX on the daily chart at 56.83 indicates a very strong uptrend, which would support a sustained move higher if the immediate resistance is cleared.
A surge in industrial demand, coupled with supply disruptions, could create the perfect storm for a bullish breakout. For instance, if upcoming services PMI data surprises to the upside, it would suggest robust economic activity and, by extension, higher oil consumption. Furthermore, any escalation in Middle Eastern tensions, a region critical for global oil supply, could immediately send WTI prices soaring as traders price in potential supply shocks. The Stochastic indicator on the 1H chart is already in overbought territory (K=91.97, D=88.12), suggesting that if a breakout occurs, it might be sharp and fast, but could also signal an imminent reversal if it fails to hold gains.
The correlation with the DXY is also a factor to watch. While the dollar index is currently showing mixed signals across timeframes, a weakening dollar often correlates with rising commodity prices, including WTI. If the dollar index starts to falter from its current levels, especially if the Fed signals a pause in its tightening cycle sooner than expected, this could provide additional tailwind for WTI. The 1H MACD is currently showing positive momentum, supporting the idea of an upward move, but confirmation would come from the MACD histogram moving further above the signal line and staying positive.
Where Bears Take Control: Testing $90.51 and Below
Conversely, a bearish scenario would unfold if WTI fails to break above the $92.79 resistance and instead retreats. The immediate support level to watch is $91.52 on the 1H chart, followed by the more significant $90.95. A break below $90.95, especially if accompanied by increased selling volume and a bearish MACD crossover on the 4H chart, would signal a shift in sentiment towards the downside. The 4H chart shows ADX at 21.37, indicating a moderate downtrend, which would gain traction on a break of support. The RSI(14) on the 4H chart is currently at 48.13, suggesting room for further downside before hitting oversold conditions.
Should WTI fall below $90.51, the next key support level is $88.86. A sustained move into this territory would likely be triggered by a de-escalation of geopolitical tensions, leading to reduced risk premiums in oil prices, or by surprisingly weak economic data suggesting a global slowdown. For example, if upcoming US Non-Farm Payrolls (NFP) data comes in significantly below expectations, it could signal a weakening labor market and a potential economic downturn, curbing oil demand. Similarly, if China's manufacturing PMI significantly underperforms, it would raise concerns about global growth and oil consumption, putting downward pressure on prices. On the 1D chart, the ADX of 62.51 points to a very strong uptrend, which suggests that a break below support might be met with buying interest, but a decisive close below $88.86 could signal a more significant trend reversal.
The Stochastic indicator on the 4H chart (K=59.56, D=37.9) is showing a potential for a bullish crossover, but this is within the context of a broader bearish move if support levels give way. MACD on the 1D chart is currently negative, with the histogram below the signal line, reinforcing the bearish outlook if key support fails. The failure of WTI to hold above $92.13 and a subsequent fall below $90.51 could also be exacerbated by a strengthening US dollar, as seen in the DXY's potential to move higher from its current range. Traders will be watching for any signs of capitulation or a 'liquidity grab' below key support levels.
The Waiting Game: Sideways Action Around $91.52
There's a distinct possibility that WTI could enter a period of consolidation, trading within a defined range, especially given the conflicting signals across different timeframes and the current geopolitical uncertainty. The 1H chart shows a weak trend (ADX: 20.36), and the 4H chart also indicates a weak trend (ADX: 18.65), suggesting that neither buyers nor sellers have a strong conviction. In this scenario, price action might oscillate between the immediate support around $91.52 and resistance near $92.42. This range-bound environment is often characterized by choppy price action, where technical indicators can give mixed signals.
For example, the RSI readings might hover around the 50 level, indicating a lack of directional bias. The MACD could be oscillating around the zero line, with frequent crossovers that fail to sustain momentum. Stochastic oscillators might frequently move between overbought and oversold conditions without a clear directional trend. This sideways movement could persist until a significant catalyst emerges, such as a major economic data surprise or a clear escalation or de-escalation of geopolitical tensions. During such periods, traders often look for confirmation signals from higher volume spikes or clear breakouts from the established range. The current lack of a strong trend on lower timeframes suggests that this neutral scenario is plausible in the short term, especially if upcoming economic data is mixed or inconclusive.
The interplay between the DXY and WTI could also contribute to range-bound trading. If the dollar strengthens moderately, it might cap upside for WTI, while geopolitical fears could prevent a sharp decline, keeping prices within a tight band. This 'waiting game' can be frustrating for traders seeking clear directional trades, often leading to scalping opportunities within the range or a patient approach, waiting for a decisive breakout. The ADX values across the lower timeframes (1H and 4H) strongly suggest a lack of directional conviction, reinforcing the possibility of consolidation until a significant event shifts the market's focus.
Most Likely Scenario and Key Triggers
Considering the current technical indicators and the prevailing geopolitical landscape, the most likely scenario in the short term appears to be a cautious approach, leaning towards further testing of resistance, but with a high probability of consolidation before any significant directional move. The strong uptrend indicated by the daily ADX (62.51) suggests underlying bullishness, but the immediate resistance levels and the weak trend signals on lower timeframes point to potential choppiness. I assign a 55% probability to a scenario where WTI consolidates between $90.95 and $92.79 this week, with a slight upward bias due to underlying trend strength. A breakout above $92.79 has a 30% probability, driven by escalating geopolitical risks or strong inflation data. A decisive break below $90.51 has a 15% probability, likely requiring a significant de-escalation of tensions or very weak economic figures.
The critical triggers to watch this week will be: 1. **Upcoming US Economic Data:** Specifically, any inflation reports (like CPI or PCE if released soon) or employment figures (like the upcoming NFP data). Stronger-than-expected inflation would likely fuel WTI higher, while weaker employment could signal a slowdown and pressure prices. 2. **Geopolitical Developments:** Any news regarding negotiations or escalations in the Middle East will be a primary driver. A de-escalation could remove the current risk premium, while an escalation would add to it. 3. **DXY Movement:** A sustained move by the Dollar Index above its current resistance levels could put pressure on WTI, while a weakening dollar might provide a tailwind for oil prices. The DXY is currently at 99.4, and a break above 99.56 on the 4H chart would be significant.
The current weak trend signals on the 1H and 4H charts (ADX below 20) suggest that the market is waiting for a clear catalyst. This makes the consolidation scenario the most probable in the immediate term. However, the strong daily trend means that any breakout, if it occurs, could be substantial. Traders should remain vigilant for confirmation signals, such as increased volume accompanying price moves or clear divergences on indicators like RSI and MACD across multiple timeframes. The interplay between these factors will ultimately determine whether WTI continues its ascent, consolidates, or faces a significant pullback.
Bearish Scenario: The Retreat
15% ProbabilityNeutral Scenario: The Waiting Game
55% ProbabilityBullish Scenario: The Ascent
30% ProbabilityFrequently Asked Questions: WTI Analysis
What happens if WTI breaks decisively above $92.79 resistance?
A sustained break above $92.79, especially on the 4H chart with increasing volume, would invalidate the consolidation scenario and likely target $93.32 and potentially $93.81. This would be fueled by escalating geopolitical tensions or stronger inflation data, confirming the bullish outlook.
Should I consider buying WTI at current levels of $92.13 given the weak trend signals?
Buying at $92.13 carries risk due to the immediate resistance at $92.79 and weak trend signals on lower timeframes. A more prudent approach might be to wait for confirmation of a breakout above $92.79 or a test of support around $90.95, where a better risk-reward ratio could emerge.
Is the RSI at 63.44 a buy signal for WTI crude oil right now?
An RSI of 63.44 on the 1H chart indicates upward momentum but is not yet in overbought territory. While it supports a bullish bias, it's not a standalone buy signal. Confirmation from MACD crossovers and price action holding above key intraday support levels would be needed.
How will upcoming US economic data affect WTI this week?
Stronger-than-expected inflation data would likely boost WTI towards $93.32 and beyond, while weaker employment figures could signal an economic slowdown, potentially pushing WTI back towards $90.51. Traders will closely monitor NFP and any available inflation indicators for directional cues.
Track markets in real-time
AI-powered analysis, technical indicators and real-time price data.
Join Our Telegram Channel
Breaking market news, AI analysis and trading signals instantly.
Join Channel