Nasdaq100 Tests $24,158.75 Amid Rising Recession Fears and Oil Shocks
Nasdaq100 hovers around $24,158.75 as economists raise recession odds past 45% on geopolitical risks and surging oil prices.
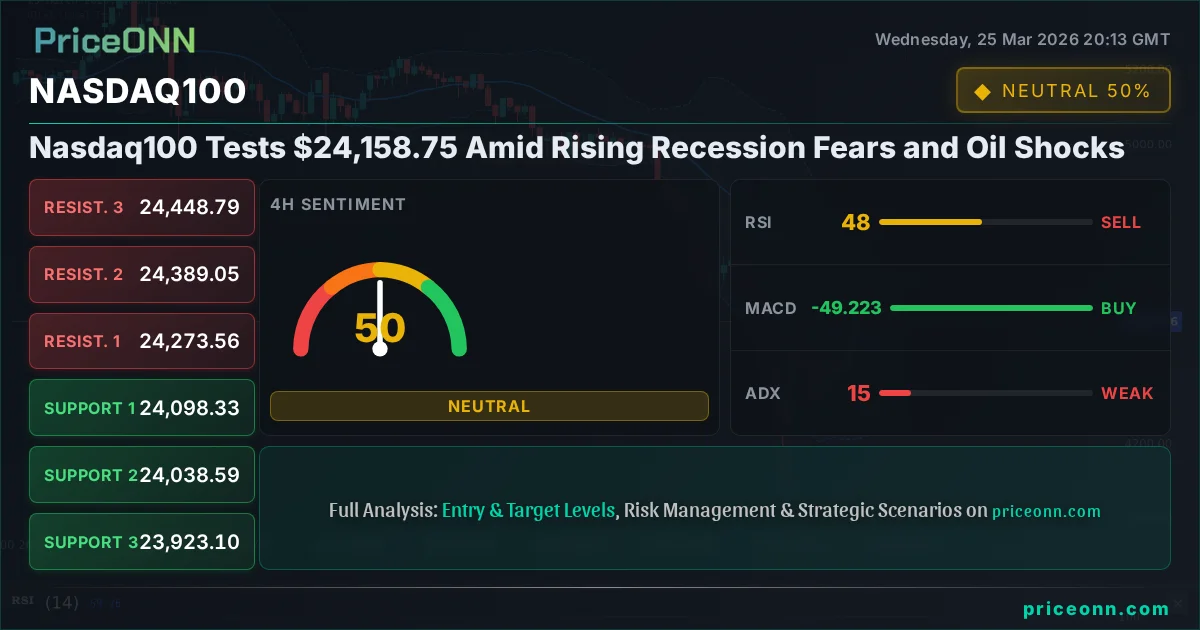
The Nasdaq100 is currently navigating a critical juncture, trading at $24,158.75, as a confluence of escalating geopolitical tensions and persistent inflation fears fuels a significant uptick in recession odds among Wall Street economists. With recession probabilities now surging past 45%, the tech-heavy index faces headwinds that challenge its recent resilience. This analysis delves into the intricate interplay between macroeconomic indicators, technical patterns, and geopolitical events shaping the Nasdaq100's immediate future, exploring whether current levels represent a temporary pause or the precursor to a deeper correction.
- The Nasdaq100 is trading at $24,158.75, with key support at $23,963.42 and resistance at $24,376.04 on the daily chart.
- Recession odds have surpassed 45% according to recent economist assessments, driven by geopolitical risks and oil price shocks.
- The RSI at 40.65 on the daily chart indicates bearish momentum, while the ADX at 40.91 confirms a strong downtrend.
- Correlation analysis shows the DXY at 99.4 strengthening, potentially pressuring risk assets like the Nasdaq100.
The current trading environment for the Nasdaq100 is defined by a palpable sense of unease. As the index hovers precariously around the $24,158.75 mark, market participants are grappling with a narrative increasingly dominated by recessionary concerns. Wall Street economists, a typically cautious bunch, are now placing recession odds above the 45% threshold, a stark increase fueled by a potent cocktail of Middle East tensions and the relentless upward march of oil prices. This heightened sense of risk is palpable across financial markets, creating a challenging backdrop for growth-oriented assets like technology stocks that form the backbone of the Nasdaq100. The interplay between these macro factors and the index's technical posture is complex, demanding a nuanced approach to deciphering the path forward.
Geopolitical instability, particularly the escalating conflict in the Middle East, has become a significant driver of market sentiment. Recent reports highlight how these tensions have triggered a naphtha shortage, threatening petrochemical output and underscoring the fragility of global supply chains. This disruption not only poses direct economic risks but also indirectly fuels inflation by increasing energy and raw material costs. When coupled with the broader inflationary pressures already present, these supply-side shocks create a formidable challenge for central banks attempting to navigate a path towards price stability without tipping economies into recession. The impact on risk appetite is immediate; as uncertainty climbs, investors tend to shy away from growth assets, seeking refuge in perceived safe havens. This dynamic directly affects indices like the Nasdaq100, which are sensitive to shifts in global risk sentiment.
The dollar's performance, as reflected by the DXY (Dollar Index), is another critical piece of the puzzle. Currently standing at 99.4 and showing a clear upward trend on the daily chart, a stronger dollar typically exerts downward pressure on global risk assets, including the Nasdaq100. This inverse correlation stems from several factors: a stronger dollar makes US exports more expensive, potentially hurting corporate revenues, and it can also signal a flight to safety, drawing capital away from riskier markets. While the 1-hour chart for DXY shows a weaker trend, the daily picture is undeniable. Traders are closely monitoring the DXY's trajectory as a barometer for global liquidity and risk appetite. Any sustained move higher in the dollar could exacerbate the headwinds facing the Nasdaq100.
Technically, the Nasdaq100 presents a mixed but largely cautionary picture across different timeframes. On the 1-hour chart, the RSI stands at 48.28, indicating bearish momentum, and the MACD is below its signal line, reinforcing this sentiment. The ADX at 12.08 suggests a weak trend, implying a lack of strong conviction behind any immediate move. However, the 4-hour chart offers a slightly different perspective, with RSI at 48.2 and MACD showing positive momentum, although the ADX remains weak at 15.07. The daily chart, which often carries more weight for longer-term analysis, paints the most bearish picture. Here, the RSI is at 40.65, firmly in bearish territory, and the MACD is below its signal line. Crucially, the ADX is at 40.91, confirming a strong downtrend. This divergence across timeframes suggests a market in flux, with short-term fluctuations potentially masking a more significant bearish undertow.
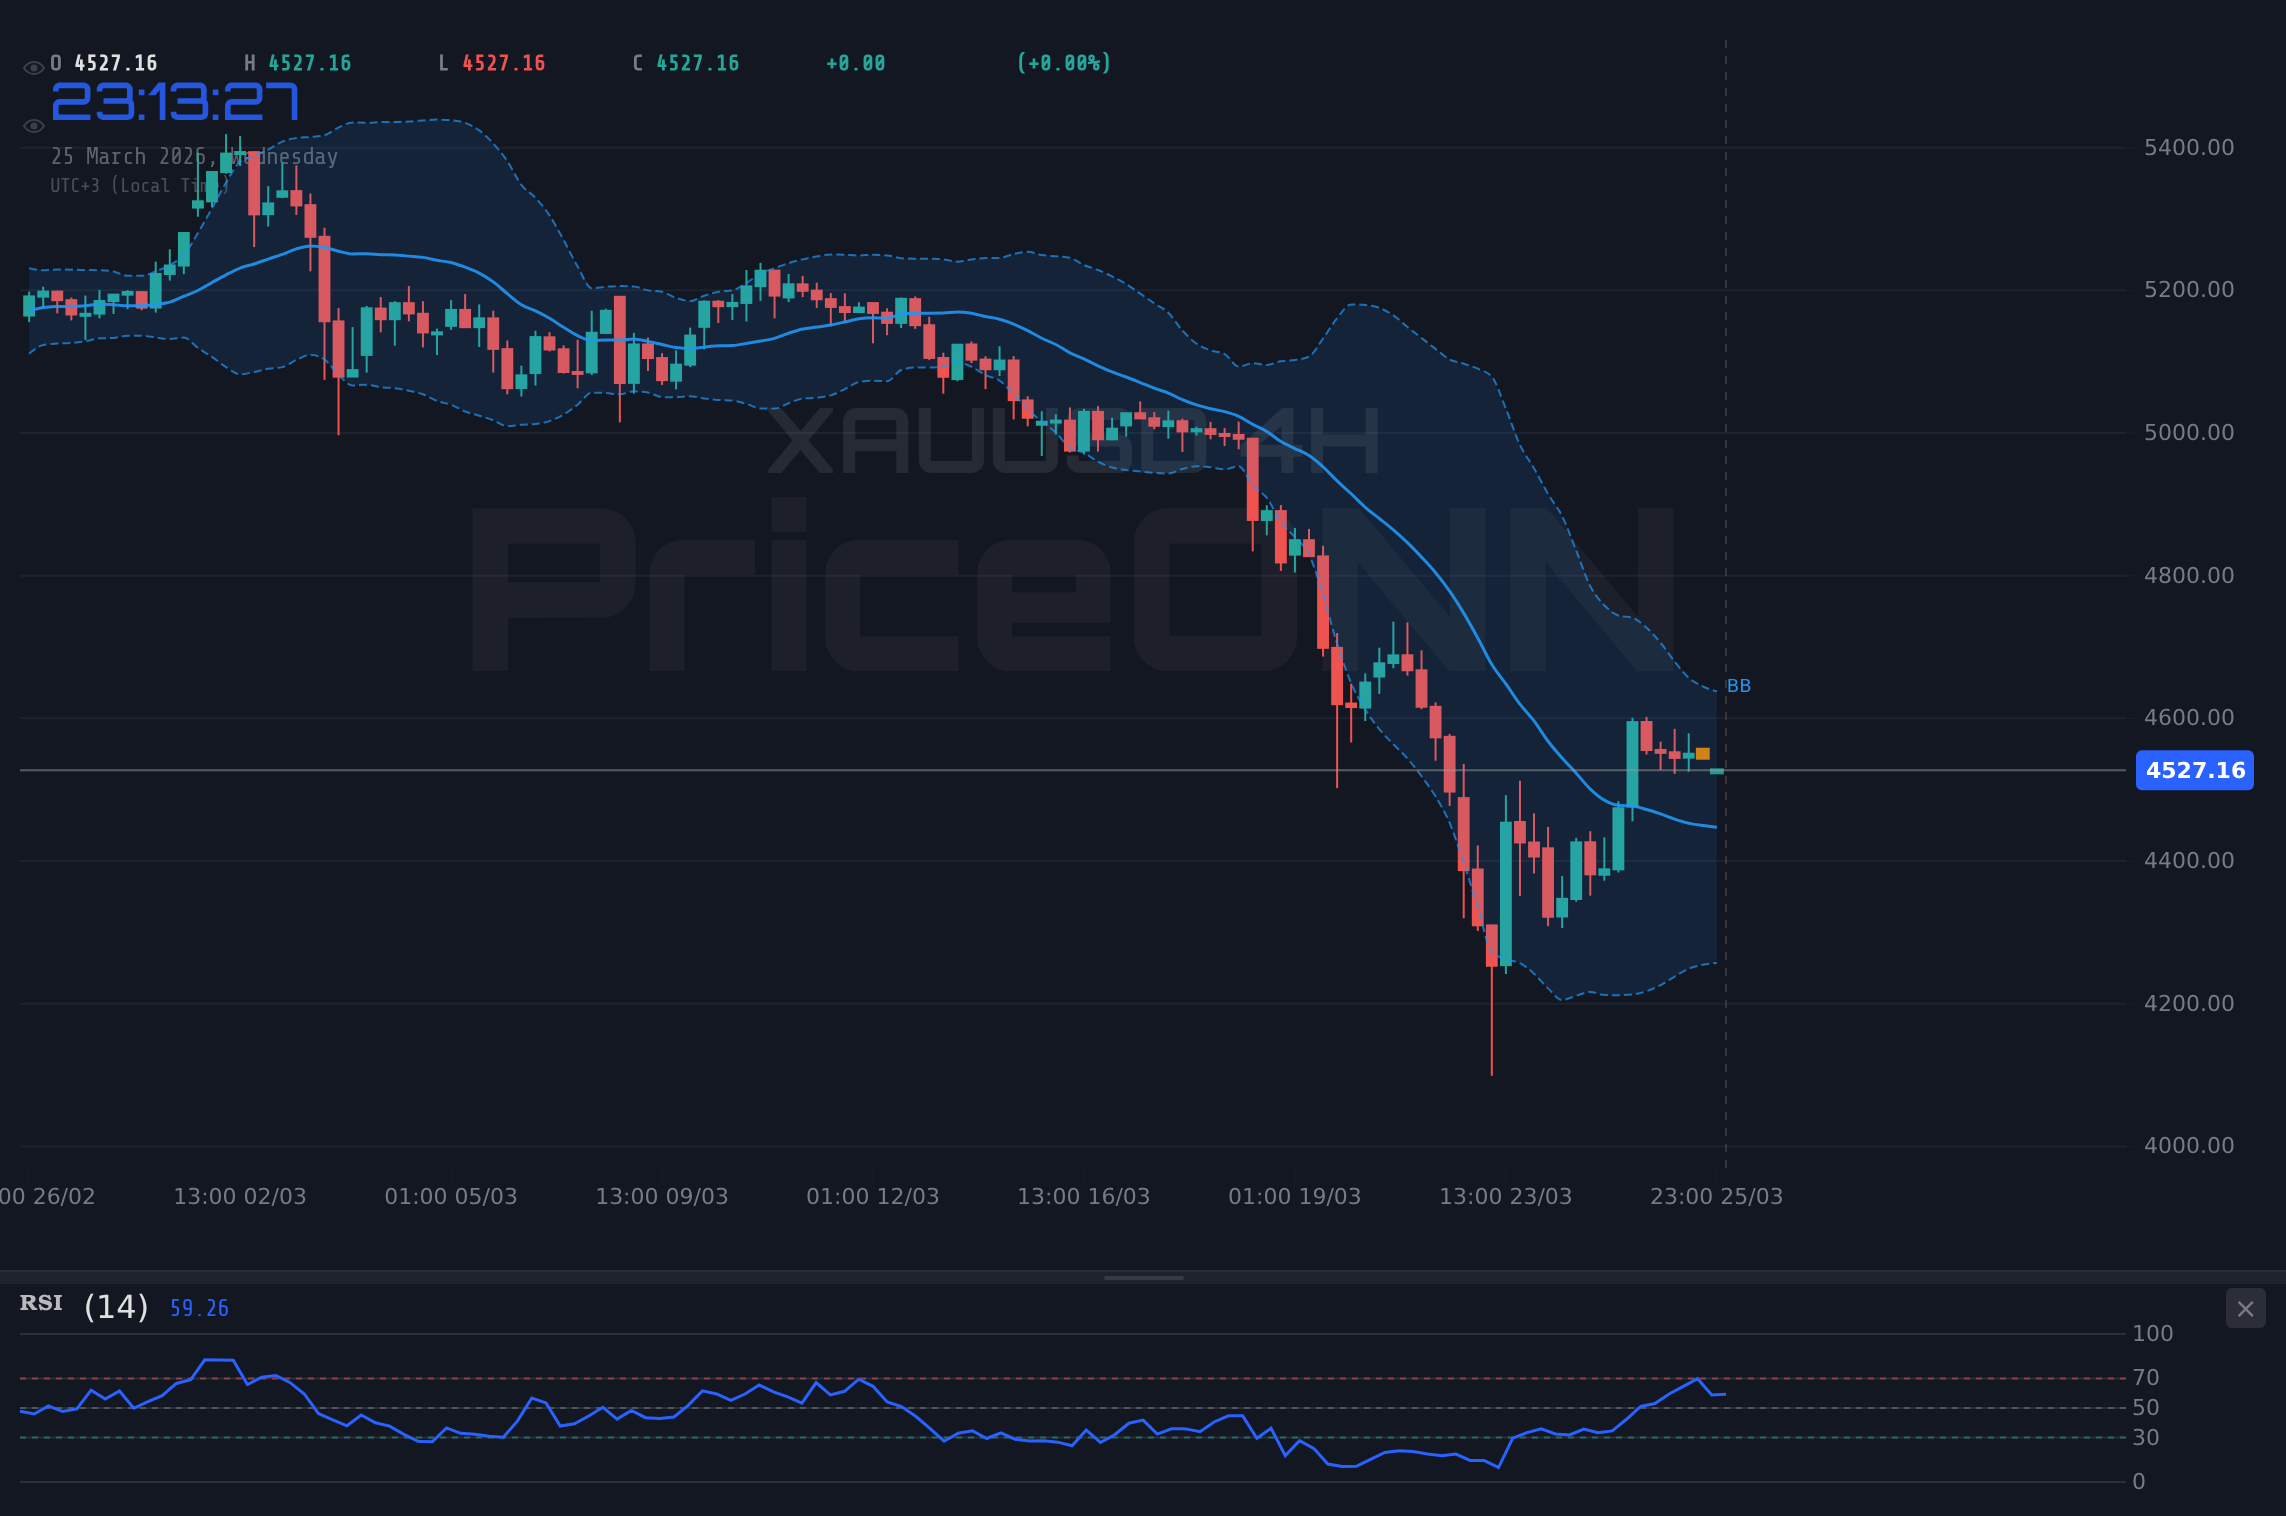
The ADX reading on the daily chart, specifically 40.91, is a significant indicator of trend strength. An ADX value above 25 generally signifies a strong trend, and a reading above 40, as seen here for the Nasdaq100, indicates a very powerful trend. Combined with the daily RSI at 40.65 and the MACD's negative momentum, this points towards considerable selling pressure. The fact that the index is trading below its daily middle Bollinger Band further corroborates the bearish outlook, suggesting that the price action is currently reflecting a downward bias. While short-term charts might show flickers of buying interest, the dominant daily trend strength cannot be ignored. This suggests that any rallies might be met with selling pressure as traders position for further downside.
Examining the key levels provides further clarity on the Nasdaq100's technical landscape. On the daily chart, immediate support is identified at $23,963.42, followed by $23,735.99 and $23,550.8. These levels represent potential floor areas where buying interest could emerge, stemming the tide of selling pressure. Conversely, resistance lies at $24,376.04, $24,561.23, and $24,788.66. A decisive break above the nearest resistance level, $24,376.04, would be necessary to challenge the prevailing bearish sentiment. However, given the strong daily trend indicated by the ADX, the probability of a sustained move higher without significant consolidation or a deeper pullback first appears limited. The market sentiment, as suggested by the rising recession odds and the strengthening dollar, leans towards further downside risk.
The recent news regarding rising recession odds, particularly the mention of Middle East tensions and oil price shocks as key drivers, directly impacts the fundamental outlook for the Nasdaq100. Tech stocks, often considered growth assets, are particularly vulnerable during economic downturns. Higher energy costs can squeeze corporate profit margins, while increased uncertainty can lead to reduced consumer and business spending, impacting demand for technology products and services. The fact that economists are raising their recession forecasts significantly suggests that the market may be repricing risk. This fundamental shift cannot be ignored by traders looking at the Nasdaq100's price action. The technical signals, such as the bearish RSI and strong ADX on the daily chart, appear to be aligning with this deteriorating fundamental backdrop.
Looking at other major indices provides context. The S&P 500, currently at 6591.5, shows a daily downtrend with an ADX of 45.56, mirroring the bearish strength seen in the Nasdaq100. Its RSI is at 38.08, also indicating bearish momentum. Similarly, the Dow Jones 30, trading at 46426.5, shows a strong daily downtrend (ADX 41.32) despite a weaker RSI at 36.64. This broad-based weakness across major US equity indices suggests that the current market sentiment is not confined to the tech sector alone but reflects a more systemic risk-off mood. This correlation reinforces the bearish technical signals observed in the Nasdaq100 and suggests that any rallies might be short-lived unless there is a significant shift in macroeconomic or geopolitical conditions.
The energy markets are also painting a concerning picture. WTI Crude Oil is surging, currently at $91.65, with a strong daily uptrend indicated by an ADX of 57.34. Brent Crude is similarly strong at $101.99. Rising oil prices are a double-edged sword: they can signal robust global demand but also contribute significantly to inflationary pressures and act as a tax on consumers and businesses. This persistent upward pressure on energy costs exacerbates the inflation concerns that are already leading economists to revise their recession forecasts upwards. For the Nasdaq100, this translates into increased pressure on corporate earnings and a potential dampening of overall economic activity, factors that typically weigh heavily on growth-oriented stocks.
Considering the interplay of these factors, the technical outlook for the Nasdaq100 remains decidedly cautious, leaning towards bearish. The daily chart's strong downtrend signals (ADX 40.91, RSI 40.65) are difficult to dismiss. While short-term fluctuations might offer trading opportunities, the overarching trend suggests that the path of least resistance is downwards. Key support levels at $23,963.42 and $23,735.99 are critical watch areas. A failure to hold these levels could trigger further significant selling. Conversely, a sustained move above the $24,376.04 resistance, backed by improving macroeconomic data or a de-escalation of geopolitical tensions, would be required to invalidate the bearish thesis. Until then, traders should exercise caution and prioritize risk management.
The RSI on the daily chart at 40.65 suggests that while there is bearish momentum, the index is not yet in oversold territory. This implies that there is room for further downside before a significant oversold condition is met. The Stochastic indicator on the daily chart, however, shows a K value of 41.82 and a D value of 38.33, indicating a potential shift towards a bullish signal as %K crosses above %D. This is a conflicting signal within the broader bearish context. Such divergences often precede reversals, but confirmation is crucial. Traders should look for a sustained move above key resistance levels and a corresponding improvement in momentum indicators across multiple timeframes before considering a bullish stance.
The current market sentiment, characterized by rising recession odds and geopolitical jitters, strongly suggests a risk-off environment. This environment typically favors assets that are perceived as safe havens. While the Nasdaq100 is a risk-on asset, understanding its correlation with other markets is vital. The strengthening DXY at 99.4, coupled with rising oil prices, creates a complex backdrop. The market is pricing in potential economic slowdowns, which could impact corporate earnings and overall valuations for growth stocks. Therefore, any upward movements in the Nasdaq100 should be viewed with skepticism until there is a clear fundamental catalyst or a significant shift in technical momentum that provides strong confirmation.
The upcoming economic calendar, though not detailed with specific dates in the provided data, will be crucial. Releases concerning inflation (CPI, PPI), employment (NFP), and manufacturing activity (PMI) will provide vital clues about the health of the economy. Any data that deviates significantly from forecasts, particularly on the downside, could exacerbate recession fears and put further downward pressure on the Nasdaq100. Conversely, surprisingly strong data could offer some respite, but given the current sentiment, the market might be inclined to view positive news skeptically, perhaps attributing it to temporary factors or expecting it to be quickly overshadowed by broader concerns. The focus remains on whether the economy can achieve a soft landing or if a harder recession is inevitable.
Navigating the Uncertainty: Scenarios for the Nasdaq100
Bearish Scenario
Bearish Scenario: Downtrend Continuation
65% ProbabilityNeutral Scenario
Neutral Scenario: Consolidation and Choppy Price Action
25% ProbabilityBullish Scenario
Bullish Scenario: Short-Term Rebound on Easing Fears
10% ProbabilityThe technical indicators on the daily chart, particularly the ADX at 40.91 and RSI at 40.65, strongly suggest that the prevailing trend is bearish. This makes the bullish scenario less probable in the short term unless there is a significant shift in market sentiment, such as a de-escalation of geopolitical tensions or surprisingly positive economic data that counters the recession narrative. For now, the market appears poised to digest the current risks, making consolidation or further downside more likely outcomes. Traders should remain vigilant and await clearer signals before committing to strong directional positions.
The correlation between the Nasdaq100 and other market forces, such as the DXY at 99.4 and the S&P 500 at 6591.5, cannot be overstated. The current strength in the dollar and the broader equity market's bearish trend suggest that risk aversion is the dominant theme. This environment is inherently challenging for growth stocks. While short-term trading opportunities may arise during periods of consolidation, the longer-term outlook remains clouded by macroeconomic uncertainty and geopolitical instability. Patience and disciplined risk management are paramount for navigating these choppy waters.
Frequently Asked Questions: Nasdaq100 Analysis
What happens if the Nasdaq100 breaks below its daily support at $23,963.42?
A close below $23,963.42 on the daily chart would invalidate any short-term bullish hopes and likely trigger further selling pressure. The next significant support level to watch would be $23,735.99, with the potential to extend towards $23,550.80 if the bearish momentum intensifies.
Is the RSI at 40.65 a sell signal for the Nasdaq100 right now?
An RSI of 40.65 on the daily chart indicates bearish momentum, aligning with the overall downtrend. While not yet in oversold territory, it suggests that sellers are in control and further downside is possible. Confirmation from other indicators like MACD and ADX supports this bearish bias.
How will rising oil prices at $91.65 affect the Nasdaq100's outlook?
Rising oil prices, currently at $91.65 for WTI, contribute to inflationary pressures and can dampen economic growth. This increases recession odds, negatively impacting growth-oriented stocks like those in the Nasdaq100. It reinforces the current risk-off sentiment in the market.
Should traders consider buying the Nasdaq100 at current levels around $24,158.75?
Given the strong bearish signals on the daily chart (ADX 40.91, RSI 40.65) and rising recession fears, buying at current levels carries significant risk. A more prudent approach would be to wait for a confirmed break of resistance at $24,376.04 or a clear bullish divergence, while managing risk tightly.
The Nasdaq100's current technical setup, characterized by a strong daily downtrend and aligned with broader macroeconomic concerns like rising recession odds and geopolitical instability, presents a challenging environment for investors. While short-term trading opportunities may exist within consolidation patterns, the dominant trend suggests caution is warranted. The key lies in observing whether critical support levels hold or if further downside is imminent, all while keeping a close eye on the interplay between the dollar index, oil prices, and overall market sentiment. Patience and a disciplined approach to risk management will be crucial in navigating this uncertain period.
Track markets in real-time
AI-powered analysis, technical indicators and real-time price data.
Join Our Telegram Channel
Breaking market news, AI analysis and trading signals instantly.
Join Channel