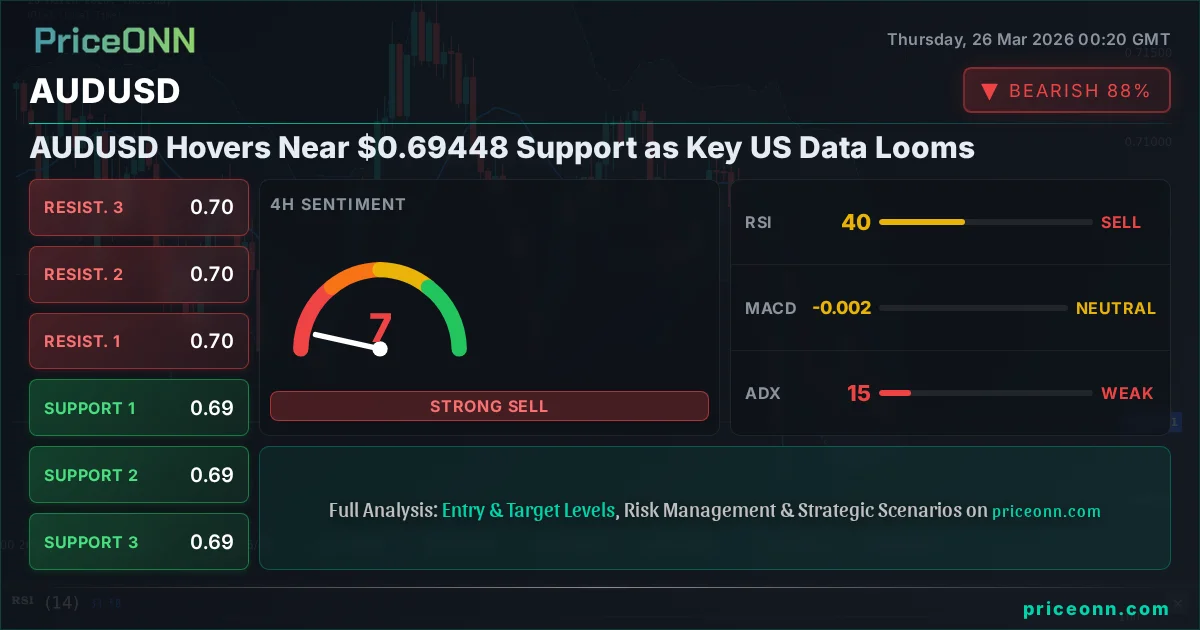
AUDUSD Hovers Near $0.69448 Support as Key US Data Looms
AUDUSD trades near $0.69448 support amid weak trend signals and anticipation of crucial US economic data releases.
Now this is where it gets interesting! The AUDUSD pair is currently dancing around the $0.69448 mark, teetering near a critical support level. While the immediate technical picture suggests a cautious approach, the real fireworks are expected from the upcoming US economic data. Traders are on the edge of their seats, waiting to see if these figures will provide the catalyst needed to break the current stalemate or deepen the existing downtrend. The Australian dollar has been under pressure, grappling with a generally strong US dollar and mixed global economic sentiment. However, any significant shifts in the US economic outlook, particularly regarding inflation and employment, could dramatically alter the trajectory for AUDUSD.
- AUDUSD is currently trading near $0.69448, testing key support levels.
- The 1-hour RSI is at 36.65, indicating a bearish momentum, while the 1-day Stochastic suggests a potential reversal with K=28.01 > D=37.83.
- The Dollar Index (DXY) is rising, currently at 99.42, which typically exerts downward pressure on AUDUSD.
- Upcoming US economic data, including employment figures and inflation indicators, are critical catalysts for the next move.
Navigating the AUDUSD Tightrope: A Technical Snapshot
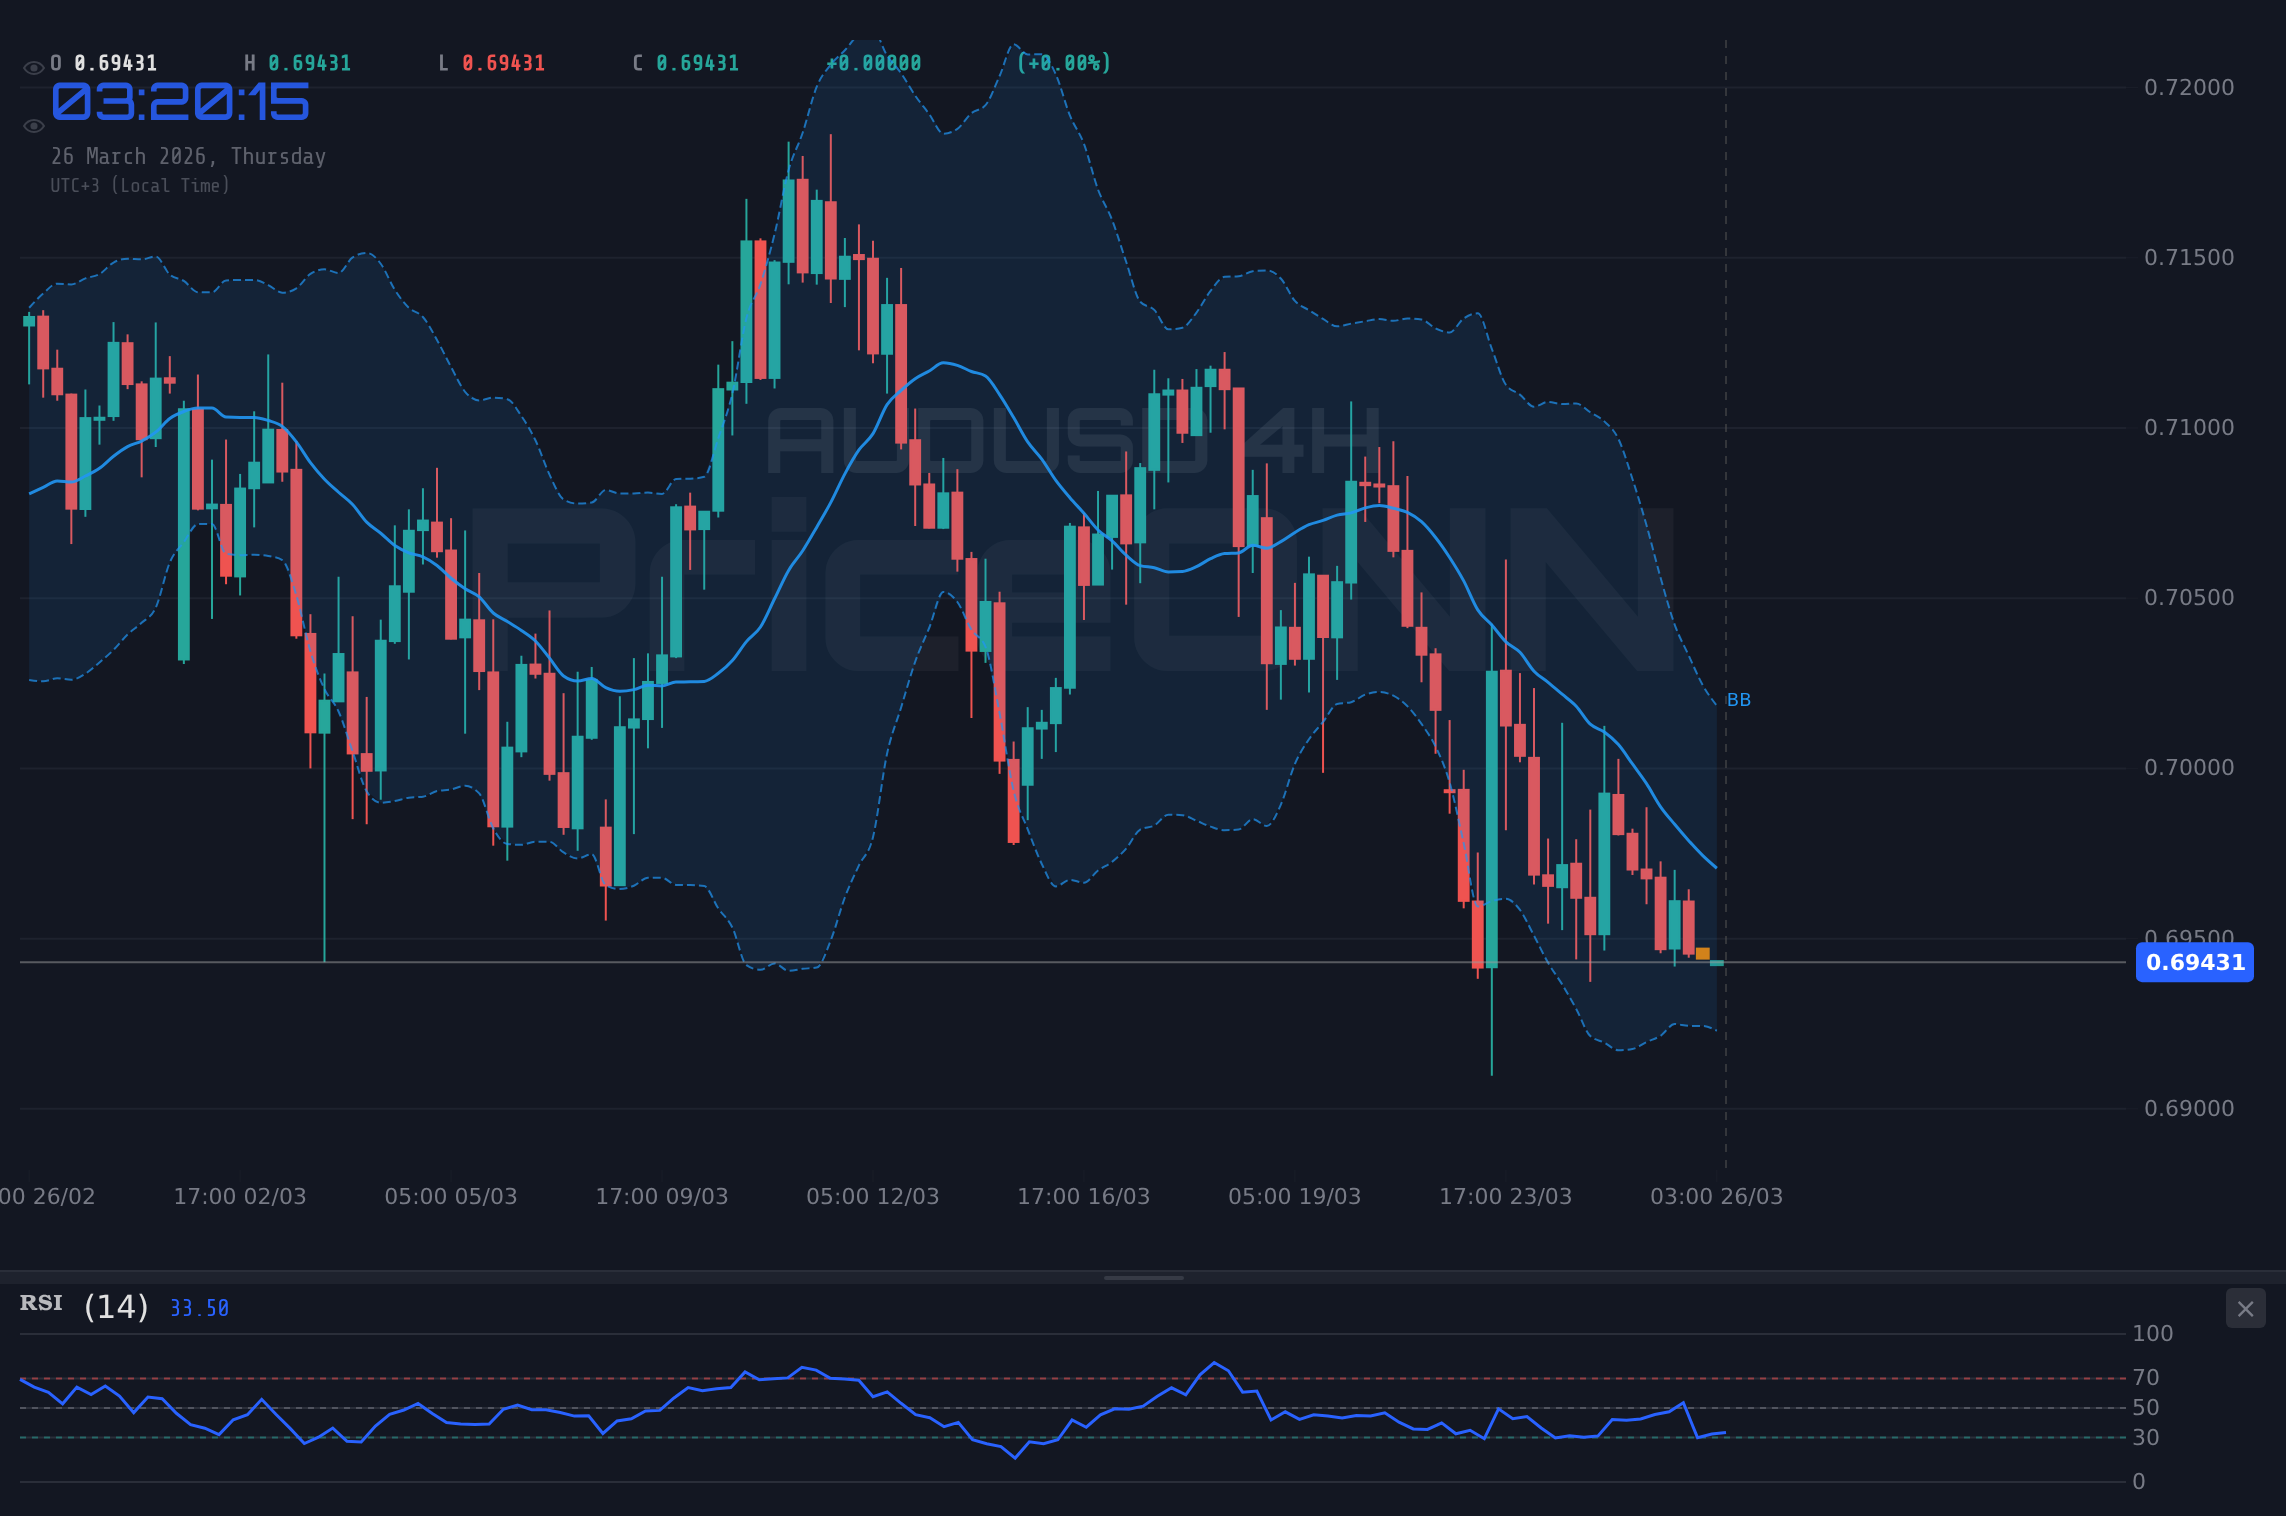
Looking at the AUDUSD on the 1-hour chart, the trend is decidedly bearish, with a strength of 82%. The ADX reading of 13.62, however, paints a picture of a weak trend, suggesting that the current downward momentum might lack conviction. This is a common scenario where price action becomes choppy, and breakout attempts often fail. The RSI(14) sits at 36.65, firmly in neutral territory but leaning towards oversold conditions, hinting that sellers might be losing some steam. Meanwhile, the Stochastic oscillator presents a conflicting signal: the %K line at 14.81 is below the %D line at 22.47, reinforcing the bearish sentiment, yet it's deep in oversold territory, which could precede a bounce.
The 4-hour timeframe offers a slightly different perspective. Here, the trend is also classified as bearish with 87% strength, yet the ADX remains low at 14.86, again pointing to a lack of a strong, established trend. The RSI(14) is at 39.55, still in the neutral zone and indicating a downward inclination. The MACD indicator's momentum is noted as 'balancing', suggesting a potential shift is brewing, though not yet confirmed. The Bollinger Bands are positioned below the middle band, aligning with the bearish bias. Stochastic is showing %K at 18.27 and %D at 31.54, a bearish crossover, but both are in oversold territory. This divergence between the overall trend direction and the weak trend strength, coupled with conflicting oscillator signals, highlights the indecision in the market.
Zooming out to the daily chart, the AUDUSD trend is neutral with 50% strength, a stark contrast to the shorter timeframes. The ADX at 22.21 indicates a moderately strong trend, but its direction isn't clearly defined by the overall trend classification. The RSI(14) is at 42.56, continuing the bearish inclination. However, the Stochastic oscillator provides a notable divergence: %K is at 28.01 and %D is at 37.83, a bearish signal, but crucially, it is emerging from oversold conditions. This could be an early warning sign of a potential trend reversal if confirmed by subsequent price action and other indicators. The Bollinger Bands are trading below the lower band, which historically can signal oversold conditions or a strong breakdown, demanding careful interpretation.
The Dollar's Shadow: DXY's Influence on AUDUSD
No analysis of AUDUSD would be complete without considering the powerful influence of the US Dollar Index (DXY). Currently, the DXY is trading at 99.42, showing a strong upward trend on the daily chart with 91% strength. This strengthening dollar is a significant headwind for AUDUSD. Historically, a rising DXY tends to put downward pressure on currency pairs like AUDUSD, as a stronger dollar makes the Australian dollar relatively more expensive for holders of other currencies. The DXY's RSI(14) is at 57.79, comfortably in neutral territory and indicating a bullish inclination, while its ADX of 32.09 signifies a strong upward trend. This confluence of factors suggests that the dollar's strength is a primary driver currently weighing on the Aussie.
On the 1-hour timeframe, the DXY shows a strong bullish trend (98% strength) with an RSI of 66.39 and an ADX of 15.77. The Stochastic oscillator is in overbought territory, suggesting a potential short-term pullback. However, even a temporary dip in the DXY might not be enough to give AUDUSD significant breathing room if the broader trend remains upward. The 4-hour DXY chart also shows a bullish inclination, with an RSI of 56.84 and an ADX of 12.26. While the Stochastic is showing a bullish signal, the overall picture for the dollar remains robust. This persistent dollar strength is a key fundamental factor that traders must contend with when assessing AUDUSD's prospects.
The correlation between AUDUSD and DXY is typically inverse. When the DXY strengthens, AUDUSD tends to weaken, and vice versa. Given the current upward momentum in the DXY, it reinforces the bearish outlook for AUDUSD. Any signs of weakness in the dollar, such as a break below key DXY support levels or a significant shift in Federal Reserve sentiment, would be a crucial development to watch for a potential AUDUSD recovery. For now, the dollar's strength is a dominant theme that cannot be ignored.
Key US Economic Data on the Horizon: What to Watch
The upcoming economic calendar is densely packed with high-impact US data releases that are poised to be significant catalysts for AUDUSD. These figures will provide crucial insights into the health of the US economy, influencing Federal Reserve policy expectations and, consequently, the direction of the US dollar. The market is particularly sensitive to inflation and employment numbers, as these are key determinants of the Fed's monetary policy stance. Any deviation from forecasts in these reports could trigger substantial volatility across currency markets.
Specifically, the release of [USD] data with an Actual value of 52.4 against a Forecast of 51.5 suggests a stronger-than-expected performance in that particular economic indicator. This positive surprise could bolster the US dollar by reinforcing expectations of a resilient economy, potentially adding further pressure on AUDUSD. Conversely, upcoming data points like [USD] with an Actual of -1.3 against a Forecast of 6.156 (previous 6.156) represent a significant miss, potentially weakening the dollar if it signals a slowdown in employment growth. This kind of conflicting data can lead to whipsaw price action.
Traders will also be scrutinizing the [EUR] and [GBP] economic releases, even though they are not directly tied to USD, as they can provide a broader picture of global economic health and risk appetite. For instance, a surprisingly weak Eurozone or UK economic report could indirectly weigh on AUDUSD by dampening overall market sentiment, even if US data is mixed. The key is to understand how these data points interact with each other and with the prevailing market narrative. The upcoming [USD] employment change data, with a previous figure of 205 and a forecast of 211, will be closely watched. A strong print could support the dollar, while a miss could invite selling.
The market’s reaction to these releases will depend not only on the numbers themselves but also on how they align with or deviate from current expectations. If the data significantly surprises to the upside, it could solidify expectations of a hawkish Federal Reserve, leading to further dollar strength and a potential test of lower AUDUSD levels. Conversely, weaker-than-expected data could fuel speculation of a Fed pivot or rate cuts, weakening the dollar and offering a reprieve for the Australian dollar. This dynamic makes the upcoming data releases the most critical factor for AUDUSD in the short term.
Fundamental Drivers: Beyond the Charts
While technical indicators provide valuable insights into market sentiment and potential price levels, the fundamental underpinnings are what drive long-term currency movements. For AUDUSD, the interplay between Australian and US economic policies, commodity prices, and global risk sentiment is paramount. The Australian economy's reliance on commodity exports means that global growth expectations and demand for raw materials significantly impact the Aussie's value.
Currently, the outlook for global growth remains somewhat uncertain. While some indicators suggest resilience, geopolitical tensions and persistent inflation continue to cast a shadow. The price of oil, for instance, is a key indicator of inflationary pressures and global demand. Brent crude is trading at $101.86, showing a strong daily increase of 2.41%, and WTI is at $91.56, up 3.31%. Higher energy prices can fuel inflation concerns, potentially leading central banks to maintain tighter monetary policies, which generally supports their respective currencies. For the AUD, however, rising oil prices can be a double-edged sword; while they might reflect strong global demand, they also increase input costs for businesses and consumers.
The RBA's (Reserve Bank of Australia) monetary policy stance is also a critical factor. While the provided data doesn't include explicit RBA forward guidance, market expectations about future interest rate decisions play a crucial role. If the RBA is perceived as being more dovish than the Federal Reserve, it would likely weigh on AUDUSD. Conversely, any indication that the RBA might adopt a more hawkish stance, perhaps due to persistent inflation in Australia, could provide support for the Aussie. The market will be looking for any subtle shifts in RBA commentary or economic data that might signal a change in policy direction.
Furthermore, risk sentiment plays a significant role. When global markets are fearful, investors often flock to perceived safe-haven assets, which can include the US dollar and sometimes the Japanese Yen, while riskier currencies like the Australian dollar may suffer. The performance of major indices like the S&P 500 (currently at 6591.4, showing a slight daily decline) and Nasdaq 100 (at 24169.24, also down slightly) provides clues about overall risk appetite. A sustained risk-off environment would likely be bearish for AUDUSD, especially if it coincides with dollar strength.
The Path Forward: Scenarios and Strategy
Given the current technical indecision, conflicting indicators, and the looming economic data, it’s crucial to outline potential scenarios for AUDUSD. The market is at a crossroads, and the direction will likely be dictated by the upcoming US data and how it impacts the Federal Reserve's policy outlook.
Bearish Scenario: Dollar Strength Prevails
65% ProbabilityNeutral Scenario: Consolidation Continues
25% ProbabilityBullish Scenario: USD Weakness Emerges
10% ProbabilityFrequently Asked Questions: AUDUSD Analysis
What happens if AUDUSD breaks decisively below the $0.69448 support level?
A close below $0.69448, especially if confirmed by strong US employment or inflation data, would likely trigger further selling pressure. The next key support levels to watch would be $0.69337 on the 1-hour chart and potentially $0.69167 on the 4-hour chart, indicating a continuation of the bearish trend.
Should I consider buying AUDUSD at current levels near $0.69448 given the 1-day Stochastic signal?
While the 1-day Stochastic is emerging from oversold territory (K=28.01 > D=37.83), it's a lone bullish signal against a broader bearish technical picture and strong dollar. A more conservative approach would be to wait for confirmation, such as a break above $0.69513 resistance or a clear shift in US data sentiment, before considering a long position.
Is the RSI at 36.65 on the 1-hour chart a strong sell signal for AUDUSD?
An RSI of 36.65 indicates bearish momentum but is not yet in oversold territory on the 1-hour chart. It suggests that sellers are in control in the short term, aligning with the overall bearish trend. However, on the daily chart, the RSI is at 42.56, which is closer to neutral, indicating that the longer-term picture is less definitive and requires broader confirmation.
How will upcoming US Non-Farm Payrolls (NFP) data affect AUDUSD this week?
A strong NFP print (e.g., above the forecasted 211k) would likely boost the US dollar, potentially pushing AUDUSD towards $0.69337 or lower. Conversely, a weaker NFP result could trigger dollar selling and a move higher for AUDUSD, possibly testing resistance near $0.69513, as it fuels Fed rate cut expectations.
The AUDUSD remains in a precarious position, caught between the persistent strength of the US dollar and the technical signals suggesting potential oversold conditions on longer timeframes. The immediate future hinges critically on the upcoming US economic data. A continuation of dollar strength, fueled by robust employment or inflation figures, could see AUDUSD testing lower support levels. However, any sign of economic softening in the US could provide the Aussie with much-needed relief. Patience and risk management are paramount here; waiting for clear directional signals, ideally confirmed by both technicals and fundamentals, will be key to navigating this uncertain landscape. Volatility is expected, and prepared traders will find opportunities amidst the noise.
Track markets in real-time
AI-powered analysis, technical indicators and real-time price data.
Join Our Telegram Channel
Breaking market news, AI analysis and trading signals instantly.
Join Channel