XAUUSD Tests $4,512 Resistance Amid Geopolitical Tensions and PMI Data
Gold hovers near $4,512 as traders digest mixed PMI data and geopolitical risks. The daily RSI at 47.6 signals caution.
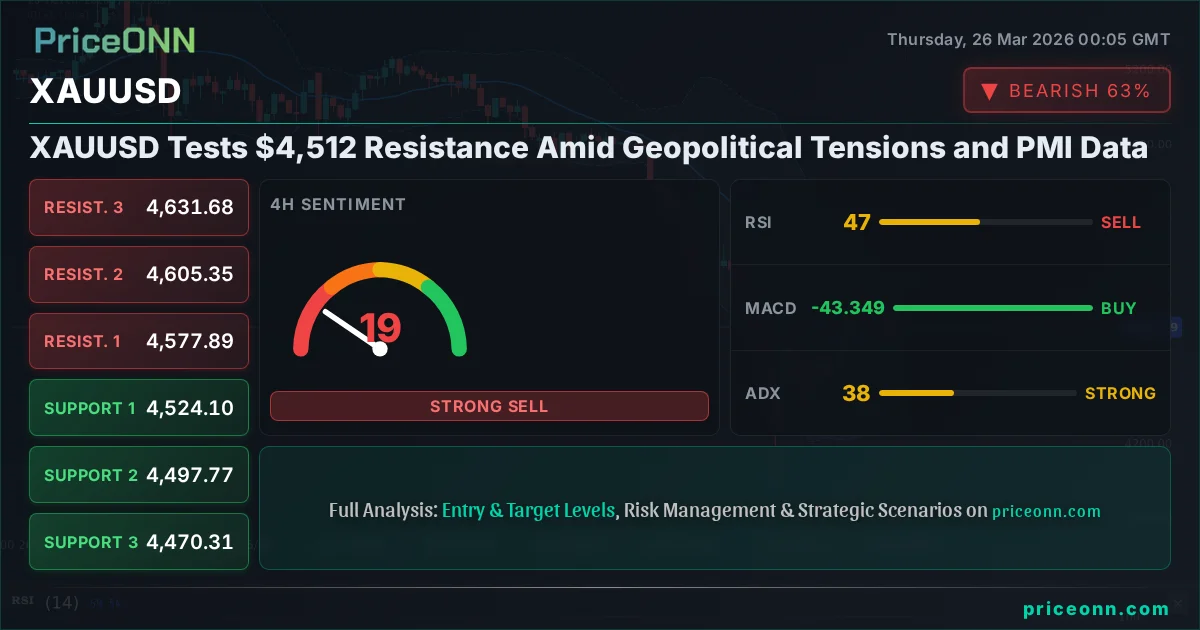
Gold, the perennial safe-haven asset, finds itself at a critical juncture, currently trading at $4,512.35. This price point reflects a complex interplay of factors, from lingering geopolitical anxieties to the latest economic indicators. As traders navigate these crosscurrents, understanding the nuances of the current market sentiment and technical positioning is paramount for discerning the metal's next move. The daily chart presents a picture of cautious trading, with the RSI at 47.6 indicating a neutral stance, though leaning towards a slight bearish momentum on the hourly timeframe. This delicate balance suggests that while immediate pressures might be mounting, the underlying demand for gold as a hedge against uncertainty remains a significant theme.
- The RSI at 47.6 on the 1-hour chart signals neutral momentum, while the 4-hour RSI at 46.57 indicates a downward trend.
- Critical support for XAUUSD is identified at $4,503.86, with further levels at $4,490.41 and $4,475.07.
- Resistance is being tested near $4,532.65, followed by $4,547.99 and $4,561.44.
- The US Dollar Index (DXY) is currently at 99.41, reflecting strength that typically pressures gold prices.
The current price action for XAUUSD, hovering around $4,512.35, is a testament to the ongoing tug-of-war between inflationary concerns and the strengthening dollar narrative. While the daily trend indicator signals a bearish leaning with a 94% power, the intraday movements and indicator readings present a more nuanced picture. The 1-hour chart, for instance, shows a neutral trend with a 50% power, and the RSI at 47.6 suggests a lack of strong directional conviction. This divergence across timeframes is typical in periods of economic uncertainty, where short-term fluctuations can mask longer-term underlying pressures. The market is clearly awaiting clearer signals from economic data or geopolitical developments to commit to a decisive direction. For seasoned analysts like myself, this period demands a close watch on how key support and resistance levels are treated, as they often act as battlegrounds for conflicting market forces.
Navigating the Technical Landscape: Indicators and Levels
Delving deeper into the technical indicators on the 1-hour chart reveals a mixed bag of signals. The MACD is showing negative momentum, with the MACD line below its signal line, indicating selling pressure. Similarly, the Stochastic Oscillator, with K at 26.95 and D at 36.73, is signaling a bearish trend as %K is below %D. The Bollinger Bands are also positioned below the middle band, reinforcing a downward bias in the short term. However, the ADX at 17.36 suggests a weak trend, implying that these short-term moves might lack the conviction to sustain a significant directional shift. This is a crucial observation; a weak trend means that price action can be choppy and prone to reversals, making it difficult to establish a clear trading strategy without further confirmation.
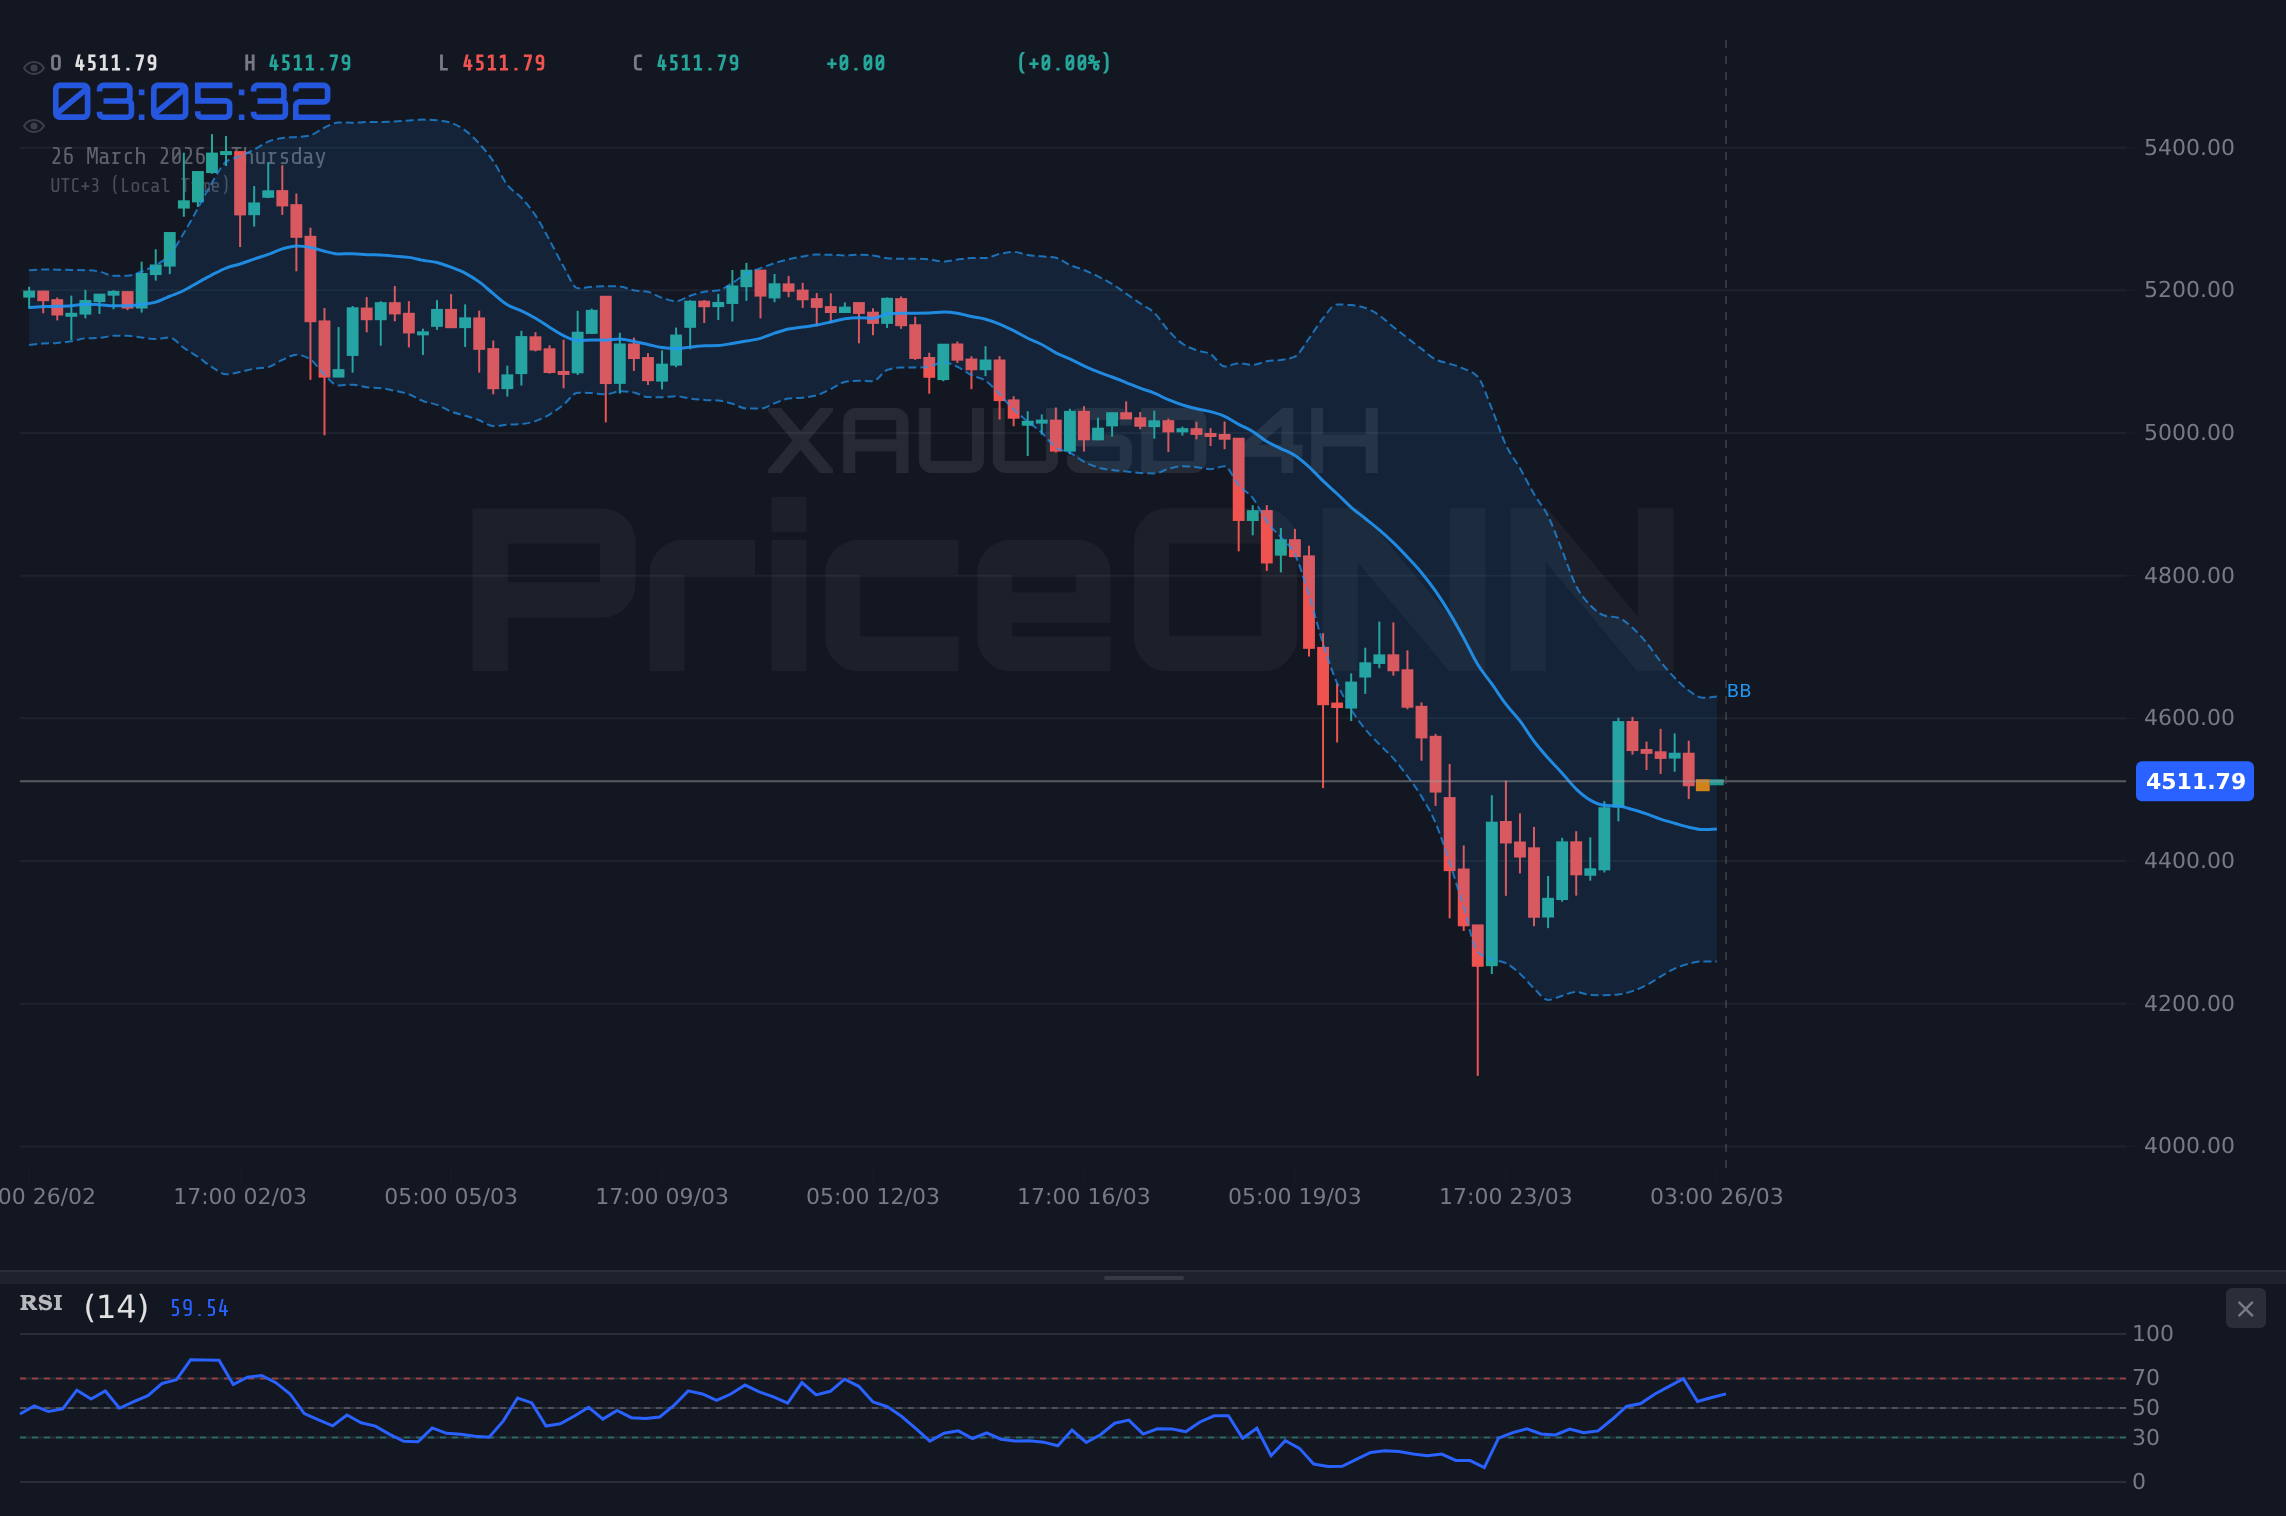
Moving to the 4-hour timeframe, the narrative shifts slightly. Here, the trend is still neutral with 50% power, but the MACD is displaying positive momentum, with the line above its signal line. The Bollinger Bands are trading above the middle band, hinting at a potential upward bias. Yet, the Stochastic Oscillator is showing a bearish signal with K at 74.93 and D at 83.5, indicating that while momentum might be building, the asset is approaching overbought territory from a stochastic perspective, suggesting a potential pullback. The ADX at 37.72, however, paints a starkly different picture, indicating a strong downtrend. This conflict between Bollinger and MACD on one hand, and Stochastic and ADX on the other, underscores the current indecision in the market. It's a classic case of conflicting signals where traders must exercise extreme caution, waiting for confluence before committing to a trade.
The daily timeframe paints the most definitive picture, with a strong downtrend signal (94% power). The RSI at 33.61 is deep in the neutral zone, nearing oversold conditions, which could suggest a potential for a bounce, but it's crucial to remember that RSI can remain in oversold territory for extended periods during a strong downtrend. The MACD is negative, and Bollinger Bands are below the middle band, confirming the bearish sentiment. Interestingly, the Stochastic Oscillator is showing a potential bullish signal with K at 33.95 and D at 17.18, where %K is above %D, suggesting a possible upward correction is brewing. The ADX at 27.45 confirms a strong downtrend. This conflicting signal between RSI/Stochastic and the overall trend indicators highlights the importance of not relying on a single indicator. The prevailing daily trend is bearish, but the intraday oscillators hint at possible short-term buying interest.
Key Levels: The Battlegrounds for Gold
The immediate price action for XAUUSD is heavily influenced by the defined support and resistance levels. On the 1-hour chart, the first level of support is at $4,503.86. Should this level falter, traders will be looking at $4,490.41 and then $4,475.07. These are the immediate lines of defense for the bulls. Conversely, resistance lies at $4,532.65. A decisive break above this level could signal further upside, targeting $4,547.99 and potentially $4,561.44. The fact that the current price is hovering just below the initial resistance suggests a bearish bias in the immediate short term, but the proximity to support means that any reversal in broader market sentiment could quickly shift the focus upwards.
The 4-hour chart provides a broader perspective on these battlegrounds. Support is seen at $4,524.10, followed by $4,497.77 and $4,470.31. These levels are crucial for determining the medium-term direction. Resistance is positioned higher, at $4,577.89, then $4,605.35, and further up at $4,631.68. The current price being below the 4-hour middle Bollinger Band, yet with some positive MACD momentum, indicates a potential push-and-pull dynamic. Traders will be keenly watching if the price can reclaim the middle band, which often acts as a pivot point. The strength of the ADX at 37.72 on this timeframe, however, reinforces the idea that if a breakout does occur, it could be substantial, but currently, the price is struggling to establish clear momentum.
On the daily chart, the longer-term picture reveals more significant levels. Support is established at $4,358.65, $4,243.31, and $4,180.66. These represent substantial price floors that, if breached, would signal a significant shift in market sentiment. Resistance levels on the daily chart are more imposing, starting at $4,536.64, followed by $4,599.29, and the significant psychological and technical barrier at $4,714.63. The current price of $4,512.35 is precariously positioned between these major levels. Its ability to hold above the significant support levels while failing to decisively break through immediate resistance at $4,532.65 on the 1-hour chart is what defines the current market tension. The daily RSI at 33.61 suggests room for a bounce, but the strong ADX of 27.45 in a downtrend indicates that any such bounce might be a corrective move within a larger bearish trend.
Fundamental Underpinnings: Data and Geopolitics
The price of gold is intrinsically linked to macroeconomic factors and geopolitical stability. Currently, the strengthening US Dollar Index (DXY), which stands at 99.41 and shows a strong daily uptrend, acts as a headwind for gold. A stronger dollar typically makes gold more expensive for holders of other currencies, potentially dampening demand. The DXY's movement is influenced by a multitude of factors, including interest rate expectations and global risk sentiment. With the daily ADX for DXY at 32.09, indicating a strong uptrend, this correlation is currently a significant pressure point for gold.
The economic calendar provides further context. While specific high-impact events for the US dollar were not detailed for today's immediate trading session beyond the PMI data, the recent US PMI figures showed mixed signals. The Services PMI came in at 52.4, beating the forecast of 51.5, which typically supports a stronger dollar. However, the Manufacturing PMI was slightly weaker at 51.1 against a forecast of 52.0. This mixed data can contribute to the indecision seen across various timeframes. For gold, such data often leads to heightened volatility rather than a clear directional move, as conflicting economic signals create uncertainty about the Federal Reserve's future monetary policy path. The market is keenly awaiting the next major inflation or employment report to gauge the Fed's reaction function more precisely.
Geopolitical tensions remain a significant, albeit often unquantifiable, driver for gold. While the provided data does not detail specific ongoing geopolitical events, the general elevated level of global uncertainty is a known factor supporting safe-haven assets. News reports from the last 48 hours mention easing US-Iran tensions, which might have a dampening effect on safe-haven demand. However, other global hotspots and potential flashpoints continue to exist, and any escalation could rapidly shift market sentiment back towards gold. The interplay between geopolitical risk premiums and the dollar's strength is complex. Often, during periods of extreme stress, both gold and the dollar can see demand, but the dollar's appeal as a liquidity provider can sometimes overshadow gold's traditional safe-haven status.
Market Sentiment and Correlation Analysis
The broader market sentiment, as indicated by the S&P 500 and Nasdaq, currently leans towards a cautious or slightly risk-off stance. The S&P 500 is trading at 6581.85, down 0.23% for the day, with a strong daily downtrend indicated by its 100% power trend strength and ADX at 45.56. Similarly, the Nasdaq 100 is down 0.29% at 24119.89, also showing a strong daily downtrend. This general weakness in equities often correlates with increased demand for safe-haven assets like gold. However, the strong uptrend in the DXY complicates this traditional correlation. Typically, a falling stock market would boost gold, but a strong dollar can counteract this effect. The current scenario where equities are down, but the dollar is also strong, creates a challenging environment for gold, where its safe-haven appeal is being tested against the headwind of a robust currency.
Examining other commodities provides additional context. Brent crude is trading at $101.86, showing a significant daily increase of 2.41%, indicating rising energy prices. This surge in oil prices can fuel inflation expectations, which historically benefits gold as an inflation hedge. However, the extent to which this inflation narrative is currently priced in by the market, versus the dominant narrative of dollar strength and potential economic slowdown, is debatable. The WTI crude price is also up 3.41% at $91.65, reinforcing the upward trend in energy markets. This inflationary pressure from energy could provide a foundational level of support for gold, even as other factors pull in the opposite direction. The key will be how central banks respond to this energy-driven inflation – will they tighten policy further, potentially hurting growth and gold, or will they tolerate it, allowing gold to benefit from its inflation-hedging properties?
The XAUUSD Outlook: Balancing Forces
The outlook for XAUUSD remains balanced, with significant forces pulling in opposing directions. On the one hand, the daily downtrend, strong ADX readings, and the robust performance of the US dollar present considerable headwinds. The immediate resistance at $4,532.65 on the 1-hour chart is a key hurdle. A failure to break this level, coupled with a sustained rise in the DXY or a significant shift in Fed rate expectations towards hawkishness, could see gold prices retreating towards the $4,503.86 support. The prevalence of 'SELL' signals across multiple timeframes, particularly on the 1-hour and 4-hour charts, suggests that caution is the prevailing sentiment among short-term traders.
On the other hand, the potential for geopolitical flare-ups, persistent inflationary pressures from energy markets, and the sheer depth of the downtrend on the daily chart (RSI at 33.61) could provide a floor. The fact that gold is currently trading above the significant daily support levels indicates that buyers are still present, albeit perhaps waiting for clearer confirmation. The conflicting signals from intraday oscillators like the Stochastic, which hints at potential upward momentum, should not be ignored entirely. If market sentiment were to shift abruptly towards risk aversion, or if economic data were to unexpectedly weaken significantly, gold could find renewed strength, potentially challenging the higher resistance levels. The market is in a state of flux, and the next 24-48 hours, particularly with any new economic data releases or geopolitical developments, will be crucial in determining the next directional move.
Scenario Analysis: Charting Potential Paths
Bearish Scenario: Testing the Depths
65% ProbabilityNeutral Scenario: Consolidation Around $4,512
25% ProbabilityBullish Scenario: A Bounce from Support
10% ProbabilityFrequently Asked Questions: XAUUSD Analysis
What happens if XAUUSD breaks below the $4,503.86 support level?
A break below $4,503.86 on the 1-hour chart would invalidate the current consolidation pattern and likely trigger further selling pressure. The immediate targets would then shift to $4,490.41 and subsequently $4,475.07, as indicated by the technical setup.
Is the RSI at 47.6 a sell signal for XAUUSD right now?
An RSI of 47.6 on the 1-hour chart is in neutral territory, leaning slightly bearish but not definitively oversold or overbought. While it doesn't signal an immediate buy, it suggests a lack of strong bullish momentum, aligning with the cautious sentiment around the $4,512.35 price level.
How will the recent PMI data affect XAUUSD this week?
The mixed US PMI data (Services beat, Manufacturing missed) creates ambiguity for XAUUSD. It suggests potential underlying economic strain that could support gold's safe-haven appeal, but also fuels dollar strength, which acts as a headwind. Traders will watch for any follow-through from this data into broader market sentiment.
Should traders consider buying XAUUSD at current levels of $4,512.35?
Buying at $4,512.35 carries risk given the immediate resistance at $4,532.65 and the bearish signals on shorter timeframes. A more prudent approach would be to wait for a clear break above resistance or a confirmed bounce from support around $4,503.86, especially considering the strong dollar.
The path forward for gold hinges on its ability to navigate the immediate resistance at $4,532.65. A decisive move above this level, supported by a weakening dollar or escalating geopolitical risks, could open the door for a rally towards $4,547.99 and beyond. However, failure to overcome this hurdle, especially with the DXY showing strength and daily technicals leaning bearish, could lead to a retest of support levels around $4,503.86. The market is currently balanced on a knife's edge, and disciplined risk management remains the most critical tool for any trader navigating these choppy waters. Patience and waiting for clear, confirmed signals will be key to capitalizing on the opportunities that will undoubtedly emerge from this period of price discovery.
Track markets in real-time
AI-powered analysis, technical indicators and real-time price data.
Join Our Telegram Channel
Breaking market news, AI analysis and trading signals instantly.
Join Channel