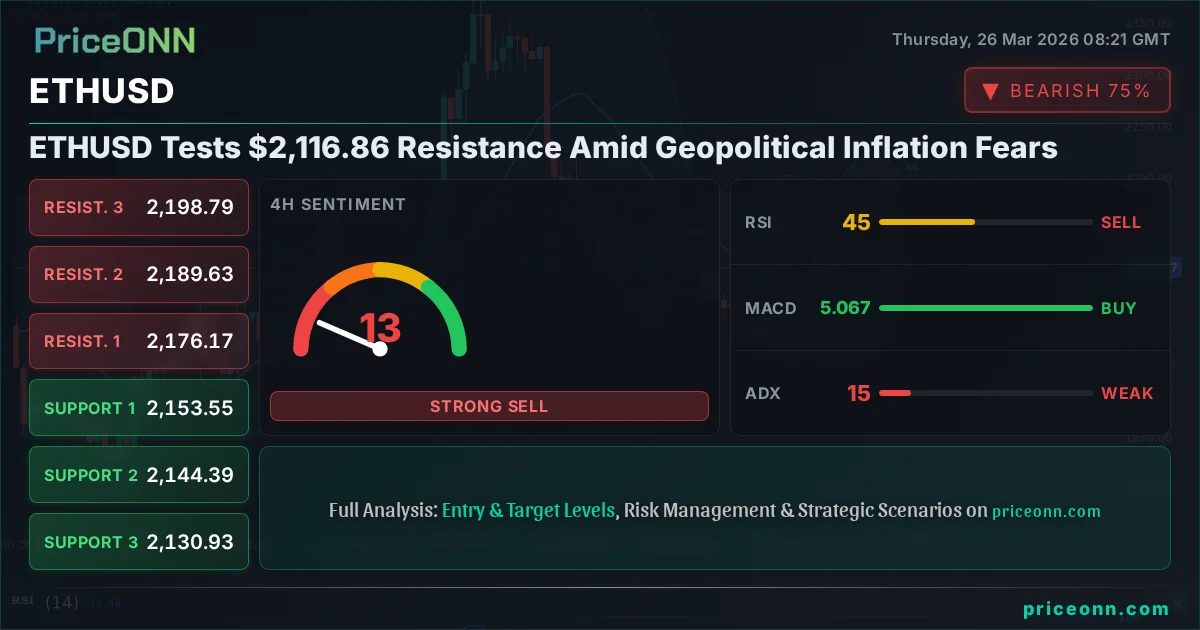
ETHUSD Tests $2,116.86 Resistance Amid Geopolitical Inflation Fears
ETHUSD hovers near $2,116.86 as Middle East tensions fuel inflation worries, impacting risk appetite and dollar strength. Explore the key levels and scenarios.
Is ETHUSD poised for a breakout or a pullback as geopolitical tensions escalate and inflation fears grip global markets? The cryptocurrency is currently locked in a critical battle around the $2,116.86 mark, a level that many traders are watching closely. This price point, sitting just below immediate resistance, represents a key juncture where the bulls and bears are duking it out. The broader market sentiment, heavily influenced by rising energy prices and a strengthening US Dollar Index (DXY) currently at 99.46, paints a complex picture for risk assets like Ethereum.
- ETHUSD is trading at $2,116.86, testing resistance levels.
- RSI at 31.49 on the 1H chart signals bearish momentum, while the 1D chart shows RSI at 49.59, indicating a potential shift.
- Critical support for ETHUSD is identified at $2,112.08 (1H) and $2,107.12 (1D), with resistance at $2,125.13 (1H) and $2,192.78 (1D).
- Geopolitical tensions are fueling inflation fears, strengthening the DXY to 99.46 and pressuring risk assets.
The Bull's Roadmap: Navigating Towards Higher Ground
For ETHUSD to reclaim higher ground, a decisive move above the immediate resistance is paramount. The 1-hour chart shows resistance at $2,125.13, followed by $2,130.50 and $2,138.18. A sustained break above these levels, ideally with increasing volume, would signal a bullish conviction. This scenario becomes more probable if the broader market sentiment shifts from risk-off to risk-on, perhaps spurred by easing geopolitical tensions or surprisingly dovish signals from central banks, though current Fed Fund Futures pricing suggests otherwise with a strong bias towards no immediate rate cuts. The MACD on the 1-hour chart, while currently showing negative momentum, could flip positive if buying pressure intensifies, aligning with a Stochastic indicator that is emerging from oversold territory. Historically, such bounces often occur when short-term oversold conditions are met, but the overarching downtrend on the 1-day chart (ADX at 17.78) suggests caution is still warranted. A strong close above $2,138.18 on the 1-hour chart could pave the way for a test of the $2,176.17 level on the 4-hour chart, and potentially higher towards $2,192.78, the first significant resistance on the daily timeframe. However, this path requires overcoming the current bearish sentiment and the strengthening dollar.
The daily chart presents a more challenging, yet potentially rewarding, bullish outlook if key conditions are met. Currently, the RSI stands at 49.59, hovering just below the neutral 50 mark, suggesting that while bearish momentum persists, there's room for a recovery. A move above this level, coupled with a MACD crossover on the daily chart, would be a significant bullish signal. The ADX on the daily timeframe is at 16.6, indicating a weak trend, which means that a breakout could lead to a rapid price movement if it gains traction. For bulls to truly take control, ETHUSD needs to reclaim and hold above the $2,192.78 resistance. If this level is breached, the next logical targets would be $2,223.92 and then the more significant $2,251.18. This would signify a reversal of the current short-term downtrend and potentially attract more buyers looking to capitalize on the shift in momentum. However, the path upwards is fraught with hurdles; any hint of continued geopolitical escalation or hawkish commentary from the Fed could quickly extinguish this bullish fire, pushing prices back towards the lower support levels.
The influence of the DXY (Dollar Index) cannot be overstated in this scenario. As the DXY currently sits at 99.46 and shows a 90% upward trend on the 1-hour chart, its strength acts as a headwind for ETHUSD. A sustained rise in the dollar typically correlates with a decrease in risk appetite, making assets like Ethereum less attractive. For the bullish case to materialize, we would likely need to see a pullback in the DXY, perhaps triggered by cooling inflation expectations or a shift in Fed policy outlook, though current economic data does not strongly support this. The correlation between ETHUSD and risk assets like the Nasdaq (currently at 24000.61, down 0.65%) also plays a crucial role. If the Nasdaq can find its footing and begin to climb, it could provide a supportive tailwind for ETHUSD. However, the current trend on the Nasdaq's 1-hour chart is neutral, and the 1-day chart shows a strong bearish trend (ADX 45.86), indicating that broader market weakness could continue to weigh on ETHUSD.
Where Bears Take Control: The Downside Risk
The bearish scenario for ETHUSD is currently looking more dominant, especially considering the immediate technical signals and the prevailing market sentiment. On the 1-hour chart, ETHUSD is trading below the middle Bollinger Band, with the RSI at 31.49 and the Stochastic Oscillator showing a clear sell signal (%K < %D). The MACD also indicates negative momentum. These indicators collectively suggest that downward pressure is building. The immediate support level to watch is $2,112.08. A break below this level, especially on increased volume, would likely trigger further selling, targeting the next support at $2,104.40 and then the more significant daily support at $2,107.12. If these levels fail to hold, the bears could push ETHUSD down towards the $2,099.03 level on the 1-hour chart, and potentially retest the daily support at $2,075.98.
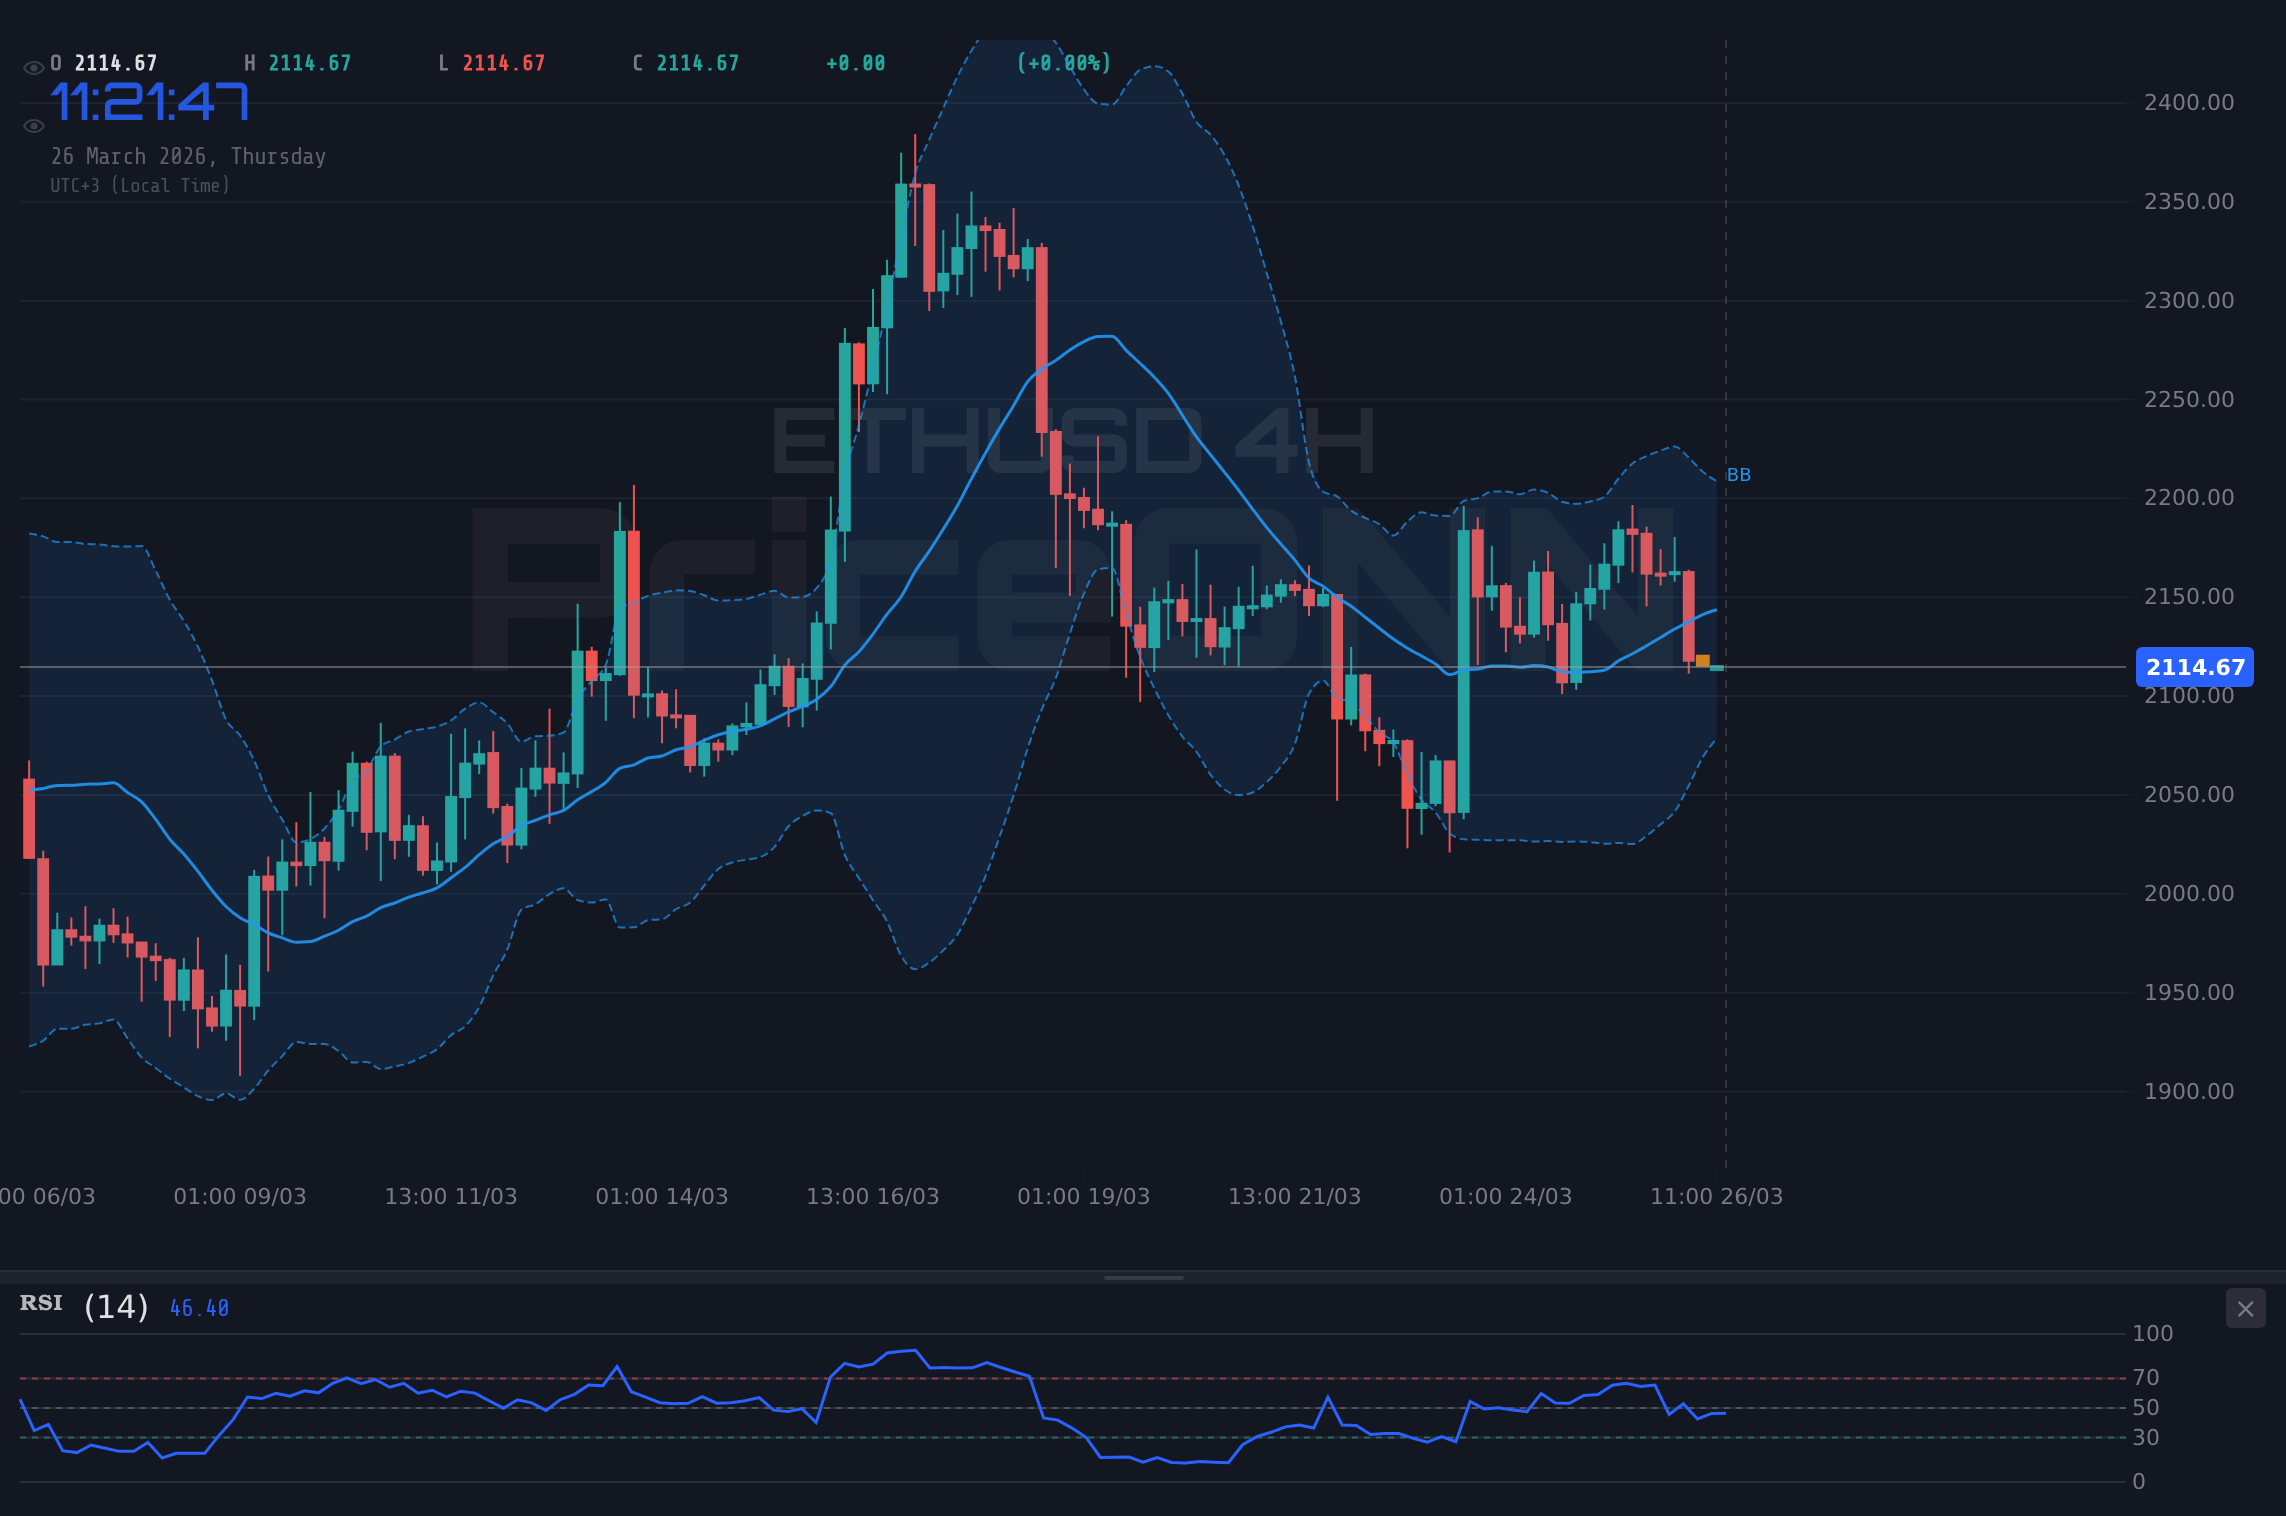
The 4-hour chart reinforces the bearish outlook, with ETHUSD trading below its middle Bollinger Band and showing a general downward trend. The RSI at 42.27, while not deeply oversold, is below the 50 level, and the Stochastic is giving a sell signal. The ADX at 15.04 suggests a weak trend, which often precedes sharper moves when a breakout occurs. If the price breaks below the 1-hour support levels, the 4-hour chart's support at $2,075.98 becomes a critical area. A decisive close below this level on the 4-hour chart would likely signal a continuation of the downtrend, potentially opening the door for a move towards the $2,000 psychological level and further down towards the $1,900s, though these are more extended targets not immediately indicated by current short-term charts. The selling pressure could be exacerbated by any negative news related to the ongoing Middle East tensions or hawkish commentary from the Federal Reserve, which would further strengthen the DXY and reduce demand for riskier assets.
On the daily timeframe, the situation is still developing, but the overall picture leans bearish. The RSI at 49.59 is a key level to watch; a sustained move below this could confirm a bearish bias. The MACD is currently showing negative momentum, and the price is below the middle Bollinger Band, aligning with the short-term bearish signals. The ADX at 16.6 indicates a weak trend, but this doesn't negate the possibility of a significant move lower if key support levels are breached. The primary daily support is at $2,107.12, followed by $2,075.98. A break below $2,107.12 would be a strong bearish signal, invalidating any short-term bullish hopes and suggesting a deeper correction. This downside risk is amplified by the current correlation with risk assets like the S&P 500 (6557.15, down 0.52%) and Nasdaq (24000.61, down 0.65%), which are also showing signs of weakness. If these indices continue to fall, it's highly probable that ETHUSD will follow suit, as investor sentiment shifts towards safer assets.
The Waiting Game: Consolidation and Uncertainty
While both bullish and bearish scenarios have their merits, the current market structure, particularly on the 4-hour and daily charts, suggests a period of consolidation and uncertainty could prevail before a clear direction emerges. The ADX readings across multiple timeframes (1H: 16.46, 4H: 15.48, 1D: 16.6) are consistently low, indicating a lack of strong directional trend. This often precedes a period of sideways movement, where price oscillates within a defined range. The current price action around $2,116.86, situated between the 1H support at $2,112.08 and resistance at $2,125.13, exemplifies this. During such consolidation phases, traders often look for confirmation from multiple indicators or a decisive break of established levels. The Stochastic Oscillator, for example, is showing mixed signals: oversold on the 1-hour chart, but trending down on the 4-hour and showing a potential rise on the daily. This divergence highlights the indecision in the market.
The fundamental backdrop also contributes to this uncertainty. While Middle East tensions provide a bullish undertone for inflation hedges like gold (currently at $4,443.8, down 1.39% but holding firm below $4,500), their impact on risk assets like ETHUSD is less clear-cut. The strengthening dollar, driven by these same geopolitical fears, acts as a drag on cryptocurrencies. Furthermore, the lack of clear direction from major central banks regarding future interest rate policy adds another layer of ambiguity. Investors are caught between the fear of rising inflation and the possibility of economic slowdown, making it difficult to commit to strong directional bets. This environment often leads to choppy price action, where small moves are quickly reversed, and significant trends fail to materialize until a clearer catalyst emerges. The market is essentially waiting for more definitive data points or geopolitical developments to break the current stalemate.
The economic calendar offers potential catalysts, though clarity might be some time away. Upcoming high-impact events for the US Dollar, such as the ISM Manufacturing PMI (Actual: 52.4, Forecast: 51.5) and ISM Services PMI (Actual: 51.1, Forecast: 52), will be crucial in assessing the health of the US economy. Positive surprises could further strengthen the DXY, while weaker-than-expected numbers might provide some relief for risk assets. Similarly, any indication of shifting inflation trends, as suggested by the latest US CPI data (Actual: 6.926), will be closely scrutinized. For ETHUSD, the key will be how these macro indicators influence overall risk sentiment and, consequently, capital flows into and out of the crypto market. Until then, expect ETHUSD to remain range-bound, with volatility potentially increasing around significant economic data releases or geopolitical news headlines.
The Most Probable Path: A Cautious Bearish Bias
Considering the current technical indicators, the prevailing risk-off sentiment, and the strengthening dollar, the most probable scenario for ETHUSD in the short to medium term leans towards a cautious bearish bias. The confluence of bearish signals on the 1-hour and 4-hour charts, particularly the RSI below 40 and the MACD showing negative momentum, points towards further downside potential. The daily chart, while showing a weaker trend (ADX 16.6), still has the RSI hovering near the neutral 50 level, suggesting that a break below could accelerate the decline. The immediate support at $2,112.08 is a critical level; a breach here would likely confirm the bearish outlook and open the door for targets towards $2,107.12 and potentially $2,075.98. The probability of this scenario playing out is estimated at around 60-65%, given the current market conditions and the technical setup.
The bullish scenario, while possible, appears less likely without a significant shift in market dynamics. For ETHUSD to rally convincingly, it would need to overcome immediate resistance at $2,125.13 and then decisively break higher levels, such as $2,138.18 and $2,192.78. This would require a reversal in the DXY, a significant de-escalation of Middle East tensions, or a surprisingly dovish turn from the Fed – none of which seem imminent based on current data. The probability for a sustained bullish move in the near term is therefore estimated at 15-20%. The neutral, or consolidation, scenario carries a probability of 20-25%. This would involve ETHUSD trading sideways, perhaps between $2,100 and $2,150, until a clearer catalyst emerges. However, given the strong bearish undertones on shorter timeframes, even this neutral scenario carries the risk of eventually breaking lower.
Bearish Scenario: Downside Pressure Mounts
65% ProbabilityNeutral Scenario: Range-Bound Volatility
25% ProbabilityBullish Scenario: A Surprising Reversal
10% ProbabilityWhat I'm Watching This Week
The coming days will be crucial for ETHUSD. My focus will be on three key areas. Firstly, the immediate price action around the $2,112.08 support level. A failure to hold this could trigger the bearish scenario rapidly. Secondly, I'll be monitoring the DXY. Any significant dip in the dollar index, perhaps due to unexpected economic data or geopolitical de-escalation, could provide a window for ETHUSD to rally. Lastly, I'm watching the broader crypto market sentiment and the performance of Bitcoin (currently at $69,915). If BTCUSD shows signs of a sustained recovery, it could lift ETHUSD along with it. However, given BTCUSD's own bearish signals (1D ADX at 16.6), this seems unlikely in the immediate short term. The key is to wait for confirmation and avoid premature entries in this uncertain environment. Managing risk remains paramount as we navigate these choppy waters.
Frequently Asked Questions: ETHUSD Analysis
What happens if ETHUSD breaks below the $2,112.08 support level?
A break below $2,112.08 on the 1-hour chart would likely signal further downside, invalidating short-term bullish hopes. The next targets would be $2,104.40 and potentially the daily support at $2,107.12, increasing the probability of the bearish scenario playing out.
Should I buy ETHUSD at current levels of $2,116.86 given the mixed signals?
Buying at current levels of $2,116.86 is not recommended without confirmation. While the 1-hour Stochastic is oversold, the overall trend on longer timeframes and the bearish signals on the 1-hour MACD suggest caution. A more prudent approach would be to wait for a confirmed break above $2,138.18 or a clear bounce from support levels.
Is the RSI at 31.49 on the 1H chart a strong sell signal for ETHUSD?
An RSI of 31.49 on the 1-hour chart indicates bearish momentum and suggests that ETHUSD is approaching oversold conditions on this timeframe. However, it's not a standalone sell signal. It should be considered alongside other indicators like MACD and Stochastic, and confirmed by price action breaking key support levels.
How will upcoming US economic data like ISM PMIs affect ETHUSD this week?
Upcoming US ISM PMI data (Manufacturing: Actual 52.4, Services: Actual 51.1) will be crucial. Stronger-than-expected results could boost the DXY and pressure ETHUSD, reinforcing the bearish outlook. Conversely, weaker data might improve risk appetite and support a potential ETHUSD recovery towards resistance levels.
📊 Indicator Dashboard
| Indicator | Value | Signal | Interpretation |
|---|---|---|---|
| RSI (14) | 31.49 | Sell | Oversold on 1H, but needs confirmation from price action. |
| MACD Histogram | -44.79 | Sell | Negative momentum continues on 1H, indicating selling pressure. |
| Stochastic | 11.46 / 18.17 | Sell | Deeply oversold on 1H, suggesting potential for a short-term bounce, but trend is down. |
| ADX | 16.6 | Neutral | Weak trend strength on Daily, indicating range-bound conditions or a trend about to emerge. |
| Bollinger Bands | Lower Band Breach | Bearish | Price below lower band on 1H suggests potential oversold condition, but confirms downside pressure. |
Key Levels
Track markets in real-time
AI-powered analysis, technical indicators and real-time price data.
Join Our Telegram Channel
Breaking market news, AI analysis and trading signals instantly.
Join Channel